

 PDF
PDF ePub
ePub Citation
 Print
Print


INTRODUCTION
The environmental pollutant 2,3,7,8-tetrachlorodibenzo-p-dioxin (TCDD) is one of the most potent toxins. TCDD is persistence in the environment as a poisonous chemical and generates as a byproduct of many industrial processes such as metal production and fuel combustion (1). Exposure to TCDD induces a wide range of adverse health effects in the reproductive, immune, and endocrine systems, and the liver (2, 3). The mechanism of TCDD toxicity involves activation of the aryl hydrocarbon receptor (AhR), which is a ligand-activated transcription factor and a member of the basic helix-loop-helix (bHLH)-Per-Arnt-Sim (PAS) superfamily (3). The activated receptor heterodimerizes with the AhR nuclear translocator (ARNT) in the nucleus and binds xenobiotic response elements (XREs) (4), inducing expression of many target genes, including Phase III drug transporters (5).
Phase III drug transporters are divided into the following subgroups: ATP-binding cassette (ABC) -transporters that utilize energy generated by ATP hydrolysis, and organic cation transporters (OCT) and organic anion-transporting polypeptides (OATP) that utilize the energy in the proton gradient (6).
Accumulating evidence suggests that TCDD induces expression of the ABC-transporter genes and proteins, such as ABCC4 in HepG2 cells (7), P-gP, MRP2, and ABCG2 in the blood-brain barrier (8), and ABCC/MRP 2, -3, -5, and -6 mRNA expressions in the liver (9). In our previous study, expression of the ABCG2 gene was significantly induced by TCDD in HepG2 cells (10), suggesting that the ABCG2 gene is high sensitive to TCDD exposure.
The ABC subfamily G 2 (ABCG2) transporter is critically involved in multidrug resistance of human cancer (11). These transporters mediate ATP-dependent drug efflux, and are thereby associated with reduction of intracellular drug accumulation. Overexpression of ABCG2 was shown to underlie cancer cell resistance to mitoxantrone, doxorubicin, paclitaxel, and etoposide (12). However, there is lack of knowledge about the acquired anti-cancer drug resistance conferred by TCDD through induction of the ABCG2.
In this study, cisplatin (cis-diamminedichloroplatinum, CDDP), one of the most effective anticancer agents to treat solid tumors, was used as a prototype anticancer drug because of its ability to induce acquired resistance (13). A number of drug transporters, including copper uptake transporter (CTR1), copper efflux transporting P-type ATPases (ATP7A, ATP7B) (14, 15), and multidrug-resistance-related protein (MRP2) (16) contributes to cisplatin resistance. Other solute carrier (SLC) transporter subfamilies, such as organic cation transporter and multidrug and toxin extrusion types of transporters (17), are also involved in cisplatin resistance. Until present, the mechanism of acquired cisplatin resistance in cancer cells through induction of the ABCG2 gene in the presence of cisplatin has not been described. Therefore, in this study, we investigated whether induction of ABCG2 gene expression by TCDD treatment caused human cancer cells to acquire resistance to cisplatin.
Previous studies have reported that inducing transcription of the ABCG2 gene requires the AhR-signaling pathway (18, 19). It has been reported that constitutive activation of AhR leads to ABCG2 up-regulation in cisplatin-resistant esophageal carcinoma cells, which cisplatin resistance originated from parental cells (20). However, it is still unknown whether activation of the AhR-signaling pathway may be implicated in cisplatin resistance acquired in cancer cells after exposure to TCDD.
The aim of this study was to investigate the effect of TCDD pretreatment on the cisplatin responsiveness of human cancer cells by assessing expression of the ABC-drug transporter genes in TCDD-treated cancer cells with acquired cisplatin resistance. In particular, we examined whether the AhR-signaling pathway was the principal pathway involved in cisplatin resistance acquired after TCDD pretreatment. Our results demonstrate that pretreatment with TCDD confers cisplatin resistance to cancer cells, especially colon cancer LS180 cells through AhR-dependent induction of the ABCG2 gene. However, the TCDD-induced acquired cisplatin resistance was shown to be cancer cell-type-specific and additional experiments are required to further elucidate the molecular mechanisms of acquired resistance to cisplatin in each cell types.
MATERIALS AND METHODS
Chemicals
The clinical formulation containing 50 mg/100 mL cisplatin (CDDP) was purchased from Ildong Pharma Co. Ltd. (Seoul, Korea). TCDD dissolved in DMSO was obtained from Cambridge Isotopes Laboratories (Andover, MD, USA) at 99% purity. Kaempferol, 3-(4,5-dimethylthiazol-2-yl)-2,5-diphenyltetrazolium bromide (MTT) powder, and DMSO were purchased from Sigma (St. Louis, MO, USA). The cell culture media, RPMI 1640 and Dulbecco's modified Eagle's medium (DMEM) with high glucose were purchased from Welgene Inc. (Daegu, Korea). Also, cell culture media as Eagle Minimum Essential Medium (EMEM) with glutamine and Iscove's modified Dulbecco's medium (IMDM) were purchased from ATCC (Manassas, VA, USA) and Sigma, respectively. Antibiotics and L-glutamine were purchased from GIBCO BRL (Grand Island, NY, USA). The fetal bovine serum (FBS) was obtained from Invitrogen (Carlsbad, CA, USA).
Cell lines and cell culture
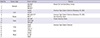
To assess tissue- and cell-type-specific survival phenotypes, we used human cell lines originated from different types of tumors. Table 1 shows the sources of the cell lines. Gastric (SNU668, MKN45, SNU601), breast (MDA-MB-231), astroglial (CRT-MG), non-small cell lung carcinoma (A549, H460), and lymphoma (Jurkat) cell lines were grown in RPMI 1640; breast (MCF7), glioblastoma (U373-MG, U87-MG), and Hep3B liver cancer cells were cultured in DMEM; HepG2 liver and colon (LS180, Caco-2) cancer cell lines were grown in EMEM, and leukemia cell lines (HL60, K562) were cultured in IMDM. Each cell culture medium, except for that used for Caco-2 cells, was supplemented with 10% heat inactivated FBS, 1% antibiotics and 1% L-glutamine; culture medium for Caco-2 cells contained 20% FBS. The sensitivity of cancer cells to cisplatin was evaluated by measuring cell viability. Cancer cells were treated with cisplatin by dose-dependent manner for one day. Two types of cancer cell lines were identified: 1) cisplatin-sensitive cell lines, cell viability was decreased by cisplatin to 70% compared with control, and 2) cisplatin-resistant cell lines, cell viability was >80% after treatment with cisplatin (Table 1).
Cell viability by MTT and MTS assays
To estimate cell recovery after TCDD pretreatment, cell viability was measured by MTT- and MTS-based cell proliferation assays depending on cell type (21). For the MTT assay, the medium was removed from each well and replaced with 1 mL of fresh medium, containing 100 µL of 5 mg/mL MTT solution. Cells were incubated at 37℃ in a humidified atmosphere of 95% air and 5% CO2 for 2-3 hr, after which the MTT-containing medium was aspirated, 500 µL of DMSO (99% purity;) was added to each well, and a formazan reaction product was measured within 5 min at 570 nm using the VERSAmax ELISA reader (Molecular devices, Sunnyvale, CA, USA). The MTS cell viability assay was performed according to the manufacturer's instructions (CellTiter 96 Aqueous Non-Radioactive Cell Proliferation Assay, Promega, Madison, WI, USA), and a soluble formazan product was measured by spectrophotometry at 490 nm using the VERSAmax ELISA reader.
Multiplex reverse transcription-polymerase chain reaction (RT-PCR) assay
To measure expression level of the drug transporter genes, 25 multiplex RT-PCR assays were performed in this study. Cells were treated with 5 nM and 10 nM TCDD depending on cell-type for two days, and then, followed with 5 µg/mL and 10 µg/mL cisplatin depending on cell type for one day. After treatment, cells were washed once with PBS, immediately scraped and centrifuged at 13,000 rpm for 1 min. Cell pellets were frozen in liquid nitrogen for 5 min and stored at -80℃ until analyzed as previously described (22). In brief, isolated RNA was reverse transcribed using reverse transcriptase (Invitrogen) and an oligo(dT) primer at 37℃ for 1 hr. Complementary DNA (cDNA) was amplified with 200 µM dNTP, 15 mM MgCl2, Taq polymerase (Solgent, Seoul, Korea) and each primer using GeneAmp PCR9600 (Peklein-Elmer, Boston, MA, USA). The cycling conditions were as follows: pre-denaturing at 94℃ for 5 min, 30 cycles of denaturing at 94℃ for 30 sec, annealing at 57℃ for 30 sec, and final extension at 72℃ for 5 min. PCR products were separated by electrophoresis in 2% agarose gels at 90 V for 40 min, and analyzed with Kodak Image Station 4000MN (Rochester, NY, USA).
Quantitative real-time RT-PCR
Total cell RNA was isolated using RNAiso Plus reagent (Takara, Shiga, Japan) according to the manufacturer's instructions. cDNA was synthesized from total RNA (1 µg) treated with DNAase 1 (Invitrogen) using the PrimeScript™RT reagent kit (Takara). Real-time RT-PCR was performed using the SYBR Green Master Mix system (Applied Biosystems Inc, Carlsbad, CA, USA) according to the manufacturer,s instructions. The specific primers used for amplification were: ABCG2, (NM_004827.2.), forward: 5'-TGGCTGTCATGGCTTCAGTA-3' and reverse 5'-GCCACGTGATTCTTCCACAA-3' (205-bp fragment); GAPDH, (CR_608433.1), forward 5'-GCAAGAGCACAAGAGGAAGAG-3' and reverse 5'-CTACATGGCAACTGTGAGGAG-3' (103-bp fragment); CYP1A1, (NM_000499.3), forward: 5'-CTACCCTGGACTTGCCTCTG-3' and reverse 5'-CTCCTGGCTCAAGCACAACT-3' (100-bp fragment). Real-time RT-PCR was performed using StepOnePlus™ real-time PCR machine (Applied Biosystems Inc). The human GAPDH gene was amplified in parallel as the internal control. Amplification was performed at 95℃ for 10 min, followed by 40 cycles at 95℃ for 15 sec, 60℃ for 15 sec and 72℃ for 30 sec. A fluorescence signal was acquired at the end of every PCR cycle to monitor DNA amplification. Relative changes in gene expression were evaluated by the 2(-ΔΔCt) method: ΔCt was calculated by substracting the Ct of GAPDH from the Ct of the transcript of interest, ΔΔCt was then calculated by substracting the ΔCt of the untreated cells from the ΔCt of the treated cells. The fold change of gene expression was calculated by the equation 2-ΔΔCt (10).
Transfection with small interference RNA (siRNA)
SiRNA duplexes (IDT Inc. Coralville, IA, USA) were designed to target the human ABCG2 transcripts (NM004827.2). The ABCG2 siRNA sequences (sense strand indicated) were 5'-UUC CUA AAU CCU ACC CAG UUC CUC CAC-3' and 5'-GGA GGA ACU GGG UAG GAU UUA GGA A-3'. The transfection procedure was performed according to the manufacturer'-s protocol. Cells were transfected with the ABCG2 siRNA duplexes (30 nM final concentration) using Lipofectamine 2000 (Invitrogen). After 6 hr, transfection medium was replaced with regular culture medium, and cells were incubated for an additional 12 hr. The same concentration of control siRNA (30 nM final concentration) was used for control cells. To analyze cell viability, transfected cells were pretreated with 10 nM TCDD for one day and then with 10 µg/mL cisplatin for 12 hr. Efficiency of the ABCG2 knockdown was evaluated by quantitative real-time RT-PCR after 48 hr.
Western blotting
Cell lysates containing 40 µg of protein were boiled at 95℃ for 5 min and subjected to SDS-PAGE using 8% gels. The separated proteins were transferred onto the Immobiolon-P polyvinylidenedifluoride (PVDF) membrane (Millipore, Billerica, MA, USA) for 80 min at 64 volts using a transfer kit (Amersham, Buckinghamshire, UK). Membranes were blocked and probed with primary antibodies overnight at 4℃. After washing with Tris-buffered saline containing 0.1% Tween-20 (TBS-T) for 30 min, the immunoblot was incubated with peroxidase-conjugated secondary antibodies for 1 hr at room temperature. Membranes were washed with TBS-T for 40 min, and antigen-antibody complexes were visualized by chemilumnescence reagents (Millipore), detected by EZ-capture imaging system (ATTO, Tokyo, Japan), and quantified by densitometry using ATTO densitograph CS Analyser.
Determination of intracellular platinum accumulation
Cells treated with TCDD and cisplatin were washed extensively three times with ice-cold PBS to remove free platinum as described previously (23). Then, cells were harvested by scraping and centrifuged at 13,000 rpm for 1 min. Immediately, 80-100 µL of radioimmunoprecipitation assay (RIPA) lysis buffer was added, and cells were lysed on ice for 15 min, sonicated and centrifuged at 12,000 rpm at 4℃ for 15 min. Supernatants were collected and stored at -80℃ until analysis. Protein concentration was determined using the Bradford assay. The total platinum content in cell lysates was analyzed by inductively coupled plasma mass spectrometry (ICP-MS; Neodin Medical Institute, Seoul, Korea).
Statistical analysis
All variables were tested in three independent experiments. Data were statistically evaluated by one-way analysis of variance (ANOVA) followed by the post-hoc Tukey test for multiple comparisons or Student's t-test by using commercial software SPSS 10.0. A difference was considered statistically significant at P<0.05.
RESULTS
Cisplatin resistance acquired by pretreatment with TCDD
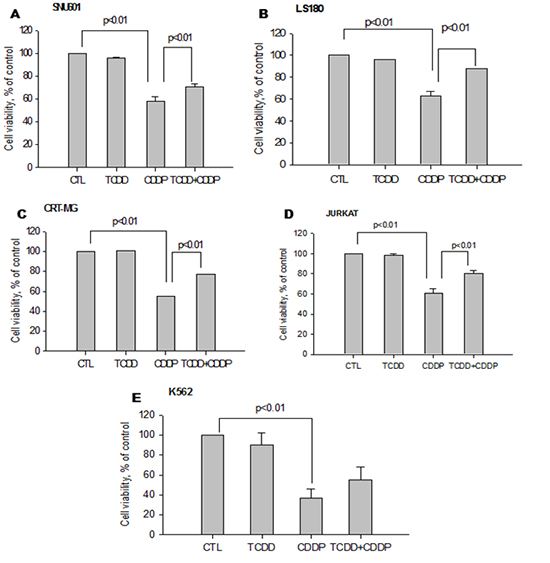
To investigate the effect of TCDD pretreatment, we performed preliminary experiments to select concentrations of TCDD that did not decrease cell viability (>90%) (Supplementary Fig. 1) and concentrations of cisplatin that reduced cell viability (<60%) (Supplementary Fig. 2). Both cisplatin-sensitive and -resistant cell lines were pretreated with TCDD. Only four of the cisplatin-sensitive cell lines, SNU601, LS180, CRT-MG and Jurkat, including K562 acquired resistance to cisplatin after pretreatment with TCDD, demonstrating a significant increase (up to 70%) in cell viability compared to the cells treated with cisplatin alone (Fig. 1). However, other cisplatin-sensitive cell lines, such as MDA-MB-231 and Hep3B, did not demonstrate an increase in cell viability due to TCDD pretreatment. On the contrary, TCDD enhanced cisplatin cytotoxicity in these cell lines without being cytotoxic itself (Fig. 2). However, in the cisplatin-resistant cell lines MCF-7, SNU668, and MKN45, no changes in cell viability were observed after TCDD pretreatment and cisplatin treatment (Supplementary Fig. 1).
Increase in ABCG2 gene expression by TCDD pretreatment
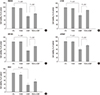
To elucidate the mechanisms of TCDD-induced resistance to cisplatin, the expression of the ABCG2 gene was analyzed by quantitative real-time RT-PCR. Among the cells with acquired cisplatin resistance, ABCG2 expression was analyzed in gastric, colon and brain cancer cells that originated from solid tumors. As shown in Fig. 3A, TCDD treatment alone resulted in a significant increase of ABCG2 expression (7.12- and 41.07-fold) in the gastric (SNU601) and colon (LS180) cancer cell lines, respectively, while no changes were observed in the brain (CRT-MG) cancer cells. However, subsequent treatment with cisplatin increased the ABCG2 gene expression in all three cell lines, including SNU601, LS180 and CRT-MG. However, TCDD alone or in combination with cisplatin did not significantly alter ABCG2 expression in the breast (MDA-MB-231) or liver (Hep3B) cell lines (in Fig. 3B). Results of real-time RT-PCR analysis demonstrated that the upregulation of ABCG2 expression in SNU601, LS180 and CRT-MG cells treated with cisplatin after TCDD pretreatment corresponded to the increase in their cell viability.
Expression of drug transporter genes in solid tumor cancer cells with acquired cisplatin resistance
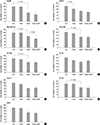
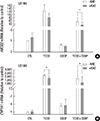
To determine whether other drug transporter genes contributed to cisplatin resistance, we examined the expression of 25 drug transporter genes. As shown in Fig. 4A, in SNU601 cells, TCDD alone significantly induced expression of the ABCC3 (1.54-fold), ABCC5 (1.51-fold), and SLC29A2 (1.71-fold) genes relative to the control, while subsequent treatment with cisplatin resulted in even more dramatic increases in the expression of the ABCC1, ABCC3, ABCC5, and SLC29A2 genes (3.5-, 2.9-, 1.7- and 1.9- fold, respectively) compared to the cells exposed to cisplatin alone. As shown in Fig. 4B, TCDD alone did not change expression of the ABC and non-ABC transporter genes in the LS180 cell line compared to untreated cells, whereas, subsequent treatment with cisplatin resulted in a significant increase of ABCC1, ABCA3, and MVP expression compared to cells treated with cisplatin alone (Fig. 4B). In CRT-MG cells pretreated with TCDD, only SLC29A1 gene expression was slightly increased compared to control (Fig. 4C), however, when TCDD treatment was followed with cisplatin, other transporter genes, ABCC1, ABCC5, ABCA3, ABCA2, ABCB4, and ABCG1 as well as SLC29A1, were also upregulated. Among the ABCC1, ABCB4, and SLC29A1 were significantly upregulated (4.6-, 4.6- and 2.6-fold, respectively) by combined treatment with TCDD and cisplatin (Fig. 4C). Collectively, these experiments indicate that, in cancer cells stemming from solid tumors, TCDD pretreatment caused upregulation of the ABC and non-ABC transporter genes that correlated with acquired resistance to cisplatin and increased cell viability.
Expression of drug transporter genes in hematological cancer cell lines
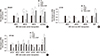
We also analyzed the expression level of these genes in hematological cancer cells with acquired resistance to cisplatin. Treatment with TCDD alone did not produce any significant effects on the expression of drug transporter genes in Jurkat or K562 cell (Fig. 5). Similarly, combined treatment of these cells with TCDD and cisplatin did not significantly change expression of the drug transporter genes in these cells compared to those treated with cisplatin alone.
Expression of drug transporter genes in cisplatin-sensitive cell lines
We also analyzed the expression pattern of the ABC transporters in the cisplatin-sensitive Hep3B and MDA-MB-231 cell lines, which did not acquire cisplatin resistance after TCDD pretreatment. Interestingly, the combination of TCDD and cisplatin resulted in a significant increase of ABCC1 gene expression in Hep3B cells (Fig. 6A), while the increase in ABCC1 was caused with TCDD alone in MDA-MB-231 cells (Fig. 6B). No changes were observed in the expression of other drug transporter genes after treatment with TCDD or cisplatin in Hep3B and MDA-MB-231 cells.
Reduction of intracellular platinum concentration by TCDD pretreatment
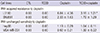
To determine the effect of TCDD pretreatment on cisplatin efflux, the amount of total intracellular platinum was measured by ICP-MS. Based on highly increase of ABCG2 expression, the SNU601 and LS180 cell lines were chosen to measure platinum content. Compared with cisplatin treatment alone, cisplatin treatment after TCDD pretreatment resulted in a 2-fold reduction of intracellular platinum content in the LS180 cell line, and a 1.3-fold reduction in the SNU601 cell line (Table 2). There was no difference in the platinum concentration of the cisplatin-sensitive Hep3B and MDA-MB-231 cell lines treated with cisplatin alone or a combination of cisplatin and TCDD.
AhR-dependent increase of ABCG2 gene expression
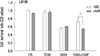
Next, we were interested to understand whether the AhR-signaling pathway was involved in the upregulation of the ABCG2 gene and acquired cisplatin resistance induced by TCDD. To investigate this, we performed inhibition experiments using the colon cancer LS180 cell line and kaempferol, which is an AhR antagonist, and inhibitor of ABCG2 transcriptional activation. As expected, treatment with kaempferol reduced the increase in the ABCG2 gene expression induced by TCDD alone or in combination with cisplatin (Fig. 7A). Expression of the CYP1A1 gene, a member of the cytochrome P450 superfamily used as a positive control, was also inhibited by kaempferol (Fig. 7B).
Acquired cisplatin resistance induced by TCDD is AhR - dependent
Kaempferol also inhibited the increase in cell viability of LS180 cells treated with cisplatin after pretreatment with TCDD (Fig. 8), suggesting that AhR-dependent induction of the ABCG2 gene contributed to cisplatin resistance conferred by TCDD pretreatment of colon cancer cells. To further examine the involvement of the ABCG2 gene in acquired cisplatin resistance, we used ABCG2-specific siRNA (siABCG2) to suppress ABCG2 gene expression in the LS180 cell line. When siABCG2-transfected LS180 cells were treated with TCDD and then with cisplatin, the increase in ABCG2 gene expression was reduced when compared to in control cells (Supplementary Fig. 3A), which resulted in a decrease of the cell survival rate (Supplementary Fig. 3B). Collectively, these results demonstrated that induction of the ABCG2 gene in cancer cells contributed to cisplatin resistance due to pretreatment with TCDD.
DISCUSSION
TCDD induced drug transporters were diverse in each cell types. Our results (Fig. 3, 4, 5, 6) demonstrate that acquired resistance to cisplatin correlated with the induction of expression of some transporter genes, especially that of the ABCG2 gene in the SNU601, LS180 and CRT-MG cell lines, but not in the MDA-MB-231 and Hep3B cells. The Jurkat and K562 cell lines also did not present an increase in expression of the ABCG2 gene (data not shown) or other transporter genes (Fig. 5). In CRT-MG cells, transcription of the ABCG2 gene was induced after cisplatin treatment following TCDD pretreatment. Over-expression of other drug transporters may also contribute to cisplatin resistance. We found that the expression of some other transporters was induced by TCDD in the examined cancer cell lines. Expression of several ABC and non-ABC transporter genes, including ABCG2, ABCC3, ABCC5, and SLC29A2, was significantly increased by TCDD treatment alone in SNU601 cells, while ABCG2, SLC29A1, and ABCC1 were upregulated in LS180, CRT-MG, and MDA-MB-231 cells, respectively (Fig. 3, 4, and 6). Moreover, the ABC and non-ABC transporters induced by cisplatin after TCDD pretreatment were also induced by TCDD treatment alone (Fig. 3, 4). However, ABCG2 in CRT-MG and MVP in LS180 cells were induced by combined treatment with cisplatin and TCDD, but not by TCDD alone. We also observed that TCDD had no significant effect on the expression of the ABCG2 and ABCC transporter genes in the liver (Hep3B) and brain (CRT-MG) cell lines, which corresponds to previously obtained results (24). On the other hand, some studies have reported the induction of the ABCC/MRP genes by TCDD in the liver cell lines (9, 25). The reasons for these discrepancies are unclear and may be explained by cell line specific differences, dose or duration of the TCDD treatment. Cell line specific effects of TCDD pretreatment on sensitivity to cisplatin may be associated with transcriptional activation of drug transporters and other factors (26).
Among the drug transporters examined in our study, data obtained for solute carrier transporters, including SLC29A2 in SNU601 cells and SLC29A1 in CRT-MG cells (Fig. 3), are not reported in other studies. TCDD induction of the genes of the SLC29 family has not been previously reported in cancer cell lines. In general, regulation of expression of genes of the SLC29 family, which encode nucleoside and nucleobase transporters expressed on the cell surface (27), is not well elucidated. For example, hypoxia repressed SLC29A1 expression in cardiomyocytes, which depended on the HIF-1 transcription factor containing an AhR nuclear translocator (28), suggesting that an AhR-dependent transcription factor may play a role in the induction of SLC29 family gene expression by treatment with TCDD. Multidrug resistance in hematological malignancies is associated with the overexpression of several multidrug resistance genes, such as ABCB1, ABCC1, and MVP (29). In our study, acquired cisplatin resistance was induced by TCDD in the Jurkat and K562 cell lines without changes in the expression of ABCG2 and other transporter genes (Fig. 5). The drug transporters, ABCB1, ABCC1, and ABCC2 are involved in the ATP-dependent efflux of drugs or drug-glutathione conjugates facilitating their elimination. Therefore, in the cell lines treated with TCDD, acquired cisplatin resistance may be related to glutathione and glutathione conjugates, which are known to regulate cisplatin-sensitivity in cancer cells (30).
It is well-established that induction of the ABCG2 gene depends on the activation of the AhR signaling pathway (19, 31). However, the mechanism of acquired resistance to cisplatin conferred by TCDD through AhR may not be fully elucidated because there are other drug transporters than ABCG2, as well as unknown functional activities of the AhR pathway. These AhR-dependent and -independent mechanisms can contribute to acquired resistance to cisplatin. This notion is supported by our findings that TCDD-induced acquired cisplatin resistance in the Jurkat and K562 cells without upregulation of ABCG2 gene expression. In addition, other interactions of the endogenous AhR pathway may be implicated in acquired cisplatin resistance. AhR signaling has been regarded as a potential target for cancer treatment (32) depending on tissue and cell specificity (33).
We determined here that the induction of drug transporter genes and endogenous expression of AhR were closely related in a few cancer cells. Among cell lines, LS180 and SNU601 cell lines with acquired cisplatin resistance (Fig. 3) demonstrated significant induction of the ABCG2 gene and high basal levels of AhR (Supplementary Fig. 5), confirming previous findings that LS180 cells abundantly expressed functional AhR (34). On the contrary, the cisplatin-sensitive Hep3B and MDA-MB-231 cell lines showed low basal levels of AhR (Supplementary Fig. 5), and an increase in the expression of the ABCG2 gene was not observed in these cell lines. Among the transporters induced by TCDD pretreatment, ABCG2 was markedly upregulated in the SNU601 (gastric), LS180 (colon), and CRT-MG (brain) cell lines, which correlated with acquired resistance to cisplatin (Fig. 3). TCDD treatment alone was also determined to significantly increase of ABCG2 gene expression in the SNU601 and LS180 cell lines. In CRT-MG cells, however, expression of the ABCG2 and SLC29A1 genes was significantly induced by combined treatment with TCDD and cisplatin (Fig. 3, 4), suggesting potentiating effect arising from an as yet unknown mechanism.
In fact, the striking induction of ABCG2 by TCDD-pretreatment observed in this study could not be directly associated with acquired cisplatin resistance through platinum efflux because cisplatin is not a substrate for the ABCG2 (17). We showed that ABCG2 inhibition reversed the acquired cisplatin resistance (Supplementary Fig. 4B), suggesting that induction of the ABCG2 gene may play a role in acquiring resistance through means other than efflux-based mechanisms. These drug-resistance mechanisms involved in cancer cell proliferation (35), stem cell-like behavior (36), carcinogenic effects of proinflammatory cytokines and estrogen (37) or synergistic tumorigenic effects induced by human epidermal-growth factor receptor 2 (38), need to be further elucidated. However, in this study, the TCDD effect on drug efflux was investigated because cell platinum content was reduced in cell lines with acquired cisplatin resistance compared to that in non-resistant cell lines (Table 2). This phenomenon may be explained not only by ABCG2 function but also by the activity of other transporters, including ABCC1 and ABCC2, which transport glutathione-conjugated cisplatin (17), and MVP, which is directly activated by cisplatin (39).
This study is the first investigation of acquired cisplatin resistance induced by pretreatment with TCDD in a wide range of human cancer cell lines. However, the reason for differential response to TCDD pretreatment in various tumor cell lines may be associated with differences in AhR-activity, expression of drug transporters, and cell responsiveness to cisplatin. The results of our study indicate that the induction of the ABCG2 gene by TCDD is involved in cancer-specific resistance to cisplatin. Further studies of AhR-independent mechanisms and involvement of several cellular processes such as inactivation of cisplatin by the glutathione system, inhibition of apoptotic pathways, and regulation of drug transporters (40) are needed to elucidate the mechanism by which resistance to cisplatin is acquired.


 XML Download