

 PDF
PDF ePub
ePub Citation
 Print
Print


INTRODUCTION
According to the 2010 data from the Statistics Korea, the elderly population in Korea increased 24.3% from 2005 to 2010, which was 12.2 times greater than the increase in the total population (2.0%) during the same time period (1, 2). With this significant increase in the elderly population, it is important that increasing attention be given to help maintain their physical and social functioning while minimizing chronic disease and disability to enhance their quality of life.
Decreased muscle mass and bone mineral density are significant changes that occur with aging, and these are often associated with an inability to adapt to external stress resulting in falls, trauma, functional disability, increased hospitalization, decreased quality of life, and increased mortality (3, 4, 5). Thus, diagnosing osteoporosis and sarcopenia is not only important clinically, but also has significant public and social ramifications. Determining the relationship between osteoporosis and sarcopenia may help maintain musculoskeletal function and prevent fractures associated with accidental falls.
The diagnostic criteria have already been established for osteoporosis (5), but there is still controversy regarding the diagnostic criteria and markers for sarcopenia. Early studies by Baumgartner et al. suggested defining sarcopenia based on appendicular skeletal muscle divided by height squared (Ht2) (7). Janssen et al. used biochemical impedance analysis (BIA) to measure total muscle mass and divided this mass by weight to define sarcopenia (4). In recent studies, sarcopenia is defined as a systemic continuous decrease in skeletal muscle strength and muscle mass so that the diagnosis of sarcopenia must be supported by decreased muscle mass and functional muscle strength (8). Until now, many studies of muscle mass and BMD have been carried out (9, 10, 11), and they showed that low muscle mass is correlated with low BMD. Unfortunately, their study populations were inconsistent and their definitions of sarcopenia different. In our study, by presenting a cut-off value of the muscle loss that can predict osteoporosis in Korean elderly individuals, we attempted to identify the relationship between muscle loss and osteoporosis.
MATERIALS AND METHODS
Subjects
This study is based on data obtained in the second and third years (2008-2009) of the Korea National Health and Nutritional Examination Survey (KNHANES) IV and the first year (2010) of the KNHANES V (2). The KNHANES is a cross-sectional study and has been conducted periodically since 1998 to assess the health and nutritional status of the civilian non-institutionalized population of Korea and has generated nationwide and representative statistical data by self-administered questionnaires on health status, health behaviors, and nutritional status. Data was collected via household units and selected based on a stratified, multistage probability sampling design. The selection was made from sampling units based on the geographical area, gender, and age using household registries. The details of the KNHANES IV and V have been previously described (12, 13). A total of 4,772 individuals aged ≥65 yr participated. Of the 4,772 participants, we excluded individuals who did not have DXA results (n=1,452) and those with a history of stroke, coronary artery disease, thyroid disease, lung disease, liver and renal disease, and any cancers and those taking medications likely to affect bone or soft tissue metabolism, such as thyroid hormone, bisphosphonates, SERM, or weight controlling drugs (n=841). The exclusion criteria were aimed to ensure selection of healthy participants and to minimize the confounding effects on muscle mass. The present study included 2,479 elderly participants (1,308 men and 1,171 women).
Measurement of bone density and appendicular skeletal muscle mass
All participants underwent the DXA (DISCOVERY-W fan-beam densitometer; Hologic Inc., MA, USA) for assessment of BMD and body composition. Standardized daily quality control of these DXA in instruments was performed using spine phantom provided by the manufacturer before the study commenced. The BMD (g/cm2 or T-score) of the whole body, femoral neck, and lumbar spine (L1-4) were analyzed. The diagnosis of osteoporosis was made using the WHO T-score criteria (T-score<-2.5), and the maximum BMD value for Japanese patients was used as a reference due to the lack of established diagnostic criteria for Koreans (14, 15). Appendicular skeletal muscle (ASM) mass was calculated as the sum of muscle mass in arms and legs, assuming that all non-fat and non-bone tissue is skeletal muscle (16). According to the definition proposed in previous studies, we used muscle mass indexes, the height adjusted ASM (ASM/Ht2, kg/m2) (5, 7, 17).
Anthropometric and laboratory measurements
Body weight and height were measured to the nearest 0.1 kg and 0.1 cm, respectively. BMI was calculated as weight/height2 (kg/m2). Waist circumference was measured at the midpoint between the lower border of the rib cage and the iliac crest using a non-elastic tapeline. Blood pressure was measured twice at a 5-min interval on the right arm using a standard mercury sphygmomanometer (Baumanometer; Baum, Copiague, NY, USA) and recorded as an average of the two readings. Blood samples were collected during the health examination survey. These samples, taken from the antecubital veins, were refrigerated immediately and transported on dry ice to the designated central testing facility, and were analyzed within 24 hr of sampling. Serum 25(OH)D levels were measured using a gamma counter (1470 Wizard, Perkin-Elmer, Turku, Finland) with a radioimmunoassay (RIA) kit (DiaSorin, Stillwater, MN, USA) (2).
Statistical analysis
All data are presented as the mean±standard error (SE) for the continuous variables or as proportion (SE) for the categorical variables. The characteristics of the participants were compared according to sex using independent sample Student's t-tests for the continuous measures and Rao scatt chi-square tests for the categorical measures. Regression analysis was applied to assess the association between various parts of the BMDs and the two indexes of low muscle mass. The receiver operating characteristic (ROC) curve analysis was performed to determine the best cut-off value of low muscle mass for indicating osteoporosis. The areas under the ROC curve (AUC) were investigated for osteoporosis. The ROC curve was a graph of sensitivity plotted against (1-specificity) over all possible diagnostic cut-off values. The optimal cut-off values were obtained from the maximal Youden's index, calculated as (sensitivity+specificity-1) and the best combination of sensitivity and specificity. The odds ratios (ORs) and 95% confidence intervals (CIs) were calculated by logistic analysis to confirm the impact of low muscle mass, which was based on the cut-off value for osteoporosis, after making adjustments for age, fat mass, calcium intake, vitamin D status, smoking, alcohol consumption, and physical activity. Statistical analyses were performed using the survey procedure of SAS software (version 9.2; SAS Institute, Cary, NC, USA) to account for the complex sampling design and to provide nationally representative prevalence estimates. P<0.05 was considered statistically significant.
RESULTS
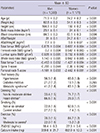
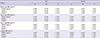
The study population comprised 1,308 men and 1,171 women with an average age of 71.9 yr for men and 74.2 yr for women. Height, weight, waist circumference, and muscle index were higher in men, and body fat index was higher in women. Diabetes was more prevalent in men, and hypertension and metabolic syndrome were more prevalent in women (Table 1). Of the index for sarcopenia, ASM/Ht2 was positively correlated with BMD in both men and women, and adjusting for age and body fat, still resulted in a positive correlation (Table 2).
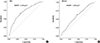
The ROC curve reflecting osteoporosis from ASM/Ht2 is shown in Fig. 1. The AUC of ASM/Ht2 for the prediction of osteoporosis was 0.705 (95% CI, 0.679-0.730; P<0.001) in men, and 0.598 (95% CI, 0.569-0.627; P<0.001) in women. The best cut-off value of ASM/Ht2 for indicating osteoporosis, according to the maximum of the Youden index, was 6.85 kg/m2 in men and 5.96 kg/m2 in women. Sensitivity and specificity were 66.9% and 66% in men, and 62% and 53.5% in women, respectively.
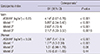
Odds ratios (ORs) for the low muscle mass in relation to osteoporosis are presented in Table 3. Both men and women subjects in the lower muscle mass group had increased risk for osteoporosis (men: OR, 4.14; 95% CI, 2.67-6.78; P<0.001, women: OR, 1.88; 95% CI, 1.41-2.5; P<0.001). After adjusting for osteoporosis risk factors (age, fat mass, calcium intake, vitamin D status, smoking, alcohol consumption, and physical activity), this association remained statistically significant in men (men: OR, 2.21; 95% CI, 1.33-3.37; P=0.0016, women: OR, 1.15; 95% CI, 0.81-1.65; P=0.44) (Table 3).
DISCUSSION
In our study, using ASM/Ht2 as an index for sarcopenia, muscle mass and BMD showed a positive correlation, verifying that as muscle mass decreases, the BMD of each body part shows a lower value as well. Especially through the ROC curve, ASM/Ht2 well reflected the risk of osteoporosis and indicated the best cut-off values (men 6.85 kg/m2, women 5.96 kg/m2) for sarcopenia. This result is similar to studies involving postmenopausal women and men concluding that there are correlations among body weight, muscle mass, and osteoporosis (10, 18, 19, 20). It can be explained that body weight acts as a stress on the skeletal system to promote bone formation mechanically by stimulating osteocytes to increase bone density (21), and muscle mass, like fat mass may have a protective effect on bone density through hormones (22). Also, the association between greater muscle mass and greater bone density is likely to be determined by multiple factors including common nutrition, life style and genes regulating size (23, 24).
Many studies have focused on sarcopenia since Irwin Rosenberg first identified the condition in 1989 (25) but a precise definition, measurement method, and index of sarcopenia have yet to be established. Baumgartner et al. measured ASM with DXA and defined sarcopenia as less than -2 standard deviations from the mean of ASM/Ht2 in a young population (7).
In Korea, interest in sarcopenia has increased, and numerous studies have been carried out. Kim et al.(26) studied sarcopenia in a Korean population and found a lower prevalence of sarcopenia (men 6.3%, women 4.1%) compared to Western countries when using ASM/Ht2 as the sarcopenia index (cut-off values for men and women were 7.40 kg/m2 and 5.14 kg/m2, respectively). In a KLoSHA study with a sample population of adults older than 65 yr, the prevalence of sarcopenia was 35.3% in men and 13.4% in women when ASM/Ht2 was used as the sarcopenia index (cut-off values for men and women were 7.09 kg/m2 and 5.27 kg/m2, respectively) (17). But a study of the prevalence of sarcopenia in Korea using the KNHANES data showed that weight-adjusted ASM is better than height-adjusted ASM in defining sarcopenia. When using ASM/Ht2, the prevalence of sarcopenia was 12.4% in men and 0.1% in women (cut-off values for men and women were 6.58 kg/m2 and 4.59 kg/m2, respectively) (12). Though these studies performed in Korea seem to suggest different cut-off values, this is because each study enrolled different study populations including various group of ages.
The present study, similar to other Korean studies, found that ASM/Ht2 was the best sarcopenia index for indicating osteoporosis, with cut-off values at 6.85 kg/m2 in men and 5.96 kg/m2 in women. The cut-off value for men ranged between Sarcopenia I (7.50) and II (6.58), and the cut-off value in women was higher than Sarcopenia I (5.38), which was the standard in previous Korean studies (12). The prevalence of sarcopenia in this study was 39.5% in men and 58.1% in women. Previous studies were limited in that the cut-off value for women was too low to determine prevalence, but using ASM/Ht2 as an index seems to have addressed this issue. In addition, when sarcopenia was based on the optimal cut-off value, the sarcopenia group had increased risk of osteoporosis both in men (OR, 4.14; P<0.001) and women (OR, 1.88; P<0.001). In particular, men (OR, 2.12; P=0.0016) with sarcopenia were more greatly affected than women (OR, 1.15; P=0.44), even after adjusting for age, fat mass, calcium intake, vitamin D status, smoking, alcohol consumption, and physical activity. This was demonstrated in previous studies showing that bone mass in men was more closely related to muscle mass than in women (27, 28, 29, 30, 31). The gender difference in the relationship between bone and muscle are explained by gender specific effects of sex hormones. In men, changes to bone and muscle are controlled by increasing levels of testosterone and IGF-1 resulting in increased muscle mass and strength, whereas in women, the higher level of estrogen results in bone mass tending to increase more rapidly in relation to muscle (27, 29). And in both genders, aging causes loss in bone and muscle; and the bone and muscle relationship is affected by gender differences in the rate of bone and muscle loss (32). Especially, age-related decrease in testosterone and IGF-1 levels may lead to decrease in muscle and bone in men, while, absolute level and degree of decline in testosterone are much lower in women, muscle mass can be relatively preserved. In addition, mechanical strain and estrogen share a common pathway involving activation of estrogen receptor-α (ER-α), and a decline in ER-α with menopause reduces the ability of mechanical loading to induce an osteogenic response (33, 34, 35). This mechanostat re-setting due to estrogen deficiency may explain the decoupling of muscle mass and bone density in women, with men tending to show higher correlations between muscle mass and real bone density. Therefore, this study suggests that for preventing osteoporosis, sarcopenia could be more emphasized in men.
A cross-sectional study, we were not able to verify causal relationships. However, participants had minimal radiation exposure during the study as they underwent the DXA study for assessment of both muscle mass and BMD simultaneously. And this showed a positive correlation between muscle mass and BMD in the Korean population. In addition, this study examined the relationship between sarcopenia and osteoporosis separately in each sex. In previous studies the prevalence rate of sarcopenia in women was too low because the cut-off value used for this group was 4.59-5.27. But in this study, the cut-off value for women was 5.96 so that it was possible to predict that the prevalence rate would be higher than previously calculated with the ASM/Ht2 index.
As mentioned above, osteoporosis and sarcopenia have common causal factors such as low levels of vitamin D, testosterone, estrogen, and insulin, as well as, reduced calorie intake and malnutrition (9, 10, 11). The present study identified that sarcopenia can increase the risk of osteoporosis and may lead to increased risk of bone fracture.
In conclusion, muscle mass is positively correlated with bone density in both men and women using the ASM/Ht2 index. The risk of osteoporosis increases when sarcopenia is diagnosed with a cut-off value of 6.85 kg/m2 in men and 5.96 kg/m2 in women. Concurrently diagnosing osteoporosis with sarcopenia may help prevent accidental falls and bone fractures.
 XML Download