

 PDF
PDF ePub
ePub Citation
 Print
Print


Introduction
Cholestasis is defined as an impairment of bile flow from the liver to the duodenum. There are several causes for cholestasis, including mechanical obstruction by choleliths or tumors, and the effects of many medications. In veterinary medicine, choleliths have been reported to occur less often than in human, and the occurrence of gallbladder (GB) mucocele has increased during recent decades [18].
GB emptying is considered to have a cleansing effect on biliary passages by emitting stored bile [117]. Inflammation or structural change in the biliary tract can interfere with the flow of bile and impair GB emptying, leading to cholestasis [1812]. Cholestasis has an effect on the epithelium of the biliary tract through its prolonged exposure to concentrated bile acids. As a result, the GB and bile duct can be damaged and become distended [1121820].
In veterinary medicine, the method used for evaluation of GB and bile duct dilation is generally reported as ultrasonography (US) [17121318]. US allows relatively easy, cheap, noninvasive and accurate assessment of the biliary system [17]. Measurement of GB volume has been described, and there are several US-based calculation methods. One of them is the ellipsoid method, which is based on the assumption that the GB has an ellipsoid shape [114]. In addition, US assessment of GB ejection fraction (EF) has been commonly used as an index of GB emptying. Through the results of previous studies, a fasting GB volume of < 1 mL/kg or a GB EF ≥ 25% have been suggested as indicative of a normal status when evaluating GB emptying in dogs [1318].
US evaluation of the common bile duct (CBD) in dogs has been used to evaluate biliary system obstruction, and the diameter of a normal CBD was previously proposed to be 3 mm [23]. A limitation of US assessments for GB and CBD is its dependence on operator skill and the difficulty in evaluating various GB shapes [12]. In addition, CBD scanning using US is thought to lack reproducibility due to reverberation artifacts secondary to the presence of intestinal gas and changes in CBD diameter during respiration [11]. In human medicine, several diagnostic methods including US, computed tomography (CT), magnetic resonance cholangiopancreatography, endoscopic US, and endoscopic retrograde cholangiopancreatography have been used to evaluate CBD diameter and determine the cause of dilation [2,3,6,15,16,19,21]. Among these modalities, CT examination allows detailed visualization of the biliary tract, assessment of the cause of any dilation, and differentiation of malignant and benign lesions. In human medicine, visibility of normal CBD and the hepatic duct in CT imaging has been reported in 82% and 66%, respectively, of normal subjects [1521].
CT assessment of normal GB and bile duct in dogs has not been previously reported. The purposes of this study are to validate the accuracy of US examination results by comparing them with values obtained via CT examination, to investigate the normal characteristics of the canine biliary system on CT images, to establish reliable criteria for CBD diameters considering body weight variation, and to compare CT measurement values for normal GB and bile ducts with those of dogs with possible cholestasis.
Materials and Methods
This study was conducted in accordance with the guidelines of the Chungnam National University Animal Care and Use Committee (CNU-00897). This study was composed of two experiments: Experiment 1 was performed to compare US and CT for evaluation of the biliary tract in normal beagle dogs; Experiment 2 was a retrospective study of biliary tract CT images in normal dogs without hepatobiliary diseases and in dogs with suspected cholestasis.
Experiment 1
Six beagle dogs without apparent hepatobiliary or pancreatic diseases were used to compare US with CT for evaluation of biliary tracts in normal dogs. The dogs were 4 male and 2 female beagles, weighing from 8.7 to 14.5 kg (mean ± SD, 11 ± 1.9 kg). Physical examinations, complete blood cell counts, serum chemistry analysis, abdominal radiography, and US were performed to determine the health status of these dogs. Hepatobiliary system and pancreas were intensively evaluated as being normal through diagnostic imaging.
The US and CT scanning of each dog were performed twice. In the pre-prandial examination, dogs were fasted for at least 12 h before examination but had free access to water. Three days after the pre-prandial scans, post-prandial examinations were performed at 120 min after a test meal of 10 g/kg, as described previously [13]. The CT scan was performed immediately after the US scan and both were performed under general anesthesia. Anesthesia was induced with 3.0 mg/kg of alfaxalone (Alfaxan; Jurox Pharm, Australia) intravenously. After endotracheal intubation, anesthesia was maintained with isoflurane (Ifran; Hana Pharm, Korea) and oxygen. The US equipment (iU22; Phillips Medical System, USA) used a 5 to 8 MHz multi-frequency transducer.
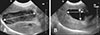
Images of GB were acquired in the longitudinal plane to measure maximum length (L) and the transverse plane to determine maxima of width (W) and depth (D). The measurements were performed from inner to inner margins of the GB wall (Fig. 1). To obtain the longitudinal plane, the transducer was angled along the long axis of the GB and moved to find the maximum GB size. Once the maximal longitudinal plane was scanned, the transducer was rotated 90° at the same point and then moved until the maximal transverse plane was obtained. The GB volume (V) was estimated with the following ellipsoid equation [5]:
The GB EF as a percentage was calculated as follows:
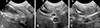
For measurement of duct diameter, US scanning was performed at three different sites: cystic duct at the GB level, CBD at the porta hepatis (PH) level, and CBD at the duodenal papilla (DP) level (Fig. 2). The widest diameter, measured from outer to outer margins of the duct wall was measured perpendicular to long axis of the duct by using electronic calipers.
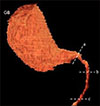
The dogs underwent CT scanning by using a 32-detector-row CT scanner (Alexion; Toshiba, Japan) with following scan parameters: 120 kVp, 150 mAs, 1 mm slice thickness, 1.0 sec rotation time, and a 0.938 collimation beam pitch. Intravenous iodinated contrast medium, iohexol (Omnipaque, 600 mgI/kg; GE Healthcare, Ireland) was administered via cephalic vein at an injection rate of 2 mL/sec by using a power injector (Salient; Imaxeon, Australia). The scan field was from the cranial margin of the diaphragm to the cranial endplate of the third lumbar vertebra in a cranial-to-caudal direction. Scan delays were 32 to 38 sec after contrast media administration to obtain portal phase images. Anesthetized dogs were placed in the ventral recumbency on the CT table and positive pressure ventilation (10 cm H2O) with a breath-holding technique was performed during CT scanning to avoid motion artifacts due to respiratory movement. The acquired CT images displaying an abdominal window (window level = 40 HU [HU, Hounsfield units], window width = 400 HU) were analyzed by using commercially available software (Xelis; INFINITT Healthcare, Korea). The GB volume was determined by using three-dimensional volume rendering (Fig. 3). The normal attenuation value of the GB lumen in pre-contrast CT images was determined based on the measurement value of maximum circular regions of interest that fitted the lumen, excluding visible hyperattenuating GB sludge or calculi. The bile duct diameter measurement sites were similar to those used in US scans. Bile duct diameters were evaluated on multiplanar reformation (MPR) images providing the best visualization of the bile duct. All results were reported as the average of 3 repetitive measurements.
Experiment 2
Medical records of dogs presenting to the Veterinary Teaching Hospital, Chungnam National University from March 2015 to September 2016 were reviewed. Dogs that underwent abdominal CT examinations were selected, and their results were retrospectively analyzed. All dogs had complete blood counts, serum biochemistry, abdominal radiography, US, and abdominal CT data available for review. Dogs with no hepatobiliary and/or pancreatic disease were assigned to the normal group, and the normal beagle dogs enrolled in experiment 1 were included in the analysis of the normal group. The normal group dogs showed normal serum chemistry including alkaline phosphatase (ALP), gamma-glutamyl transpeptidase (GGT), and total bilirubin. The dogs suspected to have cholestasis caused by hepatobiliary or pancreatic diseases were assigned to the cholestasis group. Post-contrast CT scanning protocols varied with body status and dog size.
The obtained CT images displaying an abdominal window (window level = 40 HU, window width = 400 HU) were analyzed by using the same software as used in experiment 1. All CT measurements performed in experiment 1 were performed identically in experiment 2.
Statistical analysis
Descriptive statistics including mean, range, and SD were calculated for bile duct diameters, GB lumen density, GB wall thickness, and bile duct wall thickness. For the comparison of pre- and post-prandial GB volumes, measured by US and CT, repeated ANOVA was used. Comparison of bile duct diameters among the three measurement sites was tested by one-way ANOVA. Pearson correlation coefficient was used to evaluate the relationship between bile duct diameters and body weight. Differences among values between US and CT, and between normal and cholestatic groups were assessed by applying independent t-tests or Mann-Whitney tests. A p value < 0.05 was considered statistically significant. The ninetieth percentile of the bile duct diameters was used as the normal status cut-off value. Statistical analyses were performed by using the IBM SPSS Statistics (ver. 22.0; IBM, USA).
Results
Experiment 1
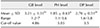
The GB volumes, EF and bile duct diameters as measured by US and CT are summarized in Table 1. The CT measurement values for both pre- and post-prandial GB volumes tended to be higher than those measured by US; however, the differences were not statistically significant (Table 1). In addition, there were no significant differences in EF values or bile duct diameters at the three measurement sites obtained from US and CT.
Experiment 2
In the normal group, forty-four dogs met the inclusion criteria. Seven Maltese (15.9%) and seven Yorkshire terriers (15.9%) were the most common breeds enrolled, followed by six Shih-Tzu (13.6%), six mongrel dogs (13.6%), five cocker spaniels (11.4%), four Pekingese (9.1%), four poodles (9.1%), and one each (2.3%) of Chihuahua, Schnauzer, spitz, miniature pinscher, and dachshund. Mean body weight for the normal group was 5.6 kg with a weight range from 2.4 to 14 kg. Age distribution was 2 to 15 years. To analyze the CT images, six beagles enrolled in experiment 1 were included in the normal group of experiment 2, resulting in a normal group size of 50 dogs.
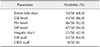
On CT images, the entire bile duct from the GB neck to the DP and the CBD could be visualized in 68% and 42%, respectively, of the dogs in the normal group (Table 2). In terms of measurement sites, the cystic duct at the GB level, the CBD at the PH level, and the CBD at the DP level could be visualized in 86%, 92%, and 94% of the normal dogs, respectively. The CBD wall could not be visualized in any of normal dogs whereas the GB wall was distinguishable in 64% of the dogs (Table 2).
The mean duct diameters at the three measurement sites were: GB level, 3.21 ± 1.31 mm; PH level, 1.85 ± 0.63 mm; DP level, 2.70 ± 0.51 mm. The measurements at the three sites were significantly different (p = 0.000), and the diameter was notably high at the GB level (Table 3). However, at the GB level, it was difficult to assign the measurement of the bile duct diameter to a normal upper limit because of the relatively large SD. Thus, the evaluation of bile duct diameter at the GB level was excluded from further study. At the PH level, there was no significant relationship between the bile duct diameter and body weight. As well, at the DP level, the bile duct diameter was only mildly related to the body weight (r2 = 0.15).
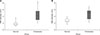
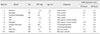
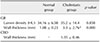
The dogs included in the cholestasis group had imaging results that were consistent with the underlying diseases, which included pancreatitis, choleliths, mucocele, cholecystitis, and cholangiohepatitis. Serum chemistry results (increased ALP, GGT, amylase, lipase) and cPLI kit results were also assessed. The clinical observations and the measurement values of bile duct diameter in the cholestasis group are shown in Table 4. Pancreatitis was the most common diagnosis followed by GB rupture, cholangiohepatitis, GB mucocele, and bile duct calculi. The mean bile duct diameters of the cholestasis group were 4.39 ± 1.79 mm and 4.42 ± 1.42 mm at the PH and DP levels, respectively. Both diameters were significantly higher than those of the normal group (p < 0.05) (Fig. 4). GB wall thickness of the cholestasis group was also significantly greater than that of the normal group (Table 5); however, GB density was not different between the two groups. Determination of the normal CBD wall thickness was not possible due to the poor visibility of the CBD wall in the normal group; however, the mean CBD wall thickness was measurable (1.35 ± 0.46 mm) in the cholestasis group (Table 5).
Discussion
The estimation of GB volume and EF by using US is considered to have limitations due to its dependency on the sonographer's skill level [1314]. In this study, values measured via US were compared with those obtained through CT to assess the accuracy of US assessment of the biliary system. GB volume, EF, and CBD diameters results show no significant differences between US and CT examinations. Since sedation is unnecessary during US examination, US is thought to be a useful diagnostic method for evaluation of the biliary system in veterinary medicine. In this study, CT measurement of fasting GB volume per body weight (1.14 mL/kg) was larger than the result in a previous study that used two-dimensional US (< 1 mL/kg) [13]. The results of this study were also larger than those obtained for fasting GB volume in a three-dimensional US study [12]. On those bases, US was thought to have the tendency to underestimate GB volume than CT.
In human medicine, the accuracy of CT for diagnosis of the biliary diseases has increased since the development of multidetector CT (MDCT), which has been used as an initial diagnostic method. The CBD and hepatic duct are visible in almost 100% of MDCT examinations in human patients [21]. However, in veterinary medicine, the normal CT characteristics of the biliary system in dogs have not been previously reported. In this study, CT visibility of the CBD and the hepatic duct was revealed to be 68% and 42%, respectively, values that are lower than those reported in human. This is presumably because the canine bile duct is smaller than that of human (7 mm) [10] and due to overlapping of the visceral surfaces of the gastrointestinal tract with the bile duct resulting from the use of ventral recumbency during CT, which causes cranial abdominal compression.
In veterinary medicine, a normal upper limit of 3 mm for the CBD diameter has been used based on a previous study in dogs. However, that study was performed in only three dogs weighing from 14 to 20 kg [23]. Therefore, a 3 mm cut-off value may not be a clear and reliable criterion across various dog breeds and body weights. In this study, the cut-off values of normal CBD diameters at the PH and DP levels were 3 mm and 3.5 mm, respectively. In addition, there was little correlation of body weights with bile duct diameter at both the PH and DP levels. Therefore, the normal upper limits of 3 mm and 3.5 mm at PH and DP levels, respectively, were established as appropriate for the normal CBD diameter in dogs less than 15 kg body weight.
CBD diameters in the cholestasis suspect group were significantly greater than those in the normal group; however, the accuracy of the cut-off value for cholestasis was not evaluated in this study. In human study, dilation of the bile duct by over 7 mm is considered an obstruction of biliary tract when correlated with clinical and biochemical features suggesting obstruction [10]. One study reported that cholestasis occurs with biliary sludge [18]; however, the amount of GB sludge was not considered in the normal dogs in this study.
Portal venous phase CT contrast images are used for evaluation of the biliary system. Pre-contrast CT images are also essential for evaluation of the contrast enhancement of lesions and for identification of biliary stones. In addition, MPR images should be obtained for evaluation of the complex curved biliary tract [21]. Several reports have described the thickening and/or enhancement of the GB and bile duct wall [4815]. Similar to results in human, the current study showed that wall thicknesses of the GB and bile duct in the cholestasis group were significantly increased compared to those in the normal group.
The GB lumen density was reported to be approximately 0 to 20 HU, as water constituent, in human medicine [9]. In this study, the mean density of GB lumen in the normal group (33 HU) was not significantly different from that of the cholestasis group (35 HU) and was notably higher than that in human. This may be due to variable amounts of GB sludge in asymptomatic or apparently healthy dogs. Calcium-containing stones in GB tend to result in more hyperattenuation. In contrast, cholesterol stones seem to be isoattenuating or hypoattenuating compared with bile [822]. Further investigation and analysis of the components and CT density of the GB lumen are required.
There are some limitations to the current study. First, dogs weighing over 15 kg were excluded from the study. Therefore, further study of larger dogs is needed. Moreover, the accuracy, sensitivity, and specificity of the normal status cut-off value were not evaluated due to the small sample size of the cholestatic group.
In conclusion, based on the comparison with CT-derived values, US is a useful modality for estimation of GB volume, EF, and CBD diameter. Regardless, CT evaluation of the normal biliary system in dogs is possible. In normal dogs weighing less than 15 kg, CBD diameter is not over 3 mm and 3.5 mm at PH and DP levels, respectively. If the CBD diameter is greater than these values on US and/or CT images, and after considering clinical signs and serum chemistry results, then cholestatic diseases should be suspected.

 XML Download