

 PDF
PDF ePub
ePub Citation
 Print
Print


Introduction
Pulmonary arterial hypertension (PAH) occurs as a results of high pulmonary artery pressure.1) Elevated pulmonary vascular resistance can progress to high right ventricular systolic pressures leading to right ventricular remodeling, and ultimately to right heart failure.2)
An imbalance between proliferation and apoptosis of smooth muscle influences vascular remodeling in PAH.3) The appearance of apoptosis-resistant, hyperproliferative endothelial cells (ECs) is reported in PAH models.1) Failure of ECs apoptosis could lead to intimal proliferation.2) Apoptotic cells are phagocytized by macrophages prior to membrane break down, membrane break down.4)
Proapoptotic and antiapoptotic proteins in PAH are a trigger mechanism in the pathogenesis of PAH.5) However, there are few reports on EC apoptosis in PAH.2)
An injection of monocrotaline (MCT) in rats produces endothelial injury, subsequent intense perivascular inflammation and a resultant, severe PAH.6)
Inflammatory cells consist of macrophages,7) immature dendritic cells (DCs),8) and lymphocytes. Pulmonary artery medial hypertrophy and vascular remodeling occur after the initial inflammatory phase in severe PAH.9) Irreversible PAH is known to have an increased inflammatory infiltrate that leads to exasperating vascular injury.10)
Although the stem cells have been used to treat a number of diseases, including cardiac disease, leukemia, Parkinson disease, diabetes and stroke, there are still limitations because of tumor formation risk, host immune rejection and ethical issues.11)
The anti-inflammatory effect of mesenchymal stem cells (MSCs) has also been noted in several animal models such as acute myocarditis12) and ischemia/reperfusion kidney injury.13)
Human umbilical cord blood derived mesenchymal stem cells (hUCB-MSCs) is often used as a substitute source of stem or progenitor cells.14) hUCB-MSCs are more beneficial than bone marrow-derived MSCs because they are acquired by non-invasive methods that are less damaging.15) In addition, hUCB-MSCs are more immature than adult MSCs and easily expand in vitro.16)
The goals of this research were to investigate expressions of apoptotic, inflammatory and angiogenic markers and evaluate their effects on hUCB-MSCs in MCT induced rat models.
In this study, we provided the first evidence of improved apoptosis, inflammation and remodeling after hUCB-MSCs treatment in MCT induced rat models.
Materials and Methods
Materials
Six-week-old male Sprague-Dawley rats were kept in temperature-controlled conditions under a 12 hour light - 12 hour dark cycle with full access to food and water.
MCT solution, which was firstly dissolved in HCl and adjusted pH 7.35 using NaOH, was subcutaneously injected the dose of 60 mg/kg for inducing pulmonary hypertension.17)18) The rats were randomly assigned to 3 groups i.e., the control group (n=12), sc injection of saline; the M group (n=12), sc injection of MCT; and hUCB-MSCs transfusion (the U group) (n=12). hUCB-MSCs (3×10⁶/mL/cm2) were administered via the external jugular vein 1 week after MCT injection. Six rats in each subgroup were sacrificed at weeks 2 and 4, respectively. All protocols were approved by the Institutional Animal Care and Use Committees of the School of Medicine of Ewha Womans University (ESM-2014-0266).
Cell preparation
hUCB-MSCs were acquired from Medipost Inc. (Biomedical research institute Co., Ltd, Seoul, Korea) and isolated human MSCs were grown in culture according to our previously reported method.14) Mononuclear cells (MNCs) isolated from human umbilical cord blood were cleaned and suspended in an alpha-minimum essential medium (α-MEM, Gibco-Invitrogen, Carlsbad, CA, USA) supplemented with 10% fetal bovine serum (FBS, Gibco-Invitrogen, Grand island, NY, USA). hUCB-MSCs were attached to plastic culture dishes during the culture processing and spindle-shaped fibroblast-like morphology was seen at passage 5.14)
Heart weights
The rats were weighed and observed for general appearance during the study period. The hearts and lungs were rapidly removed after sacrifice and the wet weights of the right ventricle (RV), left ventricle and septum (LV+S) were measured. The RV to LV+S ratio (RV/[LV+S]) was used as an index of right ventricular hypertrophy (RVH).
Estimation of mean right ventricular hypertrophy
The animals were placed in the supine position with an arterial pressure line (Physiological Pressure Transducer, MLT1199; AD Instruments, Oxfordshire, UK). A catheter was inserted in the external jugular vein to measure mean RVP. Hemodynamic parameters were measured at weeks 2 and 4.
Pathology of pulmonary arteries
Lung tissue was fixed with 10% buffered formalin through the trachea for 24 hours and then placed in paraffin. The lung tissues were cut into 3 um-thick sections and stained with Victoria blue to estimate histopathologic differences in pulmonary blood vessels. Using a microscopic digital camera, more than 20 images of pulmonary arterioles (50-160 µm diameters) per tissue section at a 400x magnification were photographed and subsequently analyzed using an image analysis program (analySIS, Olympus Soft Imaging Solutions, Singapore, Singapore). The external diameter (D) and the medial wall thickness between the internal and external elastic lamina of 2 sides of muscular arteries (M1 and M2) were calculated. The percentage of wall thickness was determined by the following formula: % wall thickness=(M1+M2)/D×100. The muscular arteries including respiratory bronchioli and those found in the alveolar wall were counted. Twenty randomly selected microscopic fields per tissue section were assessed at a magnification (200×).14)
Pathology of the heart tissues
The RV heart tissue was held in formaldehyde and embedded as a paraffin section. Masson's trichrome staining was performed to observe the degree of fibrosis (area of collagen penetration). Photographs were analyzed by an image analysis program (analySIS) under 200 HPF light microscopy.
Immunohistochemistry
Lung tissues were incubated overnight in 10% buffered formalin. Four-micron sections were incised from paraffin embedded tissue blocks and deparaffinized in zylene and rehydrated in graded alcohols (100-70%). Heat antigen retrieval was by boiling of tissue sections in antigen retrieval solution pH 6.0 or pH 9.0 (Dako, Carpinteria, CA, USA) for 10 min in a microwave. Sections were then incubated at 4℃ overnight with primary antibodies including caspase-3, B-cell leukemia/lymphoma-2 (Bcl-2) (SantaCruz biotechnology, SantaCruz, CA, USA), tumor necrosis factor (TNF)-α, interleukin (IL)-6, vascular endothelial growth factor (VEGF) and CD-68 (Abcam, Cambridge, UK). After incubation with primary antibodies, the sections were buffered and incubated for 30 min in secondary antibody (Dako EnVision System-HRP-labeled Polymer, anti-rabbit; Dako). Immunostaining was done with DAB chromogen (Dako) and counterstaining with Mayer's hematoxylin. Positive staining was seen under a light microscope as a diffuse brown color in the cytoplasm.
Terminal deoxyuridine triphosphate nick end labeling staining
DNA fragmentation was detected by terminal deoxyuridine triphosphate nick end labeling (TUNEL) staining using the ApopTag® Peroxidase in situ Apoptosis Detection Kit S7100 (Millipore, Billerica, MA, USA). Lung sections were deparaffinized with xylene and graded concentrations of alcohol followed by exposure to proteinase K for 15 min at room temperature. Endogenous peroxidase activity was quenched with 3% H2O2 in phosphate-buffered saline, for 5 min at room temperature. Next, the sections were incubated with terminal deoxynucleotidyl transferase in a humidified chamber at 37℃ for an hour. After incubation with anti-digoxigenin conjugate for 30 min at room temperature, peroxidase substrate (0.05% diaminobenzidine, DAB) was applied for color development. The specimens were cleaned with distilled water and counterstained with 0.5% methyl green for 10 min at room temperature. TUNEL-positive cells were considered as undergoing apoptosis.
Ribonucleic acid extraction and complementary deoxyribonucleic acid synthesis
Total RNA was extracted by using TRIzol Reagent™ (Invitrogen, Carlsbad, CA, USA), according to the Trizol method protocol and resuspended in diethyl pyrocarbonate water. The final RNA amount was determined by spectrophotometry at 260/280 nm. Quality was assessed as the absence of smear of 18S and 28S bands with the Bio analyzer 2100 (Agilent Technologies, Palo Alto, CA, USA). RNA samples were stored at -70℃ until used. cDNA (Maxime RT PreMix kit; iNtRON Biotechnology, Seongnam, Korea) was synthesized from 1 to 2 µg of total RNA as a template, using a Maxime RT PreMix kit (iNtRON Biotechnology, Seongnam, Korea) in a 20 µL reaction volume for 60 minutes at 45℃, and inactivation of the reverse transcriptase for 5 minutes at 95℃.17)
Gene expression analysis by reverse transcription-polymerase chain reaction
A polymerase chain reaction (PCR) primer and probe were designed using Primer Express software (PE Applied Biosystems, Foster City, CA, USA). The primer and probe sequences were shown below. An AccuPower DualStar PCR PreMix kit (Bioneer, Daejeon, Korea) was used for 20 µL reactions. The 20 µL of synthesized cDNA reactant was diluted in 80 µL of diethylpyrocarbonate-treated distilled water, and 3 µL of the solution was used as a PCR template. The reaction medium composition was as follows: PCR forward primer, 10 pmol, 1 µL; PCR reward primer, 10 pmol, 1 µL; Taqman probe, 10 pmol, 1 µL; Template, 3 µL; DEPC-treated distilled water, 14 µL. All primers were amplified using the same conditions. Thermal cycling conditions included 50℃ for 2 min and 95℃ for 10 min followed by 40 cycles of 95℃ for 30 sec and 60℃ for 30 sec, and 72℃ for 30 sec. PCR product was run in a 1% agarose gel and visualized under UV light.
The resulting first-strand of cDNA was normalized by the glyceraldehyde 3-phosphate dehydrogenase (GAPDH) gene. We used the normalized cDNA as a template for the PCR procedure. The specific primers for rat caspase-3 were 5'- GAA AGC ATC CAG CAA TAG GC -3' (forward) and 5'- TAA GGA AGC CTG GAG CAC AG -3' (reverse). The specific primers for rat Bcl-2 were 5'- CTC AGC CAG CCA GTG ACA TA -3' (forward) and 5'- CCG TGV TCC AGA TAC AT -3' (reverse). The specific primers for rat VEGF were 5'- GGA GGA TGT CCT CAC TTG GA -3' (forward) and 5'- CAA ACA GAC TTC GGC CTC TC -3'(reverse). The specific primers for rat IL-6 were 5'- CCG GAG AGG AGA CTT CAC AG -3' (forward) and 5'- ACA GTG CAT CAT CGC TGT TC -3' (reverse). The specific primers for rat TNF-α were 5'- AGT TGA TTT CTG GGC CCT TT -3' (forward) and 5'- CCA CTG TTC TGT GCT TGC C -3' (reverse). The specific primers for rat GAPDH were 5'- ATGGCACCGTCAAGGCTGAGA -3' (forward) and 5'- GGCATGGACTGTGGTCATG AG -3' (reverse).
Western blot analysis
The frozen tissues were ground to a powder with a mortar and pestle in liquid nitrogen. The supernatants were gathered and protein concentration was determined by detergent compatible (DC) protein assay (Bio-Rad Laboratories, Berkeley, CA, USA). The protein lysates were isolated by 10 or 12% SDS-polyacrylamide gel electrophoresis (PAGE) and transferred electrophoretically on to a polyvinylidene difluoride (PVDF) membrane. Blots were blocked with 5% skimmed milk in tris-buffered saline (TBS)-T (TBS with 0.1% Tween 20) for 1 hour at room temperature. After washing three times with TBS-T, the blots were incubated at 4℃ overnight with the appropriate primary antibodies, including caspase-3, Bcl-2, VEGF, IL-6, TNF-α, brain natriuretic peptide (BNP) (Cell Signaling Technology Inc., Danvers, MA, USA) and GAPDH (Santa Cruz Biotechnology, Inc., Santa Cruz, CA, USA). The membranes were cleaned thrice with TBS-T and incubated for an hour with anti-rabbit or mouse IG-conjugate with horseradish peroxidase. Enhanced chemiluminescence was detected with the western blotting luminol reagent (sc-2048 Santa Cruz Biotechnology, Santa Cruz, CA, USA) according to the manufacturers' protocol.
Statistical analysis
Results were expressed as the mean±standard deviation. Data were analyzed using SPSS (SPSS v22.0, Chicago, IL, USA) for windows. The Kruskal-Wallis test was used to compare p of RVP, RV/LV+S, and pathological changes. PCR and western blot analysis were used to compare the C, M and U groups. Due to multiple hypotheses in each analytic method (PCR and western blot analysis), Benjamini-Hochberg connections were performed to control the overall false discovery rates to 5%. If the result of the overall comparison across 3 groups was significant, even after multiple comparison correction, we conducted post-hoc pairwise comparisons (between C vs. M, M vs. U and U vs. C) with the Mann-Whitney U-test. We also performed multiple comparison connections by the Benjamini-Hochberg method.
Results
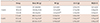
Changes in body weight and organ weight
The body weight was significantly reduced in the M group in comparison with the C group at week 2 (341.25±9.55 g vs. 329.42±10.24 g, p=0.020) and at week 4 (406.33±32.02 g vs. 317.30±10.60 g, p=0.025), respectively. The RV weight was significantly greater in the M group in comparison with the C group at week 2 (0.21±0.01 g vs. 0.27±0.04 g, p=0.020), and at week 4 (0.23±0.04 g vs. 0.54±0.06 g, p=0.025), respectively. The RV weight was significantly decreased in the U group, as compared with M group at week 2 (0.27±0.04 g vs. 0.23±0.03 g, p=0.044) (Table 1).
RV/LV+S was significantly increased in the M group, as compared with the C group at week 4 (0.28±0.04 vs. 0.79±0.04, p=0.025). RV/LV+S was significantly decreased in the U group, as compared with the M group at week 4 (0.79±0.04 vs. 0.48±0.10, p=0.008) (Table 1).
Changes in right ventricle pressure
The mean RVP was significantly larger in the M group in comparison with the C group at week 2 (11.6±0.5 mmHg vs. 34.8±7.3 mmHg, p=0.002) and at week 4 (11.5±0.7 mmHg vs. 42.2±13.0 mmHg, p=0.001), respectively. RVP was reduced in the U group in comparison with the M group at week 2 (34.8±7.3 mmHg vs. 16.4±2.1 mmHg, p=0.004) and at week 4 (42.2±13.0 mmHg vs. 13.4±2.5 mmHg, p=0.008), respectively. There were no significant differences in RVP between C and U groups at week 4 (p=0.417) (Table 2). In addition, aorta pressure was no changed (data not shown).
Pathologic finding of pulmonary arteries
Medial wall thickness of pulmonary arteriole
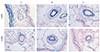
Thickened medial wall of pulmonary arteriole was noted in the M group at weeks 2 and 4 and decreased in the U group at weeks 2 and 4 (Fig. 1).
The medial wall thickness was significantly larger in the M group in comparison with the C group at week 2 (17.46±6.63 vs. 38.84±1.94, p=0.021) and at week 4 (19.97±8.59 vs. 40.19±5.38, p=0.025), respectively. There was a significant decrease in the U group, as compared with the M group at weeks 2 (38.84±1.94 vs. 31.07±4.71, p=0.026 ) and 4 (40.19±5.38 vs. 33.64±3.57, p=0.008), respectively. The medial wall thickness was not totally recovered to the C group (19.97±8.59 vs. 33.64±3.57, C vs. U, p=0.025) (Table 3).
The number of intra-acinar arteries
The number of intra-acinar arteries was significantly higher in the M group in comparison with the C group at week 2 (0.83±0.16 vs. 1.50±0.04, p=0.007), and at week 4 (0.95±0.20 vs.1.98±0.04, p=0.016), respectively. There were significant decreases in the U group in comparison with the M group at week 2 (1.50±0.04 vs. 1.31±0.27, p=0.007). There were significant differences between the U and the C groups at weeks 2 (0.83±0.16 vs. 1.50±0.04, p=0.004) and 4 (0.95±0.20 vs. 1.30±0.75, p=0.034), respectively (Table 4).
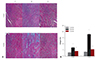
Immunohistochemical staining in the lung tissues
Immunohistochemical expression analyses indicated that the CD-68 positive cells were higher in the M group than in the C group, and lower in the U group than in the M group (p<0.05). This result indicated that hUCB-MSCs could attenuate the inflammation related to macrophage, since CD-68 is one of the macrophage markers (Fig. 2).
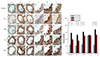
Caspase-3, Bcl-2, VEGF and TNF-α immunoreactivity were significantly higher in the M group in comparison with in the C group at week 4. They were significantly decreased in the U group, as compared with the M group (Fig. 3).
Terminal dUTP nick end labeling assay in the lung tissues
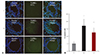
The C group possessed nuclei that appeared blue with no evidence of diaminobenzidine staining. The M group, in which lung tissues were treated with DNase, yielded dark brown nuclei. The U group also showed cells with brown nuclei, indicative of in situ DNA fragmentation, a characteristic of apoptosis (Fig. 4A).
The positive cells of apoptosis were significantly higher in the M group (17.0±4.6%) than in the C group (5.2±1.9%), however they were lower in the U group (12.6±3.7%) than in the M group (p=0.018). The result indicated that hUCB-MSCs could attenuate apoptosis in the lung tissues of MCT-induced rats (Fig. 4B).
mRNA expressions in the rat lung tissues
Caspase-3mRNA expression
Caspase-3 mRNA expression in the M group was significantly higher than in the C group at week 2 (0.24±0.02 vs. 0.79±0.03, p=0.018) and at week 4 (0.23±0.03 vs. 0.92±0.07, p=0.008), respectively. Caspase-3 mRNA expression of in the U group were significantly lower than in the M group at week 2 (0.79±0.03 vs. 0.64±0.05, p=0.045) and at week 4 (0.92±0.07 vs. 0.56±0.04, p=0.008), respectively (Fig. 5A).
B cell leukemia/lymphoma-2mRNA expression
The Bcl-2 mRNA expression was significantly increased in the M group in comparison with the C group at week 2 (0.20±0.02 vs. 0.78±0.01, p=0.012) and at week 4 (0.18±0.01 vs. 0.72±0.05, p=0.008), respectively. mRNA expression of Bcl-2 greatly decreased in the U group in comparison with the M group at week 4 (0.72±0.05 vs. 0.50±0.08, p=0.008) (Fig. 5B).
Vascular endothelial growth factor mRNA expression
VEGF mRNA expression was significantly increased in the M group in comparison with the C group at week 2 (0.21±0.03 vs. 0.77±0.01, p=0.008) and at week 4 (0.23±0.02 vs. 0.77±0.02, p=0.008), respectively. VEGF mRNA expression significantly decreased in the U group in comparison with the M group at week 2 (0.77±0.01 vs. 0.66±0.04, p=0.008) and at week 4 (0.77±0.02 vs. 0.66±0.03, p=0.008), respectively (Fig. 5C).
Interleukin-6 mRNA expression
IL-6 mRNA expression was significantly higher in the M group in comparison with the C group at week 2 (0.21±0.01 vs. 0.78±0.04, p=0.012) and at week 4 (0.24±0.02 vs. 0.75±0.03, p=0.008), respectively. IL-6 mRNA expression was significantly lower in the U group in comparison with the M group at week 2 (0.78±0.04 vs. 0.72±0.02, p=0.028) and at week 4 (0.75±0.03 vs. 0.68±0.02, p=0.008), respectively (Fig. 5D).
Tumor Necrosis Factor-α mRNA expression
TNF-α mRNA expression was significantly increased in the M group in comparison with the C group at week 2 (0.22±0.02 vs. 0.74±0.03, p=0.011) and at week 4 (0.25±0.04 vs. 0.78±0.05, p=0.011), respectively. TNF-α mRNA expression was significantly decreased in the U group in comparison with the M group at week 2 (0.74±0.03 vs. 0.64±0.03, p=0.011) and at week 4 (0.78±0.05 vs. 0.67±0.01, p=0.011), respectively (Fig. 5E).
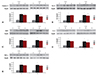
Western blot analysis of the lung tissues
Caspase-3
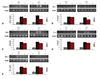
Caspase-3 protein expression was significantly higher in the M group in comparison with the C group at week 2 (0.24±0.03 vs. 0.85±0.03, p=0.012) and at week 4 (0.25±0.02 vs. 0.80±0.04, p=0.002), respectively. Caspase-3 protein expression was significantly lower in the U group in comparison with the M group at week 2 (0.85±0.04 vs. 0.76±0.05, p=0.016) and at week 4 (0.80±0.04 vs. 0.62±0.05, p=0.002), respectively (Fig. 6A).
B cell leukemia/lymphoma
Bcl-2 protein expression of was significantly higher in the M group in comparison with the C group at week 2 (0.23±0.02 vs. 0.73±0.04, p=0.006) and at week 4 (0.25±0.02 vs. 0.77±0.03, p=0.003), respectively. Bcl-2 protein expression was significantly lower in the U group in comparison with the M group at week 4 (0.77±0.03 vs. 0.69±0.03, p=0.009) (Fig. 6B).
Vascular endothelial growth factor
VEGF protein expression was significantly higher in the M group in comparison with the C group at week 2 (0.23±0.03 vs. 0.75±0.04, p=0.006) and at week 4 (0.24±0.03 vs. 0.75±0.04, p=0.003), respectively. On the other hand, VEGF protein expression was significantly lower in the U group in comparison with the M group at week 2 (0.75±0.04 vs. 0.68±0.04, p=0.025) and at week 4 (0.75±0.04 vs. 0.68±0.04, p=0.028), respectively (Fig. 6C).
Interleukin-6
IL-6 protein expression was significantly increased in the M group in comparison with the C group at week 2 (0.23±0.01 vs. 0.69±0.06, p=0.003) and at week 4 (0.15±0.02 vs. 0.62±0.06, p=0.021), respectively. The protein expressions of IL-6 were significantly decreased in the U group in comparison with the M group at week 4 (0.62±0.06 vs. 0.53±0.05, p=0.021). IL-6 levels were not totally recovered in the U group at weeks 2 and 4 (Fig. 6D).
Tumor Necrosis Factor-α
TNF-α protein expression of was significantly increased in the M group in comparison with the C group at week 2 (0.24±0.02 vs. 0.79±0.05, p=0.003) and at week 4 (0.23±0.03 vs. 0.78±0.03, p=0.003), respectively. TNF-α protein expression was not significantly different in the U group, as compared with the M group at week 4 (Fig. 6E).
Pathologic finding of the heart tissues
The collagen-rich area stained blue on Masson's Trichrome staining was clearly visualized at weeks 2 and 4 (Fig. 7A) in each group. Collagen content in the heart tissues significantly increased in the M group, as compared with the C group at weeks 2 and 4 and significantly decreased in the U group at weeks 2 and 4 (Fig.7B).
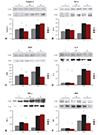
Western blot analysis in the heart tissues
Caspase-3
Caspase-3 protein expression was significantly increased in the M group in comparison with the C group at weeks 2 and 4, and significantly decreased in the U group, as compared with the M group at week 2 (Fig. 8A).
B cell leukemia/lymphoma
Bcl-2 protein expression was significantly increased in the M group, as compared with the C at weeks 2 and 4, and significantly decreased in the U group, as compared with the M group at week 2 (Fig. 8B).
Vascular endothelial growth factor
VEGF protein expression was significantly increased in the M group, as compared with the C group at weeks 2 and 4, and significantly decreased in the U group, as compared with the M group at week 2 and 4 (Fig. 8C).
Interleukin-6
IL-6 protein expression was significantly increased in the M group, as compared with the C group at weeks 2 and 4. However, IL-6 protein expression was not significantly different in the U group, as compared with the M group at weeks 2 and 4 (Fig. 8D).
Tumor Necrosis Factor-α
TNF-α protein expression was significantly increased in the M group, as compared with the C group at weeks 2 and 4. TNF-α protein expression was significantly different in the U group, as compared with the M group at week 2 (Fig. 8E).
Brain natriuretic peptide
BNP protein expression was significantly increased in the M group, as compared with the C group at weeks 2 and 4, and significantly decreased in the U group, as compared with the M group at weeks 2 and 4 (Fig. 8F).
Discussion
The results of the study indicated that the injection of hUCB-MSCs (3×10⁶/mL/cm2) improved inflammation, apoptosis and remodeling in the lung and heart tissues of MCT model. The effect of hUCB-MSCs was possibly mediated by the down-modulation of remodeling, apoptosis and inflammation in the lung and heart tissues.
The protective mechanism of hUCB-MSC treatment in an MCT-induced lung injury model remains unknown. In this study, we demonstrated that the MCT-induced lung injury was mediated by inflammatory cells, such as macrophages in the bronchovascular area, as well as by proinflammatory cytokines, such as IL-6, and TNF-α. Inflammation can worsen and perpetuate PAH.9) The results of our research showed altered infiltration of perivascular inflammatory cells such as macrophage in MCT-induced lung injury models. Macrophage expression was greatly decreased, including TNF-α and IL-6 in the U group.
Inflammation and apoptosis have important roles in the onset and progression of PAH.9)
In this research, increased mRNA and protein expressions of TNF-α and IL-6 were related with infiltration of inflammatory cells in the heart tissues and bronchovascular areas.
We detected abnormal apoptosis in the heart and lung tissues. Bcl-2 and caspase-3 expression were greater in the M group from week 2. Caspase-3 and Bcl-2 immunoreactivity on immunohistochemical staining, and positive cells of apoptosis on TUNEL assay, were greater in the M group than in the C group. mRNA and protein expressions of caspase-6 and Bcl-2 significantly decreased at week 4 in the U group, as compared with the M group in the lung tissues. Caspase-3 and Bcl-2 immunoreactivity and positive cells of apoptosis on TUNEL assay in the U group were significantly decreased, as compared with the M group. This result indicated that hUCB-MSCs could decrease apoptosis in the lung tissues of MCT-induced PAH rats.
Apoptosis-resistant endothelial cells are likely to produce more intimal proliferation and occlusion of distal intrapulmonary arteries, that could induce compensatory development of neovessels.5) Caspase activation is the central molecular event leading to apoptosis, which precedes DNA degradation and the development of apoptotic morphology.19) Therefore, active caspase-3 staining indicates the exact activation of the apoptotic program.
Our studies provided evidence of abnormal angiogenesis in the heart and lung tissues. The M group had increased VEGF mRNA and protein expression. This finding suggested an association between angiogenesis and increased medial wall thickness and the proliferation of pulmonary smooth muscle cell. Irreversible PAH cases also show more compensatory upregulation of VEGF. New small vessel formation is found at the sites of native vessel stenosis or occlusion,2) and VEGF is involved in neoangiogenesis.20) VEGF is involved in endothelial cell survival by initiating upregulation of the antiapoptotic protein Bcl-2.21) This observation is consistent with a recent in vitro study suggesting that pulmonary endothelial cell apoptosis is an early mechanism in the pathogenesis of idiopathic PAH, followed by apoptotic-resistant cell proliferation.5)
Angiogenesis is a critical element of RVH in our study. VEGF protein is highly expressed in the heart tissues.22) Higher myocyte expression of the proinflammatory cytokines such as IL-6 and TNF-α correlates with disease severity.22) TNF-α can depress myocardial contractility and induce apoptosis of cardiac myocytes.23) In our study, protein expressions of caspase-3, Bcl-2, VEGF, IL-6 and TNF-α were significantly increased in the M group. In our model, primarily increased pulmonary artery pressure leads to RV afterload, thus increasing collagen content. Furthermore, paracrine factors may stimulate RVH.24) Küçüker, et al.25) reported an increase in collagen and TNF-α levels in a failing heart. RV dilatation is related with higher rates of apoptosis indicated by Bcl-2 and caspase expression.22) The data from our study was in agreement with these reports.
Cardiac fibrosis is a harmful process that causes a disparity between the extracellular matrix (ECM) deposition and the degradation within the heart, which results in superfluous fibroblast proliferation, as well as a buildup of ECM proteins within the cardiac interstitial space. The result is progressive stiffening of the ventricular wall. In the PAH RV, many pathophysiologic abnormalities have been found including fibrosis, ischemia, autonomic activation and mitochondrial-metabolic abnormalities.26) Cardiac fibrosis decreases cardiac contractility and leads to increased BNP. In our study, BNP protein expression in the heart tissues significantly increased at weeks 2 and 4 in the M group and significantly decreased at weeks 2 and 4 in the U group. Collagen content in the heart tissues was reduced after hUCB-MSCs treatment by Masson's Trichrome staining.
Our previous data suggested that hUCB-MSCs express many genes that are involved in the inflammatory response, immune response, apoptosis, lipid metabolism, cell adhesion, cell differentiation, cell migration, cell proliferation, cell growth, transport, signal transduction and transcription.27)
Umbilical cord blood is considered an excellent and promising source for hUCB-MSCs because of its availability. Furthermore, hUCB-MSCs have been successfully isolated, developed, and differentiated into various cell types such as endothelial cells, lung-specific cells in vitro, chondrocytes, adipocytes, stromal cells, skeletal cells, and neural cells.28)
However, it is not known whether hUCB-MSCs can differentiate into lung specific cell types in vivo, and if these cells are good exogenous stem cell sources for lung injuries.24) A damaged lung produces soluble factors that lead to the proliferation and migration of MSCs to the injured lung.29) Some soluble factors that are made in the injured lung may help the administered MSCs to reach the damaged lung area.30)
Furthermore, hUCB-MSCs are easy to obtain and readily grow ex vivo to a concentration sufficient for cell replacement therapy, as compared to adult BM-derived MSCs.28) hUCB-MSCs are an exciting source for gene or cellular transfer therapy and further, suppress cytokines production. In our study, this protective effect was probably mediated by the downmodulation of pulmonary inflammation and apoptosis.
hUCB-MSCs produce an immunesuppressive effect, or diminished immunogenicity.11) The main limitation to transplanting hUCB cells is graft rejection caused by the immunological barrier of human leukocyte antigen mismatching. However, in our study, we demonstrated that hUCB-MSCs could actually suppress allogeneic response of human lymphocytes because hUCB-MSCs suppress proliferation and reduce cytokine production. This suggests that hUCB-MSCs could be implanted into inflammation sites without the use of immunosuppressive drugs.14) Anti-inflammatory cytokines such as IL-6 and TNF-α have been considered for the mediation of the immunosuppressive effects of hUCB-MSCs.14) In our study, there was no graft versus host rejection.
The limitation of the current study was the relatively small sample size.
In conclusion, our data indicated that an infusion of hUCB-MSCs significantly attenuates MCT-induced pulmonary hypertension. This protective effect probably mediates the down-modulation of inflammation, apoptosis and remodeling in the lung and heart tissues.


 XML Download