

 PDF
PDF ePub
ePub Citation
 Print
Print


Introduction
Catheter ablation of scar-related reentrant ventricular tachycardia (VT) is challenging, although it is necessary for managing patients with frequent implantable cardioverter-defibrillator (ICD) shock therapy.1)2) Identifying the critical isthmus of slow conduction is crucial for successfully treating scar-related VT.3)4)5) The current mapping strategy for characterizing the isthmus uses activation and entrainment mapping in reproducible and well-tolerated VT.4)6)7) Recently, in cases of hemodynamically unstable VT, various approaches such as substrate mapping, ablating the isolated late potentials, and eliminating local abnormal ventricular activities (LAVA) have been proposed.8)9)10)11) These substrate modifications have been attempted as endpoints for VT ablation, although these strategies were not specific and carry the risk of extensive ablation.12)13)14) In addition, substrate-based approaches require complicated steps including voltage mapping, characterizing a slow conduction zone by delayed potential mapping, and entrainment or pace mapping to define the VT circuit.10)11)15)
The aim of the present study was to identify the reentry circuit isthmus using a simple method based on substrate mapping and a new color-coded propagation mapping strategy using a specific method by resetting the window of interest.
Subjects and Methods
Study subjects
Between March 2009 and February 2014, 13 consecutive patients who were undergoing catheter ablation for sustained, recurrent and drug-refractory VT with ischemic or non-ischemic cardiomyopathy (CMP) were reviewed. For the purpose of detailed activation mapping, the five patients (age 60.6±10.5 years, male 100%) with reproducible and hemodynamically tolerated monomorphic VT were included.
Electrophysiology study
Detailed electroanatomic data were obtained from all of the patients using either the CARTO system (Biosense-Webster Inc., Diamond Bar, CA, USA) or the CARTO-RMT™ integration system (Stereotaxis Inc., St. Louis, MO, USA). Mapping and ablation were performed using 8 Fr catheters with a conventional 3.5 mm tip (NaviStar™ RMT; Biosense-Webster Inc., Diamond Bar, CA, USA) or a 3.5 mm irrigated tip electrode (NaviStar ThermoCool™, Biosense-Webster Ltd, Diamond Bar, CA, USA). All studies were done under local anesthesia and deep sedation after a preprocedural transthoracic or transesophageal echocardiogram to exclude the presence of intracardiac thrombus.
Electroanatomical mapping
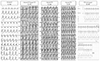
VT was induced by programmed stimulation, and substrate maps of the left ventricle were created initially. Before the procedure, we carefully analyzed the documented twelve lead electrocardiogram (ECG) and ICD electrograms and determined the characteristics of spontaneously induced clinical VT. We then selected the target VTs for ablation that would repeatedly lead to ICD shock. Clinical VT was defined as VT that was induced spontaneously or that showed the same axis and similar cycle lengths compared with the clinically documented ECG or ICD electrograms (Fig. 1). The voltage map was used in bipolar mode for identifying scar areas. The default color scale of the border zone was set from 0.5 mV (red) to 1.5 mV (purple), and the maps that had a voltage of <0.5 mV were considered scars and displayed in grey. All areas of the border zone and scar region were analyzed. Then, activation mapping was performed during the tachycardia. All sites with isolated delayed potentials, indicative of conduction block, were tagged with blue dots. Isolated delayed potentials were defined as low-amplitude, high-frequency potentials that spanned the diastolic period and separated from the ventricular electrograms.16) High-density fine mapping was performed, and only consistent potentials were tagged that facilitated differentiation from the far field potentials.
Editing the electroanatomical maps
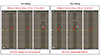
After the initial mapping, a complete activation and propagation map during VT was performed, and the critical isthmus was identified. To better identify the direction of reentry, the propagation map was carefully re-analyzed. The annotation was moved from the true ventricular activation potential to the beginning of the local isolated diastolic potential. Then, the onset of the window of interest was reset to the diastolic phase by changing the ratio from the conventional zone (early, 50-60%; late, 40-50%) to the adjusted zone (early, 80-90%; late, 10-20%) (Fig. 2). The duration of the window of interest corresponds to the interval of the arrhythmia cycle length (CL) that spans 95% of the CL. Finally, we conducted entrainment mapping to confirm the entrance, exit or bystander sites.
Ablation and follow-up
After the analysis of the maps, either focal or linear ablation was performed targeting the exit site of the critical isthmus and the isolated delayed potentials. The endpoint was the non-inducibility of the clinical VT. All patients were followed every 3-6 months by ICD programming to assess the recurrence of VT.
Results
Patient demographics
Four patients (80%) had ischemic CMP, and one (20%) had non-ischemic CMP. All patients had implanted ICDs, and two were documented as VT only by ICD. The mean LV ejection fraction was 27.1±9.6%. Four patients had frequent episodes of ICD therapy, one had electrical storm and all had single clinical VT morphology with variable cycle lengths. Other clinical characteristics are shown in Table 1.
Tachycardia mapping data
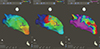
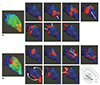
All of the mapping was obtained during VT. A total of 15 VTs were induced, and three of them were hemodynamically unstable. The mean number of points was 266±50 in the complete maps, and mean substrate volume was 164±59 cm3. By resetting the ratio of the window of interest from 6:4 to 9:1, we could trace the delayed potentials that spanned the entire diastolic phase. Fig. 3 shows the presence of delayed potentials close to the border and scar areas, and the activation sequence of the delayed potentials represents the direction of ongoing VT. Before we edited the propagation maps, they showed focal tachycardia patterns and could not identify the reentrant circuit. The edited activation and propagation maps were able to identify the channel and the direction of the reentrant circuits that showed figure 8 reentry (Figs. 4 and 5). In Fig. 4, the activation map showed the area where the early zone met the late zone. In addition, delayed potentials were observed close to the scar border zones on the voltage maps. The clinical VT terminated during isthmus ablation, and after final ablation, clinical tachycardia was not induced in any patients.
Outcome
The mean follow-up duration was 17.6±12.5 months. Of the five patients, two died. One died during the hospitalization course, and the other had VT recurrence after one month and died ten months after VT ablation. Another patient had VT recurrence three months after ablation. The remaining two patients had successful ablation and no ventricular arrhythmia events for 31 months and 25 months.
Discussion
This study has important clinical impacts regarding how this mapping technique was demonstrated to be effective in reconstructing the whole VT reentrant circuit using a simple method. Different mapping and ablation strategies have been reported for ablating scar-related VT. Conventional electrophysiologic methods using entrainment or pace mapping with electroanatomic activation mapping can be used to identify the isthmus. Recently, the presence of isolated late potentials or LAVA and eliminating these potentials were suggested for detailed mapping, although these approaches are complex and involve a number of steps. Based on this, we proposed a simple method for characterizing the critical isthmus using electroantomic activation mapping guided by delayed potential.
Classic entrainment mapping was a useful technique, but it is difficult to maintain VT during pacing, and different VTs can be induced during entrainment.6) Recently, three-dimensional electroanatomical mapping techniques have been suggested to reconstruct scar-related VT circuits.7)10)14) Scar zones can be characterized by electroanatomical mapping.17) However, current 3D mapping is not designed for tracking the critical isthmus; more than one channel can be observed, and the majority of them are bystanders. In addition, it is difficult to locate the ablation target, and empiric ablation can cause extensive ablation.18) For more detailed and specific mapping, Mountantonakis et al.11) suggest that voltage channels that contain isolated late potentials can increase the specificity of predicting the clinical channel. However, these channels did not include the critical isthmus in some cases. In the present investigation, we also could not identify the critical isthmus by voltage map, and it was then useful to merge the voltage map with the edited delayed potential map to visualize the direction of the reentrant circuit. We reset the window of interest to the diastolic phase by changing the ratio to 9:1, which enabled coverage of the whole diastolic phase. The reset ratio was chosen to include the delayed potentials in the window of interest. Delayed potential represents the local slow conduction of the surviving myocardium,19) which showed along the scar border zone. These heterogeneous scar border areas are critical lesions for reentry.20) Therefore, the activation sequence of the delayed potentials represents the propagation of the critical isthmus. Using this method, we were able to locate the clinical channel and make it the ablation target.
Various VTs could be induced during or even after the ablation procedure.21) However, our purpose in ablating was to reduce ICD shock or electrical storm. Therefore, the ablation target was only clinical VT that induced spontaneously and caused repeated ICD shock. Even when we ablated only the target VTs, we never saw the various kinds of VTs that were induced in the EP lab in the EGM analysis after ablation, and we could prevent frequent episodes of ICD shock.
Furthermore, most of our cases used the CARTO-RMT™ integration system, which facilitates more mapping points and can overcome the difficult access by achieving optimal catheter position and contact, making for more detailed and effective electroanatomical mapping.
Study limitations
In patients with non-inducible or non-tolerated VT, we could not apply the new mapping strategy. Therefore, this study had a limited number of patients in whom to propose the new method. Moreover, it is not possible to prove the long-term efficacy of ablation in these patients.
In addition, we conducted the entrainment after final mapping, although in some cases, we could not carry out the entrainment at all delayed potential sites because of the irreproducibility of clinical VT. These cases were identified as non-inducible after ablation wether the critical isthmus was ablated. In this sense, the new method for identifying the channel can easily overcome the limitation of entrainment.


 XML Download