

 PDF
PDF ePub
ePub Citation
 Print
Print


Introduction
Chronic total occlusion (CTO) of the coronary arteries is defined as lesions with thrombolysis in myocardial infarction (TIMI) flow grade 0 with an estimated or known occlusion duration of three months or more.1) Coronary CTO is present in 18.4 to 52% of patients with coronary artery disease undergoing coronary angiography.2)3)4)5) CTO percutaneous coronary intervention (PCI) can decrease or eliminate symptoms.6)7) Successful PCI performed on a CTO lesion can decrease the need for anti-anginal medications, improve exercise capacity,8) decrease the need for coronary artery bypass graft surgery (CABG), improve left ventricular systolic function,9) decrease the risk for arrhythmias,10) and improve overall survival of patients.7)
There have been significant improvements in procedure techniques for CTO PCI in recent years, and success rates for CTO PCI have risen to greater than 80 to 90%. Major complication rates of CTO PCI are acceptable and similar to non-CTO PCI.1) Interventional cardiologists typically hypothesize that calcium deposition within and around the CTO segment is a primary cause of CTO PCI failure, particularly during wiring.
A better understanding of specific lesional characteristics of coronary arteries with CTO may improve the results of CTO-PCI. However, there is little in vivo data comparing CTO lesions and non-CTO lesions, and, thus, the differences in lesion characteristics between CTO and non-CTO are poorly understood. The virtual histology-intravascular ultrasound (VH-IVUS) is a technique that can provide detailed qualitative and quantitative information of the lesion and can identify four specific plaque components to better characterize the lesion.10) A recent VH-IVUS study revealed that plaque composition of acute coronary syndrome was associated with a greater component of a necrotic core than those in stable angina.10) Given that most patients with CTO lesions present with clinical manifestations of stable angina, we excluded patients with acute coronary syndrome (ACS) in this study to avoid any difference in plaque composition based on these findings.
Therefore, the purpose of the present study was to compare the micro-anatomic lesional characteristics between the CTO group and non-CTO group in patients with stable angina (SA) by VH-IVUS modalities.
Subjects and Methods
Study population
From January 2006 to March 2008, VH-IVUS was performed on consecutive patients with coronary arterial disease at Konyang University Hospital. VH-IVUS was not performed routinely after March 2008, so the patients in during this period were enrolled in the study. The study population consisted of 22 native coronary artery CTO lesions and 127 non-CTO lesions documented in patients with SA after either guidewire crossing or after pre-dilatation using a small size balloon (1.5 mm-2.0 mm) by expert interventional cardiologists at Konyang University Hospital. The CTO group was defined as an obstruction of a native coronary artery with no luminal continuity and TIMI flow grade 0 and with an estimated occlusion duration of three months or more. The occlusion duration was determined by the interval from the first diagnostic coronary angiogram documenting a CTO or from the duration of ischemic symptoms in patients that had not previously undergone angiography.11) The control group was composed of patients with SA according to the Canadian Cardiovascular Society classification. Most patients with CTO lesions present with clinical manifestation of stable angina; thus, we excluded patients with ACS according to the Braunwald classification in this study to avoid any underlying differences in plaque composition based on the clinical manifestations.
We also excluded patients with severe calcified and tortuous vessels that were impossible to pass with an IVUS catheter; those with a history of PCI or coronary artery bypass surgery; as well as hemodynamically unstable patients, and those patients who declined to participate in the study. All 22 CTO lesions in this study underwent VH-IVUS examination without any complication. Altogether, the study population consisted of 149 patients; 22 patients were included in the CTO group, and 127 patients were included in the non-CTO group. Demographic data of the study population was obtained through review of hospital charts. Coronary risk factors included hypertension (blood pressure≥140/90 mmHg based on the average of repeated readings or patients on antihypertensive drugs), dyslipidemia (total cholesterol>200 mg/dL and/or triglyceride>150 mg/dL and or low density lipoprotein cholesterol>130 mg/dL or patients on lipid lowering therapy), diabetes mellitus (DM, controlled with diet, oral hypoglycemic agents, or insulin; or fasting glucose level≥126 mg/dL or 2 hour oral glucose tolerance test≥200 mg/dL), and cigarette smoking. This study was approved by the ethics committee of Konyang University Hospital.
Percutaneous coronary intervention
All patients received aspirin 300 mg and clopidogrel 300-600 mg, and 120 IU/kg of unfractionated heparin intravenously before PCI. PCI was performed using the femoral or radial approach with a 5, 6, or 7 Fr guiding catheter and a 0.014-inch standard or extra-support coronary guidewires. The culprit lesion was identified by inspecting for ventricular wall motion abnormalities and the appearance of the angiographic lesion.
All study subjects underwent successful PCI of the culprit lesion and VH-IVUS examination.
Intravascular ultrasound-examination and analysis
The VH-IVUS examination was performed on the culprit lesion with dedicated 20-MHz, 2.9 F monorail, electronic Eagle Eye Gold IVUS catheter (Volcano Therapeutics, Rancho Cordova, CA, USA) and VH-IVUS console (Volcano Therapeutics, Rancho Cordova, CA, USA) during the CAG after intracoronary administration of 100 to 200 µg nitroglycerin. The IVUS catheter was advanced into the target lesion after wiring or ballooning and automatic pullback at 0.5 mm/sec was performed. The VH-IVUS image was recorded on a DVD-ROM for subsequent off-line analysis.
Both qualitative and quantitative analyses of gray scale IVUS images were performed according to the criteria of the American College of Cardiology's Clinical Expert Consensus Document on IVUS.11)12)13) The proximal and distal reference segments were the most normal-appearing cross sectional segments within 10 mm or less from the distal and proximal end of the lesion. Measurement of lesion length was determined by defining the edge of the lesion as the nearest point out of the most normal-looking cross sectional foci within 10 mm or less from the distal and proximal end of the lesion.
The external elastic membrane (EEM) and cross-sectional area (CSA) was measured with customized software (IVUS Lab., Volcano Therapeutics, Rancho Cordova, CA, USA). The remodeling index was calculated as the lesion EEM CSA divided by the average reference EEM CSA.
Spectral analysis of intravascular ultrasound radiofrequency data
Analysis of spectral data and IVUS radiofrequncy data was performed on the target lesion with customized software (IVUS Lab.; Volcano Therapeutics, Rancho Cordova, CA, USA) by an examiner who was blinded to the gray scale IVUS results. For both the lumen and the media-adventitia interface, automatic border detection was performed at the predefined lesion segment and manual correction was subsequently performed and required the agreement of two independent, experienced cardiologists. Disagreements were reviewed by a third cardiologist. After confirming the border detection, the software automatically calculated and displayed the results. For each frame, histologic findings were expressed in colors (green for fibrous, green-yellow for fibro-fatty, white for dense calcified, and red for necrotic core area). The predictive accuracy of this method with tissue mapping has been validated.13) The area (mm2) and percent area of each tissue component of plaque were analyzed at the minimal luminal area site, and the volume (mm3) and percent volume of each tissue component of plaque were evaluated within the full segment of the culprit lesion. The plaque volume was divided by the lesion length to adjust for varying lesion lengths and recorded as a corrected volume (mm3/mm).
Specific histologic features of the lesion, such as pathologic intimal thickening, fibrocalcific atheroma, and thin cap fibroartheroma, were not analyzed in this study because the specific lesion type could have been altered within the CTO lesion due to intervention.
Statistical analysis
All analyses were performed with SPSS (version 18.0; SPSS Inc., Chicago, IL, USA). All data are expressed as mean±standard deviation for continuous variables and as percentage ratio for categorical variables. Categorical variables were compared by chi-square test. If more than 20% of cells had a count less than five in the chi-square test, a Fisher's exact test was performed. Continuous variables were compared by Student t tests. If the data did not show a normal distribution, a Mann-Whitney U test was performed. A p less than 0.05 was considered statistically significant.
Results
Baseline characteristics
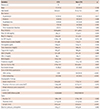
Of 149 patients, 22 patients were found to have a CTO lesion and 127 patients a non-CTO lesion. The CTO group had a significantly lower ejection fraction (57.6±13.0% vs. 65.4±8.8%, p=0.007) than did the non-CTO group. All other demographics showed no statistical differences between the two groups.
Angiographic assessment was performed following VH-IVUS examination in all subjects. All CTO lesions underwent VH-IVUS investigation after ballooning. In contrast, 23 patients (18.1%) of the non-CTO group underwent VH-IVUS study after ballooning and the remaining (81.9%) underwent VH-IVUS following wiring. The CTO group had a smaller proximal reference lumen area (7.24±3.06 mm2 vs. 8.77±3.11 mm2, p=0.035) than did the non-CTO group, and the CTO group also had a smaller distal reference lumen area (5.49±2.64 mm2 vs. 8.55±8.84 mm2, p<0.001) compared with the non-CTO group. Stent diameter and length of the CTO group was smaller (2.77±0.35 mm vs. 3.21±0.42 mm, p<0.001) and longer (29.2±4.8 mm vs. 22.0±5.0 mm, p<0.001) than in the non-CTO group (Table 1).
Virtual histology-intravascular ultrasound findings
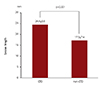
Lesion analysis of the minimal lumen area revealed that the CTO group had a longer overall lesion length (24.4±9.6 mm vs. 17.2±7.4 mm, p<0.001) than did the non-CTO group (Fig. 1). However, there was no significant difference between the two groups in terms of remodeling index, plaque area, plaque burden, plaque components, and percent plaque composition. The minimal lumen area of the CTO group, which was measured after ballooning, was similar to the non-CTO group (3.67±1.05 mm2 vs. 4.08±1.52 mm2, p=0.264). In this study, all CTO group patients underwent VH-IVUS after ballooning. After ballooning, the lumen area was dilated, which may contribute to discrepancies in minimal lumen area of CTO lesions. Plaque burden of the proximal (53.0±12.7% vs. 46.3±10.7%, p=0.015) and distal reference vessels (47.8±11.3% vs. 41.2±11.4%, p=0.016) were greater in CTO lesions than in non-CTO lesions.
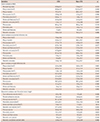
Volumetric analysis over the entire lesion length revealed that total atheroma volume (224±159 mm3 vs. 143±86 mm3, p=0.006) and percent atheroma volume (63.2±9.6% vs. 55.8±8.5%, p=0.011) of the CTO group were both significantly greater than those of the non-CTO group. The CTO group had greater fibrous volume (81.1±74.0 mm3 vs. 51.9±40.1 mm3, p=0.031), dense calcified volume (14.0±13.3 mm3 vs. 7.4±8.0 mm3, p=0.010), and necrotic core volume (27.7±24.0 mm3 vs. 14.4±12.5 mm3, p=0.005) compared to the non-CTO group (Table 2).
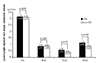
However, the lesion length adjusted plaque composition of the CTO group, which was calculated in order to compensate for the difference according to the varying lesion lengths between two groups, was not significantly different compared to that of the non-CTO group (Fig. 2). Dense calcified volume and necrotic core volume of CTO lesions in lesion length adjusted volumetric analysis were both somewhat larger than in the non-CTO lesions, but these differences were not statistically significant.
Discussion
The main findings of our study were as follows. We found that lesion length and plaque burden of the CTO group were significantly longer and greater than those of the non-CTO group. In addition, the CTO group had greater overall fibrous volume, dense calcified volume, and necrotic core volume in volumetric analysis performed over the whole lesion length, but the lesion length adjusted plaque composition showed no significant difference between the two groups. These findings suggest that plaque characteristics of the CTO lesion were similar to those of non-CTO lesion and that the difference of absolute plaque volume, especially in terms of fibrous volume, dense calcified volume, and necrotic core volume, was due to the difference in large plaque volume caused by the longer lesion length in CTO lesion.
Previous studies have reported that percentage of necrotic core had a direct relationship with plaque instability. A compartive study of the lesion characteristics in patients with ACS and SA found that the necrotic core volume of ACS was significantly greater than those of SA.10) Therefore, these investigators hypothesized that the lesion of ACS had more vulnerable plaque composition compared with those of SA. Another study on the pathologic findings of CTO lesions reported that long duration-CTO lesions were characterized by severe negative remodeling, moderate calcification (16.8%), and low composition of necrotic core area (7.8%).14) Our study revealed that the necrotic core volume of the CTO lesion (19.8%) was similar (p=0.166) to those of non-CTO lesion (17.5%) in lesion length adjusted volumetric analysis. This finding suggests that the CTO lesion is not more vulnerable than non-CTO lesion. This result is in keeping with previous studies that have found a small necrotic core volume in the CTO lesion. A prior study that investigated the correlation between histology and angiographic findings of CTO lesions suggested that the plaque of CTO lesions evolved from a cholesterol laden plaque to fibrocalcific plaque as a result of an aging process. Formation rates of neovascular channels in intimal plaques derived from the tunica adventitia increase with age and are also associated with intimal plaque cellular inflammation.15) These findings may help explain the adverse events of PCI in elderly CTO patients, such as coronary arterial dissection and coronary arterial rupture. However, necrotic core volume in lesion length adjusted volumetric analysis of CTO lesions was not different in those of non-CTO lesions in our study. PCI of CTO may carry a risk of adverse events due to neovascular channels derived from the tunica adventitia, but plaque composition of CTO lesions was not different from those of non-CTO lesion, particularly with respect to necrotic core volume, in our study. Thus, CTO lesions may not be more vulnerable than non-CTO lesions.
To date, there have been few studies comparing in vivo plaque composition of CTO and non-CTO lesions. Our findings are in keeping with a recent study on VH-IVUS findings in CTO lesions and non-occlusive lesions, which revealed that the necrotic core percentage was similar to non-occlusive lesions.16)17) However, these investigators reported that the dense calcium in CTO lesions was less than that in non-occlusive lesions and, thus, the necrotic core/dense calcium ratio tended to be greater (although statistically insignificant) in the CTO lesions than in non-occlusive lesions. They also reported that a high necrotic core/dense calcium ratio was associated with plaque instability and that this ratio was also associated with an increased creatinine kinase-MB levels in non-ST elevation acute coronary syndrome.18)19) We also evaluated for differences in necrotic core/dense calcium ratio of CTO and non-CTO lesions. However, we did not detect a significant difference in the present study (Table 2). The previously study included ACS patients in their study population, while our study included only SA patients. In the previous study, they suggested that CTO lesions may be more vulnerable than non-occlusive lesions (although there was no statistical significance), but our study suggests that CTO lesions may not be different from non-CTO lesions in terms of plaque vulnerability.
This study has several limitations. Firstly, this study was a single-center, retrospective study and included a relatively modest number of patients. CTO lesions have been reported that describe the proximal, middle, or distal end of the lesion segment having unique plaque compositions.14) However, we had modest number of CTO patients, and we analyzed the entire lesion length but did not analyze the lesion according to the proximal, middle, or distal segment. Alas, this study was done to primarily compare the plaque characteristics between CTO and non-CTO lesions. Secondly, all patients in the CTO group underwent VH-IVUS after ballooning, so there was iatrogenic luminal dilatation in CTO lesions, which may have decreased plaque burden and, consequently, affect the percentage of each component of the plaque. However, this is inevitable while performing VH-IVUS in CTO lesions. Thirdly, VH-IVUS cannot appropriately identify a thrombus. Thrombus is often indicated as "green" or "green-yellow" by VH-IVUS, which was classified as a fibrous or fibro-fatty plaque. However, our study population consisted of patients with SA, which is typically not associated with the presence of a coronary thrombus. In addition, the study population in this study had all undergone successful PCI, and, thus, a modest selection bias is inevitable. However, all 22 CTO lesions in this study underwent PCI and VH-IVUS examination without any difficulty, so this may add minimal distortion of data. Moreover, the distal vessel of CTO lesions is usually contracted and we did pre-dilate the CTO lesion before IVUS examination with intracoronary nitroglycerin. This iatrogenic channel will contribute a bias to the true, pre-dilated lumen diameter of the CTO lesion. However, this problem was inevitable given what is required to perform VH-IVUS in CTO lesions currently.
In conclusion, CTO lesions were found to have a longer lesion length and greater plaque burden than non-CTO lesions. However, lesion length adjusted plaque composition showed no significant differences between the two groups. Fibrous, necrotic core, and dense calcified volume in volumetric analysis over the entire lesion length of CTO lesions were greater than those of non-CTO lesions, which, we hypothesize to be related to the longer lesion length in CTO lesions. These findings support that plaque characteristics of CTO lesions are similar to non-CTO lesions in patients with SA and a delicate and professional CTO PCI can increase success rates in the future.
 XML Download