

 PDF
PDF ePub
ePub Citation
 Print
Print


INTRODUCTION
Periodontal disease is one of the most significant oral health burdens worldwide, in addition to dental caries [1]. Recently, a systematic review reported that severe periodontitis is the sixth most prevalent disease worldwide, stating that the global age-standardized prevalence of the disease was 11.2% from 1991 to 2010 [2]. This finding indicates that severe periodontitis is constantly reported in multiple countries, despite variations among countries, regions, and population groups. Moreover, as a chronic disease, periodontitis is regarded as a cause of tooth loss, and is related to a diminished quality of life in individuals with this disease [3]. Periodontitis is a significant public health problem that can be managed at a national level by appropriate public health measures. It is particularly important to detect periodontitis early, to consistently screen and track the disease, and to monitor periodontitis-related morbidity.
Traditional clinical methods for measuring and diagnosing the severity and progress of periodontal disease involve measuring the destruction and inflammation of periodontal tissue, as well as the periodontal index [4]. Clinical measurements using a periodontal probe are conventionally used to detect periodontal disease [5]. Typically, periodontal pocket depth and clinical attachment level are used to diagnose periodontitis in population-level surveillance [6,7]. Periodontal pocket depth is the standard used to classify periodontitis severity according to the Community Periodontal Index recommended by the World Health Organization [6]. However, this clinical measurement method is invasive, and it is difficult to ensure interexaminer reproducibility. In addition, it is too resource-intensive to be used in population-level surveillance [8]. Thus, researchers have attempted to find methods that are reliable and cost-effective, such as questionnaires, and can be recommended for use in local contexts when clinical surveillance is not possible [9,10].
Many attempts have been made to develop screening methods that reflect the activity of inflammatory reactions and have simple sample collection methods, using biomarkers that can be collected by non-invasive sampling. Recent approaches to periodontitis screening have included methods using certain cytokines and cell enzymes in saliva to determine whether biomarkers can help detect periodontal inflammation in individuals with periodontal disease. Elevated levels of these biomarkers secreted by the host’s reaction to inflammation, particularly salivary interleukin-1β [11] and matrix metalloproteinase-8 [12], have been shown to be related to the clinical features of periodontitis. In addition, hemoglobin levels in saliva appear to have value as a contributing parameter that could enhance the validity of non-invasive periodontitis detection methods [4]. Methods used to detect periodontal disease using saliva are reliable and simple and are thus promising in terms of applicability. In particular, gingival bleeding has been reported to be related to gingival inflammation and is a sign of the early stages of periodontal disease. Therefore, salivary hemoglobin levels, which are likely to reflect bleeding from the gingiva, may be useful in periodontitis screening [13].
Several studies have reported that the incorporation of two or more factors into a screening method led to increased power in discriminating the presence of disease, via a combination of objective methods, such as host- and bacterially originated biomarkers [14] or salivary enzymes [12], and the combination of subjective methods, such as self-reported questions [4,9,10,15,16]. Recently, a research model including salivary hemoglobin levels, periodontal health questions, and age was tested among people with disabilities, showing a higher validity for the prediction of periodontitis than the use of any single factor [4]. However, people with disabilities may exhibit limitations in terms of their behaviors regarding individual oral hygiene as well as knowledge of oral health compared to people without disabilities, which means that studies of that population should be interpreted with special care [17]. People with intellectual or physical disabilities often have poor oral health compared to those without disabilities [18,19]. Furthermore, they are also vulnerable to oral diseases because most of them are usually accompanied by systemic disease and the patients are therefore on medications [20]; thus, they may exhibit more severe symptoms related to periodontal disease, such as bleeding, compared to patients without disabilities, even if they are diagnosed with the same underlying severity of periodontitis.
Thus, the predictive performance of multifactorial approaches to periodontitis screening should be validated in people without disabilities. This study aimed to evaluate whether a combined screening method incorporating salivary hemoglobin levels, a self-report questionnaire, and demographic characteristics was a viable non-invasive screening method for periodontitis.
MATERIALS AND METHODS
Study population
Participants were recruited from patients who visited the Department of Periodontology at Yonsei University Dental Hospital in Seoul, Korea, over the course of five months beginning in November 2013. The participants were 18–80 years of age and voluntarily participated in the study. Participants were excluded if they were pregnant, had undergone a periodontal operation within the past month, or had an injury accompanied by oral bleeding, such as a wound or ulcer. The number of participants was calculated based on previously published sample size calculation guidelines for diagnostic test studies [21]. The sensitivity and specificity values expected from the screening test were 0.85, and the lower bound of the 95% confidence interval was anticipated to be higher than 0.75. A total of 212 participants were required for this study, considering an expected dropout rate of 20%. Ultimately, 102 males and 100 females were included in this study, and the average age of the participants was 53.1 years (range=20-79 years). The participants provided written consent to participate in the study after being informed of its purpose and methods. Ethical approval for this study was obtained from the Institutional Review Board of Yonsei University Dental Hospital, Seoul, Korea (IRB No. 2-2013-0042), and the study was performed according to the Helsinki Declaration and the Strengthening the Reporting of Observational Studies in Epidemiology guidelines.
Self-report questionnaire
All participants filled out a questionnaire composed of 10 items related to oral health. Eight of the questions were developed by the Centers for Diseases Control and Prevention in cooperation with the American Academy of Periodontology (CDC-AAP) and were previously used in representative USA adults [9]. These questions dealt with the following topics: the presence of gum disease (Q1), subjective ratings of gum/teeth health (Q2), previous treatment for gum disease (Q3), the presence of loose tooth not caused by an injury (Q4), the presence of lost bone (Q5), the perception that a tooth does not look right (Q6), use of dental floss (Q7), and use of dental rinse products (Q8). Two other questions regarding current smoking habits (Q9) and current alcohol consumption (Q10) were added [4]. Answers to these questions were self-reported by participants under supervised conditions.
Salivary hemoglobin levels analysis
The participants first chewed on flavorless paraffin wax for thirty seconds, swallowed, and then chewed for five minutes, stimulating saliva that was collected. Saliva samples were taken from the participants at least one hour after breakfast, smoking, brushing, and drinking. The collected saliva was refrigerated at 4°C until the subsequent oral examination. One milliliter of extracted saliva was centrifuged for three minutes at 3000 rpm (Centrifuge PMC-880, Tomy Kogyo Co., Tokyo, Japan). Next, 0.05 mL of the supernatant was extracted and 1 mL of storage buffer was added. An occult blood test device (OC-SENSOR DIANA, Eiken Chemical Co., Tokyo, Japan) was used to calculate hemoglobin levels, which were diluted twenty-one-fold. The corrected levels were then calculated and used in the statistical analysis. Oral examinations of all participants confirmed that none had experienced a traumatic injury from biting the buccal mucosa or the tongue.
Clinical periodontal examination
The Community Periodontal Index (CPI) was used in this study to evaluate periodontitis clinically. This protocol was performed by a single trained examiner (YJM) using a probe with a 0.5 mm ball at the end. This study examined the index teeth in the sextants of dentition, following the oral health survey guidelines of the World Health Organization (WHO), and the periodontal health condition of the participants was classified according to the maximum CPI score [6]. CPI scores of 3 and 4 were regarded as periodontitis. This study evaluated the ability of the following screening tests to predict the prevalence of patients with CPI scores of 3–4 (pocket depth ≥4 mm) and CPI scores of 4 (pocket depth ≥6 mm): 1) salivary hemoglobin levels; 2) questionnaires; and 3) a combination of salivary hemoglobin levels, questionnaires, and the participants’ age.
Statistical analysis
A frequency analysis of the age, sex, and systemic disease status of participants was performed according to the categorization of periodontitis into CPI scores of 3–4 and 4. Correlations between CPI scores of 3–4 and 4 and self-reported responses to the questionnaire were evaluated using the chi-square test. Questions for which a P-value lower than 0.05 was observed were considered to be significantly correlated to each level of periodontitis severity. Since the salivary hemoglobin levels showed a left-skewed distribution, the homogeneity of the salivary hemoglobin levels among the groups with CPI scores ranging from 0 to 4 was determined using the Kruskal-Wallis test. In addition, differences in the hemoglobin levels between groups with and without periodontitis, as defined by a CPI score of at least 3, and between the two groups with and without a CPI scores of 4 were determined using the Mann-Whitney U test. Next, the validity of salivary hemoglobin levels only (Model 1) and selected questions only (Model 2) in predicting the prevalence of periodontitis diagnosed by a CPI score of 3–4 or 4 was evaluated, in order to establish a baseline for evaluating the utility of a combined method. Binary logistic regression analyses were performed to confirm the cutoff point and the predictive performance of each model. Next, receiver operating characteristic (ROC) curves were constructed and the area under the ROC curve (AUROC), sensitivity, and specificity were calculated. Finally, this study evaluated the validity of a combined model (Model 3), which incorporated salivary hemoglobin levels over the cutoff point confirmed in Model 1 and the questions identified as significant predictors in Model 2, as well as age, to predict the prevalence of CPI scores of 3–4 and 4. All AUROC values were also compared. The maximum point that the sum of the sensitivity and specificity values was established as the cutoff point. All statistical analyses were performed using SPSS 20.0 (IBM Corp., Armonk, NY, USA) and STATA 13.0 (Stata Corp., College Station, TX, USA). P-values <0.05 were considered to indicate statistical significance.
RESULTS
The general characteristics of the 202 participants are presented in Table 1. A total of 79.7% of the patients were diagnosed with CPI scores of 3–4 (24 to 79 years old, mean age=54.3 years), and 46.5% were diagnosed with a CPI score of 4 (24 to 78 years old, mean age=53.1 years). As the age of the participants increased from 20 years to 50 years, the number of periodontitis patients also increased. Overall, more patients were diagnosed with a CPI score of 4 than with a CPI score of 3. The distribution of scores according to sex was relatively equal. However, there were more CPI 4 patients than CPI 3 patients among males, whereas both categories of periodontitis were similarly represented among females. Of the participants, 25.7% had systemic disease. Hypertension was the most common systemic disease, followed by diabetes.
Table 1
Distributions of study participants by periodontitis category and selected demographic characteristics
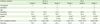
The salivary hemoglobin levels of the participants were grouped by CPI score (Table 2). The distribution of salivary hemoglobin levels significantly varied among the five CPI groups (P<0.001). The median salivary hemoglobin levels were lowest in the CPI 0 group, at 0.29 μg/mL (range, 0.11–15.44 μg/mL), and highest in the CPI 4 group, at 1.45 μg/mL (range, 0–156.24 μg/mL). However, the median salivary hemoglobin levels did not uniformly increase as the CPI score increased, because the median score in the CPI 2 group was higher than that of both the CPI 1 and 3 groups. When the CPI groups were divided into two subgroups according to the severity of periodontitis, significant differences were found in the hemoglobin levels between the groups with and without periodontitis as defined by a CPI score of at least 3 (P=0.011), and between the groups with and without a CPI score of 4 (P<0.001).
Table 2
Distributions of salivary hemoglobin levels by CPI score

a)The Kruskal-Wallis test was used to compare salivary hemoglobin levels among CPI groups.
b)The Mann-Whitney U test was used to compare salivary hemoglobin levels between the CPI ≤2 and CPI ≥3 groups.
c)The Mann-Whitney U test was used to compare salivary hemoglobin levels between the CPI ≤3 and CPI 4 groups.
CPI, community periodontal index.
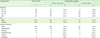
The correlations between the prevalence of each level of periodontitis severity (CPI scores of 3–4 and 4) and each question are shown in Table 3. The questions were completed by all participants. The following five questions showed significant associations with a CPI score of 3–4: Q1 (the presence of gum disease), Q2 (subjective rating of gum/teeth health), Q4 (the presence of a loose tooth not caused by an injury), Q5 (presence of lost bone), and Q7 (dental floss use). A CPI score of 4 was significantly associated with the following questions: Q1, Q2, Q4, Q5, and Q9 (smoking habits) (P<0.05). Thus, these two slightly distinct sets of questions were used to predict CPI scores of 3–4 and 4, respectively.
Table 3
Distributions of responses to questions and their correlations with periodontitis
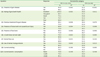
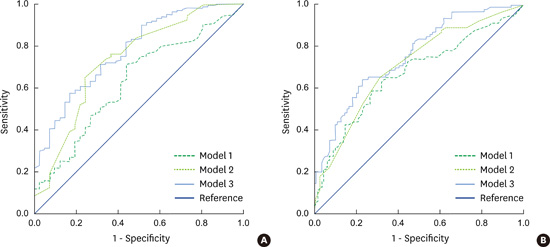
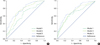
Table 4 and Figure 1 present the validity of salivary hemoglobin levels (Model 1), self-report questions (Model 2), and a model that combined these two screening variables with age (Model 3) in predicting the presence of CPI scores of 3–4 and 4. Model 3 showed the highest predictive performance for CPI scores of 3–4, with an AUROC of 0.78, a sensitivity of 71.3%, and a specificity of 68.3%. Model 1 showed the lowest predictive performance, with an AUROC of 0.63, a sensitivity similar to that of Model 3, and a specificity of <60% at the cutoff point of 0.37 μg/mL. Model 2, which used Q1, Q2, Q4, Q5, and Q7, had an AUROC of 0.73 and sensitivity and specificity values that were slightly higher than those of Model 1.
Table 4
Receiver operating characteristics (ROC) analysis of the predictive models as screening tests for the prevalence of periodontitis by CPI score
The questions used in the predictive model for CPI 3–4 were having gum disease, rating of gum/teeth health, loose tooth not caused by an injury, lost bone, and dental floss use. The questions used in the predictive model for CPI 4 were having gum disease, rating of gum/teeth health, loose tooth not caused by an injury, lost bone, and current smoking habit.
Model 1, salivary hemoglobin levels; Model 2, questionnaires; Model 3, a combination of salivary hemoglobin levels, questionnaires, and the participant’s age; AUROC, the area under the ROC curve; CPI, community periodontal index.
a,b)Differenent superscript letters refer to significant difference among models within the same disease severity.
Figure 1
ROC curves for the prediction of periodontitis prevalence as diagnosed by CPI 3-4 (a) and CPI 4 (b). The curves of Model 1, 2, and 3 were constructed using data obtained from salivary hemoglobin levels, the selected questions, and combination of the above two data sets and age. The curves of Model 3 showed the best performance in identifying both patients who were diagnosed as CPI 3-4 (AUROC of 0.78, a) and CPI 4 (AUROC of 0.76, b). ROC, receiver operating characteristics; CPI, community periodontal index.
The predictive performance of the three models for CPI scores of 4 was essentially equivalent to the results for predicting CPI scores of 3–4, with the same ordering of the models. Model 3 had the highest AUROC (0.76) and specificity (76.9%), as well as the highest classification accuracy (70.6%). Model 2, consisting of Q1, Q2, Q4, Q5, and Q9, had a similar sensitivity to Model 3 (66%), but had a lower specificity than the other two models. As for Model 1, which incorporated salivary hemoglobin levels alone, the AUROC was 0.67 at a cutoff point of 1.17 μg/mL, and the sensitivity was the lowest of all three models. Overall, the three models had a higher sensitivity than specificity in predicting CPI scores of 3–4, while showing differences in predicting CPI 4. The classification accuracy was higher for predicting CPI scores of 3–4 than CPI scores of 4. The AUROC values of Model 1, Model 2, and Model 3 in predicting both CPI scores of 3–4 and CPI scores of 4 were significantly different (P=0.0004 and P<0.0001, respectively).
DISCUSSION
The usefulness and reliability of occult blood detection tests using saliva samples in detecting gingival inflammation was demonstrated in a previous study [22]. Moreover, the salivary level of hemoglobin had been opened to be used to screen for periodontal disease groups with CPI 1 and 3 when demographic variables of the patients were adjusted [23]. Therefore, salivary hemoglobin levels were chosen for this study. However, we found the diagnostic accuracy of salivary hemoglobin levels in predicting CPI scores of 3–4 and 4 to be low, with AUROC values lower than 0.7. Nevertheless, in the prediction of CPI scores of at least 3, salivary hemoglobin levels displayed 30% higher sensitivity and a slightly higher AUROC value (>0.6) than observed in a previous study, which found an AUROC value of <0.6 using the same diagnostic criteria for periodontitis in people with disabilities [4]. These differences were most likely caused by the different distributions of salivary hemoglobin levels in the five CPI groups and the different cutoff points used to predict the presence of periodontitis between the two study populations. In that study, the minimum salivary hemoglobin levels in each CPI group were similar to those found in the current study, but the maximum and median values were 1.3–11 times and 1.7–6.5 times higher, respectively. Thus, the hemoglobin levels detected in the present study were generally lower, meaning that the cutoff value of 0.37 µg/mL for predicting CPI scores of 3–4 and the cutoff of 1.17 µg/mL for predicting CPI scores of 4 were lower than those used in the previous study, which likely increased the sensitivity of the predictive models [24].
Selected questions (Model 2) could be used as a single predictor for CPI scores of 3–4 or 4, with AUROCs of 0.73 and 0.71, respectively. The questionnaire was used to evaluate periodontal health and consisted of questions about the presence of symptoms, oral health behaviors, and whether the patients had undergone treatment for periodontitis [25]. Thus, the successful use of the questionnaire requires respondents to report their periodontal health status accurately [26]. It is possible that patients with site-specific periodontitis could associate that condition with their overall oral health status, despite the local occurrence of symptoms. Therefore, the questions used in the present study did not focus on the periodontal health of specific sites in the oral cavity. The questions about awareness, which dealt with whether patients had gum disease (Q1) and their perceptions of their own oral health status (Q2), were related to the prevalence of periodontitis and were included in Models 2 and 3 in the present study.
Questions about loose teeth have been used to identify the presence of tooth mobility in a number of studies. This question has been shown to be successful in predicting a probing depth of >4 mm, demonstrating a specificity of 92% in a previous study [26]. This question has also been used in studies in the USA and Australia, which have demonstrated that this question was correlated with the prevalence of periodontitis (attachment loss and CDC-AAP definition of periodontitis [7]), independent of the population sample [15,16,27]. Not surprisingly, the question about loose teeth was a strong predictor for periodontitis. Moreover, bone loss was involved in the predictive models for periodontitis based on the 2009–2010 National Health and Nutrition Examination Survey in USA adults [9]. Among the symptoms of periodontitis, loose teeth and bone loss are associated with the later stages of the disease [15]. Nevertheless, Q4 (loose teeth) and Q5 (bone loss) showed a correlation in this study with CPI scores of at least 3, which reflected relatively less severe periodontitis (probing depth ≥4 mm), which may be attributed the fact that more than half (58.4%) of the CPI 3–4 group consisted of patients with CPI 4 (probing depth ≥6 mm).
In contrast, dental floss use (Q7) was selected for the prediction of CPI scores of 3–4 and in identifying periodontitis patients in a USA study [9], while it was excluded from a predictive model for patients with CPI scores of 3–4 and 4 who had disabilities [4]. Furthermore, current smoking (Q9), which has been considered a risk factor for the development and progression of periodontitis [28,29], was not selected in the CPI 3–4 prediction model in this study, but it was selected in the CPI 4 prediction model. Although questionnaires consisting of similar questions were used in each study, different questions were identified as predictive of the presence of periodontitis. This is most likely due to the different definitions of periodontitis in different populations, as well as the possibility that different populations had different experiences with the disease while remaining within the same diagnostic criteria.
The present study demonstrated that Model 3, which combined two non-invasive single variables with age, displayed the best predictive performance and that these methods could be considered as possible substitutes for clinical measures. Although the AUROC values among the models were not significantly different between the combined model and the questionnaire model, the values were slightly higher in the combined model. Based on these results, salivary hemoglobin levels may improve the precision of the questionnaire in predicting a CPI score of 4. In addition, the combined method improved the specificity value in comparison to the use of a single variable only, while retaining a similar sensitivity. The higher sensitivity value may have implications for screening people with disease in population-level surveillance programs rather than for confirming the diagnosis [24].
In a pilot study, combining the age of the participants with the individual variables of self-reported questions or salivary hemoglobin levels improved the AUROC values for the of CPI scores of 3–4 (AUROC of Model 1+age=0.69, AUROC of Model 2+age=0.76), but no changes were observed in the models for CPI scores of 4. The age of the study population has been previously considered a predictor, and it is sometimes accounted for as a confounding factor in evaluating correlations between other predictors and the prevalence of periodontitis [30]. It has also been reported that the prevalence of severe periodontitis (CPITN 4, attachment loss >6 mm, and probing depth >5 mm) in the global population aged over 15 years from 1990 to 2010 increased with age and stabilized in age groups more than 40 years old [2]. Periodontitis is not caused by the aging process, but it is expected that poor oral health, which is more commonly observed in older age groups, results in the accumulation of the negative effects of ongoing poor oral hygiene after a specific time point [31]. Additionally, a previous study showed that the age of the participants enhanced the accuracy and sensitivity of predictive models in combination with single discrete factors [4]. Thus, the inclusion of people of various age groups should be considered in future studies, and age can be considered a factor that is jointly predictive of periodontitis along with other factors.
Patients with CPI scores of 3–4 comprised nearly 80% of our study population. This may have been because the present study recruited participants who visited the Department of Periodontology. This study attempted to evaluate the reducibility and usefulness of a combined model in predicting the prevalence of periodontitis in a high-risk group. Thus, the targeted participants were selected from these patients.
In conclusion, this study found that a predictive model combining salivary hemoglobin levels, a self-report questionnaire, and the age of participants was a viable non-invasive screening test for periodontitis.
 XML Download