

 PDF
PDF ePub
ePub Citation
 Print
Print


Introduction
Peri-implant bone foundation is an important factor affecting the success of dental implant treatment. After tooth extraction, the alveolar ridge commonly decreases in volume.1 To prevent further bone resorption after implantation–especially in the anterior maxilla, which requires careful attention to provide esthetic outcomes–several parameters must be considered to limit stress on dental implants, including implant number, implant position, and the available bone.2
Misch (2008) reported that implant number and position were influenced by the dental arch form in the premaxillary area due to the stress distribution around dental implants.3 A later study by Sagat et al. (2010) noted that favorable implant distributions in relation to stress concentration were dissimilar across different maxillary alveolar arch forms.4 These studies suggested that the most favorable implant number and position were determined by the arch forms at the levels of both the dental and alveolar bone. Dental implants are placed at the alveolar bone level, and implant position in the anterior zone is critical for the esthetic outcome; thus, anterior alveolar arch forms (AA arch forms) might be important for implant treatment planning and success.
Full arch forms have been identified and classified at the tooth level using plaster and 3-dimensional visual models.56789 Ronay et al. (2008) reported the assessment of full arch forms at the alveolar bone level using the keratinized tissue band superior to the mucogingival junction of the mandible (the WALA ridge) as the reference level.10 However, this does not indicate the location of the implant and might be inaccurate due to interference from movable tissues. Recently, cone-beam computed tomography (CBCT) was introduced as a noninvasive technique to identify hard tissue in the buccolingual, mesiodistal, and apicocoronal dimensions. The use of CBCT to evaluate bone surrounding the tooth or implant has been previously validated.11121314151617 Moreover, studies have evaluated human full arch forms at the alveolar bone level using CBCT images1819 The midpoints of the roots at the coronal third level of the right and left mandibular canines were set as reference points because they correspond to the vertical level of the WALA ridge.1819
Another important factor is the available bone. Before placing implants, the alveolar bone at the implant site must be evaluated in 3 dimensions. Buccolingual bone width plays a critical role in esthetic success since buccolingual bone supports the gingiva around the implant. Buser et al. (2004) recommended that the implant should be placed about 1 mm palatal to the point of emergence at the adjacent teeth.20 Grunder et al. (2005) reported that labial bone required at least 2 mm of thickness to provide stability, decrease marginal bone loss, prevent gingival recession, and promote an esthetically favorable outcome after implant placement.21 Bone reconstruction should be performed in areas of insufficient bone to improve both the functional and esthetic results.2223
Altogether, a deeper understanding of AA arch forms and buccolingual alveolar bone thickness in the esthetic zone could be helpful for defining and predicting the prognosis of implant treatment. A literature review failed to find any publications concerning alveolar arch forms in the anterior esthetic zone. Thus, this study aimed to classify AA arch forms at the implant platform level and to investigate the differences in buccolingual alveolar bone thickness among AA arch forms using CBCT image datasets.
Materials and Methods
Sample collection
Following Ethics Review Committee approval, 113 CBCT images without any technical errors or artifacts affecting diagnostic quality were retrospectively obtained from the patient database of the Faculty of Dentistry, Chulalongkorn University. All the patients presented class I normal occlusion. The selected images exhibited all the maxillary teeth from the right second molar to the left second molar without crowding or spacing. The exclusion criteria were periodontal disease, the presence of root canal filling materials or any restorations, malalignment of root center points, root resorption, and previous orthodontic treatment. All the images were obtained using a scanner (iCAT™; Imaging Sciences International, Hatfield, PA, USA) with a field of view measuring 160 mm in diameter by 130 mm in height, resulting in a 0.20-mm voxel size. Raw Digital Imaging and Communications in Medicine (DICOM) files of the CBCT images were imported into CBCT viewing software (Kodak Dental Imaging Software 3D Module 2.4, CodeWeavers Inc., Saint Paul, MN, USA). Measurements were made by a single operator to ensure uniformity.
Image settings and measurements
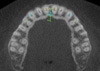
The subject's head position for each scan was reoriented. The axial plane was set parallel to the occlusal plane. The sagittal plane was set parallel to the median palatine suture. The coronal plane was created perpendicular to both the axial and sagittal planes. The CBCT images were measured in the axial view at the level of 3 mm below the cementoenamel junction (CEJ) of the right and left canines (Fig. 1). The root center points of the maxillary central incisors (a and a′), canines (b and b′), and first premolars (c and c′) were used as the reference points. Three horizontal reference lines were created. The first reference line was created between the root center points of the maxillary right and left central incisors (aa′ line). The second reference line was drawn from the root center point of the right canine to the root center point of the left canine, and was referred to as the intercanine width (bb′ line). The third reference line was drawn between the root center points of the right and left maxillary first premolars, and was referred to as the interpremolar width (cc′ line). There were 2 vertical distances, the intercanine depth and interpremolar depth. The intercanine depth was the shortest distance that linked the intercanine width to the midpoint of the first reference line (ambm line). The interpremolar depth was the shortest distance that linked the interpremolar width to the midpoint of the first reference line (amcm line). The intercanine width-to-depth ratio was calculated and was used as a parameter for AA arch form classification, along with intercanine width and interpremolar width, since the intercanine width-to-depth ratio represented the shape of the anterior arch, while the intercanine width and interpremolar width provided information about the anterior and posterior arch dimensions of the esthetic zone, respectively. K-means cluster analysis was performed to classify the subjects into several groups. The appropriate number in each group was determined using the average silhouette width, which was the method used to identify dissimilarities in the same group and between groups. The optimal classification of groups exhibited the widest average silhouette width.
To identify the type of the AA arch form, a fourth-degree polynomial function was used according to previous studies, with minor modifications.91824 Briefly, the fourth-degree polynomial equation created smooth curves that approximately fit the X and Y coordinates. Thus, the X and Y coordinates of each CBCT image were established. The Y-axis was created parallel to the median palatine suture, with a maximum length of 40 mm. The X-axis was a line perpendicular to the Y-axis at the level of the root center point of the most posterior second molar, with a maximum length of 80 mm. All X and Y coordinates of the teeth in the anterior esthetic zone (right to left first premolars) were digitally located at the root center point of each tooth. The mean coordinates of each group were exported to mathematical software (MATLAB R2013a; Mathworks Inc., Natick, MA, USA) in order to plot and create the best-fitting curve using the following fourth-degree polynomial equation:
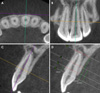
The buccolingual thickness of the alveolar bone was measured according to the report of Braut et al. (2011), with minor modifications.11 Briefly, the CBCT images were sliced at the positions of each tooth in the anterior esthetic zone. The axes were set perpendicular to the labial or buccal contour of the alveolar bone, passing through the center of the root canal and parallel to each root axis. The buccolingual bone thickness measurement was performed in the cross-sectional view perpendicular to the long axis of the tooth at 3 mm below the CEJ and at the mid-root (Fig. 2). The average alveolar bone thickness for each tooth in the anterior esthetic zone was calculated at both levels. The differences in alveolar bone thickness across the types of AA arch forms were analyzed.
Reliability test
To assure that the examiner exported results reliably, intra-examiner calibration was performed by randomly selecting image volumes from 10 subjects to measure all the variables twice. The second measurement was carried out 2 weeks afterward. Inter-examiner calibration with the results of an examiners was performed by measuring all the variables from 10 randomly selected subjects until the results of the examiners, and the expert showed no significant differences.
Data analysis
Intra-examiner calibration and inter-examiner calibration were evaluated through the intraclass correlation coefficient (ICC), using a 2-way mixed model to obtain 95% confidence intervals. The maxillary AA arch forms were classified using K-means cluster analysis and silhouette width. One-way analysis of variance (ANOVA) and the least significant difference (LSD) post hoc test were conducted to determine the variables that influenced the AA arch form and the differences in buccolingual alveolar bone thickness across the arch forms. P-values<.05 were considered to indicate statistical significance. Statistical software (SPSS version 20.0; IBM Corp., Armonk, NY, USA) was used to analyze the data for intra-examiner calibration, inter-examiner calibration, 1-way ANOVA, and the LSD post hoc test. K-means clustering was performed using R software (R 3.2.0, http://www.r-project.org).
Results
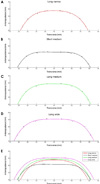
The samples included 113 subjects (43 males, 70 females). Their ages ranged from 20 to 39 years (average age, 30.43 years). The intra-examiner and inter-examiner precision was 0.992 and 0.996, respectively. The subjects were classified into 3–10 clusters using K-means cluster analysis, and the result with 4 clusters showed the highest values of silhouette width. In other words, a 4-cluster classification had the greatest similarity within each cluster and the greatest dissimilarity between clusters. The mean coordinates of the subjects in each group were fit to the curves of the fourth-degree polynomial equation (Fig. 3). The AA arch forms were given names corresponding to the depth and width of the curves, as follows: long narrow arches, short medium arches, long medium arches, and long wide arches. The number of subjects, mean values, standard deviations, and the lower and upper bounds of all the variables in each group are presented in Table 1. All 4 groups showed significant differences between groups (P values<.05). According to the LSD post hoc test, the intercanine width and interpremolar width of the long narrow arch group (29.66±1.32 mm and 36.01±1.39 mm, respectively) were the narrowest transverse dimensions among all groups. The intercanine and interpremolar widths of the short medium arch group (31.81±1.56 mm and 38.96±1.41 mm, respectively) as well as those of the long medium arch group (32.36±1.02 mm and 38.75±0.84 mm, respectively) showed no significant difference and were classified as medium transverse dimensions. In contrast, the long wide arch group exhibited the widest transverse dimensions (35.01±1.26 mm and 41.74±1.41 mm, respectively). The intercanine depth and interpremolar depth were not significantly different between the long narrow group (5.57±0.90 mm and 11.16±1.38 mm, respectively), the long medium group (5.43±1.07 mm and 11.30±1.49 mm, respectively) and the long wide group (5.28±0.96 mm and 11.35±1.42 mm, respectively); however, these 3 long groups were significantly longer in the anteroposterior dimension than the short medium arch group (3.05±0.52 mm and 8.45±1.10 mm, respectively). The intercanine width-to-depth ratio presented the largest curve in the short medium arch group (10.70±1.70), followed by the long wide arch group (6.83±1.14), the long medium arch group (6.14±1.07), and the long narrow arch group (5.45±0.85).
The average buccolingual bone thickness showed significant differences among groups of AA arch forms both at 3 mm below the CEJ and at the mid-root level (P<.001) (Table 1). At the level of 3 mm below the CEJ, the long wide arch group had the greatest bone thickness (9.26±0.61 mm) followed by the long medium arch group (8.86±0.53 mm), the long narrow arch group (8.20±0.49 mm), and the short medium arch group (8.35±0.72 mm). Similar results were found at the level of the mid-root, where the long wide arch group exhibited the greatest buccolingual bone thickness (9.88±0.95 mm), followed by the long medium arch group (9.33±0.87 mm), the long narrow arch group (8.51±0.57 mm), and the short medium arch group (8.50±1.01 mm).
Discussion
Many previous studies have investigated human full arch forms at the tooth level, focusing on tooth alignment in orthodontic treatment,57892425 whereas few have paid attention to the alveolar arches and where the reference points were situated at the bone level, which is relevant for implant dentistry.101819 Most authors used plaster or 3-dimensional virtual models to evaluate arch forms; few have utilized CBCT images,1819 and none have focused on arch form in the maxillary anterior esthetic zone. This study, therefore, is the first to report a classification of AA arch forms and to characterize the buccolingual thickness of alveolar bone in the anterior esthetic zone using CBCT imaging techniques.
The root center points at the level of the coronal third of the right and left mandibular canines were used to evaluate the full alveolar arch form.1819 These were considered more advantageous than the WALA ridge points because they are located in hard tissue, which is more stable; hence, they were chosen as reference points in our study. Previous authors have reported that the implant platform should be located 3–4 mm below the free gingival margin to provide an esthetically satisfactory outcome.2627 Our study evaluated AA arch forms at the recommended implant platform level; consequently, a point 3 mm apical to the CEJ of the left and right canines was used as the reference, since the gingival margin can also be located at the CEJ. Moreover, as the most apical points, the zenith points of the gingival margin of the canines were generally equal to those of the central incisors. The zenith points of the lateral incisors and premolars were approximately 1 mm coronal to those of the central incisors and canines,2829 but still within the range of appropriate implant positions.
Recent studies have presented arch form classifications based on transverse dimensions and the arch width-to-depth ratio.8925 Our study used the intercanine width and interpremolar width, which represented the transverse dimensions of the anterior and posterior parts of the anterior esthetic arch, respectively, and the intercanine width-to-depth ratio, which described the anterior arch shape, as the parameters for AA arch form classification. Subjects were classified into 4 significantly different groups, as shown in Table 1. These results demonstrate that the arch forms of the maxillary anterior esthetic region can be classified at the level of the implant platform.
Although AA arch forms can be classified similarly to dental arch forms, the influence of the arch dimensions might be different. In our study, the intercanine width and interpremolar width, which represented the transverse dimensions of the anterior alveolar arch, played an important role in the AA arch form. These results corresponded to those of previous studies that evaluated the full maxillary arch form at the dental level and reported the effects of the anterior transverse dimension on the anterior dental arch form.89 The anteroposterior dimensions, as well as the anterior arch shape (represented by the arch depth and intercanine width-to-depth ratio, respectively), also influenced the AA arch form in our study. However, a previous study showed that the anterior dental arch depth and intercanine width-to-depth ratio did not affect the full maxillary dental arch form,9 in contrast to our results. This discrepancy was explained by Bayome (2013), who presented a strong correlation between the anterior transverse dimensions of dental and alveolar arches. Nevertheless, no significant correlation was found between the anteroposterior dimension of the anterior arch and the anterior arch shape.19 Hence, the AA arch form may be different from the anterior dental arch form because of dissimilarities in the anteroposterior dimensions and the shape of the anterior arch.
Previous reports have applied various mathematical functions to characterize human dental arches.567824 Fourth-degree polynomial equations have been extensively applied to create best-fitting curves of dental and alveolar arches.91824 However, parabolas and a mixed model have been used to represent arch forms in the anterior esthetic zone.2430 The principle of the mixed model was to analyze the anterior arch and posterior arch. The midpoints of the incisal edge of the anterior teeth and canine cusp tips were fitted with semi-ellipse curves, while the buccal cusp tips of the posterior teeth were fitted with parabolic curves. Ferrario (1994) compared fourth-degree polynomial equations with the mixed model and revealed that both equations could be used to define a mathematical description of dental arches.24 Since no study has examined the best-fitting curve of arch forms in the anterior esthetic zone at the bone level, a pilot study was performed to validate the best-fitting curves among parabolas, ellipses, and fourth-degree polynomial equations (data not shown). The fourth-degree polynomial equation was selected for curve-fitting in our study because it showed the closest correlation with the actual alveolar arch form. Four different AA arch forms were displayed after fitting the average X and Y coordinates of each arch type with the fourth-degree polynomial equation, representing the shape of the maxillary anterior arch at the implant platform level (Fig. 3). The names of the AA arch forms were chosen based on the arch depth and arch width. Hence, the AA arch forms could be classified as long narrow, short medium, long medium, and long wide.
Buccolingual alveolar bone thickness is an important factor for the selection of implant diameter and number, and for deciding whether to perform bone contour augmentation. Moreover, the different types of AA arch forms might have distinct characteristics in terms of buccolingual alveolar bone thickness. Thus, our study investigated differences of buccolingual alveolar bone thickness between AA arch forms in the anterior esthetic region. At both the implant platform level and the mid-root level, the long wide arch group presented the greatest buccolingual bone thickness, followed by the long medium arch group. The smallest buccolingual bone thickness was observed in the long narrow and short medium arch groups. These findings imply that for clinical treatment planning, small arches both in the anteroposterior (long narrow arch form) and transverse (short medium arch form) dimensions contained thin alveolar bone. Thus, for these types of arch forms, clinicians should carefully consider placing reduced-diameter implants or bone contour augmentation when horizontal bone loss has occurred.
In conclusion, arch forms in the anterior esthetic zone at the level of the implant platform were classified into 4 groups: long narrow arches, short medium arches, long medium arches, and long wide arches. The buccolingual alveolar bone thickness showed significant differences among the AA arch forms.

 XML Download