Journal List > Endocrinol Metab > v.33(3) > 1101093

Nam, Han, Lee, You, Kim, Kang, Park, and Ahn: Calpain-10 and Adiponectin Gene Polymorphisms in Korean Type 2 Diabetes Patients

Abstract

Background

Genetic variations in calpain-10 and adiponectin gene are known to influence insulin secretion and resistance in type 2 diabetes mellitus. Recently, several single nucleotide polymorphisms (SNPs) in calpain-10 and adiponectin gene have been reported to be associated with type 2 diabetes and various metabolic derangements. We investigated the associations between specific calpain-10 and adiponectin gene polymorphisms and Korean type 2 diabetes patients.

Methods

Overall, 249 type 2 diabetes patients and 131 non-diabetic control subjects were enrolled in this study. All the subjects were genotyped for SNP-43 and -63 of calpain-10 gene and G276T and T45G frequencies of the adiponectin gene. The clinical characteristics and measure of glucose metabolism were compared within these genotypes.

Results

Among calpain-10 polymorphisms, SNP-63 T/T were more frequent in diabetes patients, and single SNP-63 increases the susceptibility to type 2 diabetes. However, SNP-43 in calpain-10 and T45G and intron G276T in adiponectin gene were not significantly associated with diabetes, insulin resistance, nor insulin secretion.

Conclusion

Variations in calpain-10, SNP-63 seems to increase the susceptibility to type 2 diabetes in Koreans while SNP-43 and adiponectin SNP-45, -276 are not associated with impaired glucose metabolism.

INTRODUCTION

There has been a rapid rise in the incidence of type 2 diabetes mellitus (DM) in Korea due to a recent economic development and industrialization [1]. Insulin resistance (IR) and impaired insulin secretion (IIS) are two main pathogenesis of type 2 diabetes, and they are related to both the environmental and genetic factors. However, very few genes have been identified [12]. Recently, calpain-10 (CAPN10) gene polymorphism has been reported to be associated with the IIS and insulin action as well as the development and progression of type 2 diabetes [3]. CAPN10 is a calcium activated protein expressed ubiquitously in human bodies including heart, skeletal muscles, liver, and pancreatic islet cells [4]. It contributes to glucose metabolism by regulating insulin secretion from pancreatic β-cells and insulin action at the adipocyte level [4]. Accordingly, it has been reported that CAPN10 gene is a crucial factor for obesity and diabetes, and combinations of single nucleotide polymorphisms (SNPs) (such as SNP-44, -43, -19, and -63) predominantly located in the intron of CAPN10 gene are involved in the development of diabetes [56].
Adiponectin is a well-known adipocytokine that is closely related to IR, obesity, atherosclerosis, and type 2 diabetes [7]. It is abundantly expressed in white adipocytes and structurally similar to collagen VIII and X, complement C1q17-20, and tumor necrosis factor-α (TNF-α) [7]. Adiponectin gene is located in chromosome 3q27 and composed of 3 exons and 2 introns. It has been reported that SNPs, including a silent T to G substitution (+45T>G) in exon 2 and a G to T substitution (+276G>T) in intron 2, are related to low blood adiponectin concentration, IR, and type 2 diabetes [89].
There are several studies that demonstrated the association between genetic variations in the genes coding adiponectin and IR, metabolic syndrome as well as the risk of type 2 diabetes in Korean population [1011]. However, not much is known about the CAPN10 genetic polymorphism and metabolic derangements in Koreans. Therefore, the present study explored the associations between CAPN10 and adiponectin gene polymorphism and various components of metabolic syndrome, IR and secretion, and the incidence of type 2 diabetes in Korean population.

METHODS

Subjects

This study was conducted on 249 Korean type 2 diabetes patients at Diabetes Center of Gangnam Severance Hospital, Korea from January 2006 to June 2007. Previously diagnosed diabetes patients based on self-reported responses and newly diagnosed diabetes patients according to American Diabetes Association criteria were all included. Type 1 diabetes patients and those who received insulin therapy within 3 years after the diagnosis of type 2 diabetes were excluded. The control group was composed of 131 non-diabetic patients from Gangnam Severance Check-up Center. The Institutional Review Board (3-2006-0005) of Yonsei University College of Medicine approved this study protocol, and written informed consent was obtained from all subjects.

Anthropometric measurements

Body weight and height were measured in the morning, with light clothing without shoes, and body mass index (BMI) was calculated by dividing the weight (kg) by the square of the height (m2). Waist circumference was measure at the midway between the lower margin of the last palpable rib and the top of the iliac crest at the end of a normal expiration. Systolic and diastolic blood pressures were measured by an experienced technician by placing the left arm at heart level after a 5-minute rest.

Biochemical parameters

Blood samples were taken from all subjects after an overnight fast. Standard methods were used for biochemistry. Fasting plasma glucose, total cholesterol, high density lipoprotein cholesterol (HDL-C), and triglycerides (TGs) levels were determined using enzymatic methods with a Hitachi 7600-120 automated chemistry analyzer (Hitachi, Tokyo, Japan). Low density lipoprotein cholesterol (LDL-C) was calculated according to the Friedewald formula. Hemoglobin A1c (HbA1c) was determined by high performance liquid chromatography (Variant II, Bio-Rad, Hercules, CA, USA). Fasting serum insulin was determined by chemiluminescence (RIA kit, Daiichi, Tokyo, Japan), and IR was calculated using the homeostasis model assessment of insulin resistance (HOMA-IR) index, using following formula: HOMA-IR=glucose (mmol/L)×insulin (µU/mL)/22.5. Insulin secretion capacity was calculated using homeostasis model assessment of β-cell function (HOMA-β) index using the following formula: HOMA-β=20×insulin (µU/mL)/[glucose (mmol/L)−3.5].

Genotyping of polymorphisms in CAPN10 and adiponectin gene

CAP10 gene polymorphism

Genomic DNA was isolated from 5 mL of whole blood collected in ethylenediaminetetraacetic acid (EDTA) tubes. The genotype of all patients was classified depending on two CAPN10 gene polymorphisms (SNP-43, -63), which were analyzed using TaqMan (TaqMan fluorogenic 5′ nuclease assay; Applied Biosystems, Waltham, MA, USA) and SNaPshot method respectively. Polymerase chain reaction (PCR) reaction solution was adjusted to a final volume of 5 µL containing 10 ng of template DNA, 0.13 µL of 40X assay mix (Assay ID C_27483762_10), and 2.5 µL of TaqMan Universal PCR master mix. Real-time PCR was performed in two stages using ABI Prism 7900HT Fast Real-Time PCR System (Applied Biosystems, Waltham, MA, USA), thus 45 cycles of PCR were done at 95℃ for 15 seconds and at 60℃ for 1 minute after an initial denaturation at 95℃ for 10 minutes. PCR analysis was performed using 7900HT SDS 2.3 software (Applied Biosystems). Meanwhile, SNaPshot assay was employed to analyze SNP-63, and the SNP site was amplified using 5′-AGCACCCAGTCCTACCAGTG-3′ (Forward) and 5′-CTGGCTGGAGTTTGGAGAAG-3′ (Reverse). PCR contained solution was prepared containing 10 ng of 0.5 pM template DNA, 0.5 pM forward/reverse primer, 1l of 10X PCR Gold buffer, 250 µM dNTP, 3 mM MgCl2, and 0.25 unit of DNA polymerase, and we added distilled water to make a final volume of 10 µL. The solution was incubated at 7℃ for 7 minutes. PCR was carried out with one cycle of 95℃ for 10 minutes, and 30 cycles of 95℃ for 30 seconds, 60℃ for 1 minute, and 72℃ for 1 minute. We added 1 µL of purified PCR products to SNaPshot Ready Reaction mixture containing 0.15 pmol genotyping primer (5′-ASAGACGCGGCCCACCCCTC-3′) for primer extension reaction, which was conducted in three stages with 25 cycles of 96℃ for 10 seconds, 50℃ for 5 seconds, and 60℃ for 30 seconds. To eliminate excess fluorescent dye terminators, we added 1 unit of shrimp alkaline phosphatase (SAP) to the reaction product. The reaction was incubated at 37℃ for 1 hour and at 72℃ for 15 minutes. In addition, we added 9 µL of Hi-Di formamide to 1 µL of the reaction product, followed by incubation at 95℃ for 5 minutes. It was then placed on ice for 5 minutes. Lastly, the reaction was assessed using ABI Prism 3730xl DNA Analyzer (Applied Biosystems). The final results were analyzed using GeneScan analysis software (Applied Biosystems).

Adiponectin gene polymorphism

After extracting genomic DNA from the whole blood, SNaPshot and TaqMan method were used to analyze the genotypes of two adiponectin gene polymorphisms, SNP +45T>G (rs-2241766) and SNP +276G>T (rs1501299), respectively. The overall experiment methods were similar to those of the CAPN10. However, the following genotyping assay, namely TaqMan assay (Assay ID C_7497299_10), was employed for the detection of SNP +276G>T. In SNaPshot assay, the SNP +45T>G site was amplified using 5′-AGCACCCAGTCCTACCAGTG-3′ (Forward) and 5′-CTGGCTGGAGTTTGGAGAAG-3′ (Reverse), and we used 5′-ASAGACGCGGCCCACCCCTC-3′ as a primer.

Statistical analysis

A chi-square test was used to calculate P value for Hardy-Weinberg equilibrium in the control group. To analyze the correlation between basic information of subjects and diabetes, logistic regression analysis was performed for categorical variables to determine P value, odds ratio (OR), and 95% confidence interval (CI) were measured. For continuous variables, mean values of the DM patient group were compared to those of the control group by a t test. With regard to the correlation between 4-genes polymorphisms and diabetes, P value, OR and 95% CI were respectively measured in a diversity of models such as codominant, additive, dominant, and recessive model. These measurements were adjusted for age, sex, and BMI value. All statistical analyses were conducted using SAS version 9.1 (SAS Institute Inc., Cary, NC, USA).

RESULTS

Clinical characteristics of study subjects

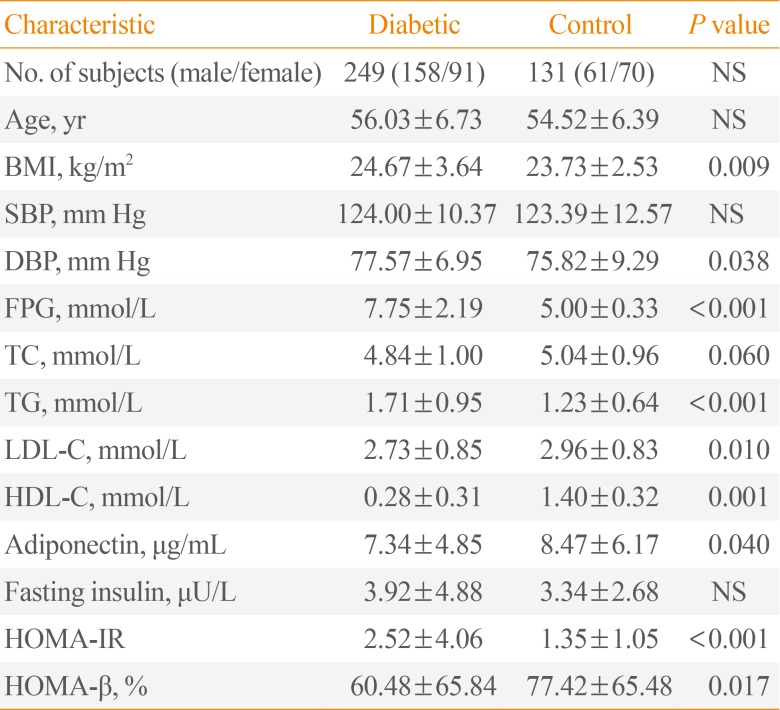
The genetic polymorphisms were evaluated in 249 patients with type 2 diabetes and 131 control subjects. Among 249 diabetes patients, there were 158 males and 91 females, and the mean age was 56 years. Mean diabetes duration was 7.8 years, and mean HbA1c was 8.2%. Two hundred and twenty out of 249 patients were taking oral hypoglycemic agents and 33 patients were on insulin. In the control group, there were 61 males and 70 females, with the mean age of 54 years. There were no statistically significant differences between the two groups with respect to age and gender. Higher BMI, diastolic pressure, and TG and lower HDL-C level was noted in the diabetes group compared to control group. Blood adiponectin level was significantly lower in diabetes group. IR calculated from HOMA-IR and insulin secreting capacity calculated from HOMA-β were all higher in diabetes group (Table 1).

Associations between SNPs in the adiponectin and CAPN10 gene and type 2 diabetes

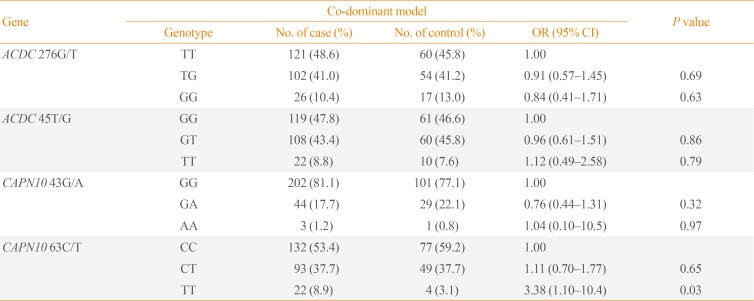
The genotype analysis was successfully conducted depending on each SNP of adiponectin and CAPN10 except two subjects in diabetes group and one subject in control group. For SNP at position 276 of adiponectin gene, subjects with TG and GG genotypes were less likely to have diabetes compared to those with TT genotype. For SNP at position 45 of adiponectin gene, those with GT genotype were less likely to have diabetes while those with TT were more prone to diabetes compared with subjects with GG genotype (Table 2). For SNP at position 43 of CAPN10 gene, subjects with GA were less likely to have diabetes compared with GG genotype while for SNP at position 63, those with TT genotypes were more likely to be diabetic compared with CC genotype with a statistical significance (Table 2).
With regard to two SNPs (276G/T, 45T/G) of adiponectin gene, whenever T was substituted to G in SNP 276G/T, diabetes risk decreased by 91%. In SNP 45T/G, G was dominant, and diabetes risk increased by 102% whenever G was substituted to T. For two SNPs (-43, -63) of CAPN10 gene, in SNP-43, diabetes risk decreased by 80% whenever G was substituted to A while in SNP-63, diabetes risk increased by 139% whenever C was substituted to T. However, these results were not statistically significant (Table 3).
We analyzed the prevalence of diabetes with regard to the dominant model of each gene. When assuming the prevalence of diabetes in TT genotype at SNP 276G/T of adiponectin gene to be 100%, that of TG+GG genotype was 89%. When assuming the diabetes prevalence with GG genotype in SNP 45T/G to be 100%, that of GT+TT genotype was 99%. In SNP-43 of CAPN10, when assuming the prevalence of diabetes in GG genotype to be 100%, that of the remaining GA+AA genotype was significantly low with 77%. In SNP-63, assuming that the prevalence of CC genotype is 100%, that of the remaining CT+TT genotype was 128% but not statistically significant (Table 3). In terms of recessive model of each gene, when assuming the prevalence of TT+TG genotype in SNP 276G/T of adiponectin gene to be 100%, that of GG genotype was 88%. When assuming the prevalence of GG+GT genotype in SNP 45T/G to be 100%, that of TT genotype was 114%. In SNP-43 of CAPN10, when the prevalence of GG+GA genotype is 100%, that of the remaining AA genotype was high as 110% but not statistically significant. On the other hand, in SNP-63, when the prevalence of CC+CT genotype is 100%, that of the remaining TT was significantly high as 323% (OR, 3.23; 95% CI, 1.06 to 9.79) (Table 3).
We applied dominant and recessive models to each gene polymorphism and analyzed the correlation between the models and each parameter. With regard to the recessive model with two substituents, fasting blood glucose levels in TT genotype of SNP-63 were 163.77±49.28 and significantly higher than those in TC+CC genotype (138.91±38.19). In SNP 276G/T, blood adiponectin levels in TT genotype were 5.08±2.64 and significantly lower than those in TG+GG genotype (7.57±4.97). For the dominant model, in SNP-43, fasting blood glucose levels in GG and GT+TT genotype were 143.70±42.19 and 130.33±25.44 respectively and the increased levels in GG genotype were meaningful. In SNP-63, blood insulin levels in CC genotype (3.27±2.83) were lower than those in CT+TT genotype (4.65±6.43). Similarly, HOMA-IR in CC genotype (20.34±23.07) was significantly lower than that in CT+TT genotype (30.77±53.73).

DISCUSSION

It has been known that several causes, mainly obesity, environmental factors and inherited metabolic disease, are engaged in type 2 diabetes [10]. Among diverse metabolic disorders, increased IR and IIS are considered the most critical pathogenetic factors in the development type 2 diabetes [67].
Prior cross-sectional and follow-up studies revealed that IR precedes IIS. That is, in early stages of diabetes, normal glucose tolerance is detected due to a complementary rise of insulin secretion to overcome IR. However, with a progressive decrease in insulin secretory capacity hyperglycemia is induced and finally heads to type 2 diabetes [9]. IR is caused by impaired insulin signaling in target organs and specifically associated with obesity. Indeed, it is considered that adipocytes are mediated by many proteins related to IR such as TNF-α, leptin, free fatty acid, and angiotensinogen [1213]. Adiponectin is also related to cardiovascular disease and its blood concentration declined in patients with obesity and type 2 DM [89]. Accordingly, adiponectin increases insulin sensitivity and shows an anti-atherosclerotic effect applied directly to blood vessels. Moreover, adiponectin administration reduces blood glucose levels and improves lipid metabolism. Adiponectin gene is located in chromosome 3q27 and consists of three exons and two introns. It has been reported that SNPs such as a silent T to G substitution (+45T>G) in exon 2 and a G to T substitution (+276G>T) in intron 2 are related to reduced blood adiponectin levels, IR and type 2 DM [14].
CAPN10 gene has been recently reported as a critical factor of IIS. It is located in chromosome 2q37 and expressed to glycoproteins with 672 amino acids, which belong to the calpain family of calcium-dependent intracellular cysteine proteases [415]. This protein is a neutral protease activated by calcium ions and resides in the cytosol in an inactivated form. However, with increased intracellular calcium levels, it is transported to the cell membrane and then activated there. CAPN10 mRNA is expressed in various tissues in human body including pancreatic islets, muscle and liver, which are three most important tissues controlling glucose homeostasis. Thus, although its exact mechanism is not known, it is suggested that CAPN10 is involved in insulin secretion of pancreatic β-cells possibly by regulating exocytosis in pancreatic β-cells [5616] as well as insulin action and hepatic glucose production [17]. Moreover, 14 calpain isoenzymes and their encoding genes have been identified up to now, and the CAPN10 gene among them is currently highlighted in terms of obesity and diabetes. More importantly, it has been revealed that combinations of SNPs (SNP-44, -43, -19, and -63) located mainly in the intron of CAPN10 gene are associated with the prevalence of diabetes [151819]. In the present study, based on prior studies that investigated the relationship between combinations of SNPs (SNP-43, -19, and -63) and diabetes in Koreans, we conducted genetic analysis for SNP-43 and -63, as well as for SNP-45 and -276 of adiponectin gene to elucidate whether these SNPs increase diabetes as well.
In this study, subjects with TT genotype in SNP-63 of CAPN10 gene were significantly more likely to have diabetes but other SNPs were not associated with diabetes. Previous studies show conflicting results regarding CAPN10 polymorphism and the risk of type 2 DM. For example, a case-control study conducted with Tunisians showed that only certain haplotype combinations of SNPs (SNP-43, -19, and -63) and not a single SNP was related to diabetes [20]. However, other studies showed a single genotype to be associated with type 2 diabetes. A study conducted in British/Irish population reported that a single genotype in SNP-44 of CAPN10 was related to type 2 diabetes but not SNP-43, -19, and -63 [417]. Also, studies in Mexican and Indian populations showed diverse associations [2122], suggesting an ethnic difference in the association between CAPN10 polymorphism and diabetes among different populations [23].
Meanwhile, plasma levels of adiponectin secreted in adipocytes were significantly higher in control group compared to diabetes group. Adiponectin increases insulin sensitivity by augmenting fatty acid oxidation in muscles and reducing gluconeogenesis in the liver [1722]. These adiponectin effects are known to be attributed to activation of 5`adenosine monophosphate-activated protein activated protein kinase which is a key enzyme involved in fatty acid oxidation and glucose intake in muscles and gluconeogenesis in the liver [24]. In addition, it was reported that SNPs of adiponectin gene, including a T to G substitution (T45G) in exon 2 and a G to T substitution (G276T) in intron 2, were related to the components of type 2 diabetes and IR syndrome, and this relation was mediated by reduced plasma levels of adiponectin [25]. In this context, on the assumption that adiponectin gene polymorphisms, or furthermore certain genes, may be associated with metabolic parameters, we conducted a genetic analysis expecting the synergistic effect of the genes and the CAPN10 gene on metabolic parameters [26]. However, the relation between certain genetic variants in both SNP-45 and -276 of adiponectin gene and metabolic disorders was not confirmed. On the other hand, given that results varied depending on race in previous studies similarly to those performed in Korea, our results correspond partially to some reports that both SNP-45 and -276 are less related to metabolic disorders.
In the present study, although exploring the correlation between CAPN10, as well as adiponectin and glucose metabolism, and expecting the synergic effect between the key SNP genotype combinations, we could not demonstrate the synergic effect because no SNPs other than SNP-63, showed statistically significant correlations with type 2 diabetes or metabolic parameters as a single genotype [272829]. When parameters were compared according to each gene polymorphism limited only in the diabetes group, there were a great number of meaningful results. In 45T/G polymorphism of adiponectin gene, significant differences were not found. On the contrary, for 276G/T polymorphism, adiponectin was significantly reduced in the TT genotype group that G was substituted to T. This result is in accordance with the findings of prior studies that a G to T substitution of adiponectin gene led to reduced adiponectin and thus was closely connected to metabolic disorders [3031]. For SNP-43 of CAPN10 gene, fasting blood glucose levels were higher in GG genotype, compared to GA+GG, genotype, and this result corresponds to that of a prior study that GG genotype contributes to the development of type 2 diabetes by increasing IR [32]. For SNP-63, there was significant difference between the diabetes and control group. Low fasting blood insulin levels and HOMA-IR were observed in CC genotype even in the group limited diabetes patients. Accordingly, these results suggested that a C to T substitution in the CC dominant type increased blood insulin levels and IR, thereby it was more closely associated with type 2 diabetes.
Our study has several limitations. First, many diabetes patients were taking lipid lowering or antihypertensive drug as well as oral hypoglycemic drugs. These drugs could have affected insulin secretory function as well as IR and blood adiponectin level [3031]. Also, this has led to control subjects having higher LDL-C compared with diabetes group. Secondly, the family history of diabetes was not assessed in this study. It very important especially among the control subjects in terms of a genetic predisposition to the future development of diabetes. Moreover, the study was conducted with relatively small number of subjects. A further larger scale study should be conducted to confirm the relationship between adiponectin and CAPN10 gene polymorphism and type 2 diabetes in Korea as well as to elucidate the underlying mechanism explaining the effect of genetic polymorphism on diabetes and metabolic derangements.

ACKNOWLEDGMENTS

The study was supported by a faculty research grant of Yonsei University College of Medicine (6-2009-0059).

Notes

CONFLICTS OF INTEREST: No potential conflict of interest relevant to this article was reported.

AUTHOR CONTRIBUTIONS: Conception or design: J.W.H., C.W.A. Acquisition, analysis, or interpretation of data: J.S.N., J.W.H., M.J.K., S.K., J.S.P. Drafting the work or revising: J.S.N., S.B.L., J.H.Y. Final approval of the manuscript: C.W.A.

References

1. Kim WY, Kim JE, Choi YJ, Huh KB. Nutritional risk and metabolic syndrome in Korean type 2 diabetes mellitus. Asia Pac J Clin Nutr. 2008; 17(Suppl 1):47–51. PMID: 18296299.
2. Stumvoll M, Goldstein BJ, van Haeften TW. Type 2 diabetes: principles of pathogenesis and therapy. Lancet. 2005; 365:1333–1346. PMID: 15823385.
crossref
3. Kifagi C, Makni K, Mnif F, Boudawara M, Hamza N, Rekik N, et al. Association of calpain-10 polymorphisms with type 2 diabetes in the Tunisian population. Diabetes Metab. 2008; 34:273–278. PMID: 18487065.
crossref
4. Evans JC, Frayling TM, Cassell PG, Saker PJ, Hitman GA, Walker M, et al. Studies of association between the gene for calpain-10 and type 2 diabetes mellitus in the United Kingdom. Am J Hum Genet. 2001; 69:544–552. PMID: 11481585.
crossref
5. Fingerlin TE, Erdos MR, Watanabe RM, Wiles KR, Stringham HM, Mohlke KL, et al. Variation in three single nucleotide polymorphisms in the calpain-10 gene not associated with type 2 diabetes in a large Finnish cohort. Diabetes. 2002; 51:1644–1648. PMID: 11978669.
crossref
6. Elbein SC, Chu W, Ren Q, Hemphill C, Schay J, Cox NJ, et al. Role of calpain-10 gene variants in familial type 2 diabetes in Caucasians. J Clin Endocrinol Metab. 2002; 87:650–654. PMID: 11836299.
crossref
7. Chandran M, Phillips SA, Ciaraldi T, Henry RR. Adiponectin: more than just another fat cell hormone? Diabetes Care. 2003; 26:2442–2450. PMID: 12882876.
crossref
8. Hara K, Boutin P, Mori Y, Tobe K, Dina C, Yasuda K, et al. Genetic variation in the gene encoding adiponectin is associated with an increased risk of type 2 diabetes in the Japanese population. Diabetes. 2002; 51:536–540. PMID: 11812766.
crossref
9. Kondo H, Shimomura I, Matsukawa Y, Kumada M, Takahashi M, Matsuda M, et al. Association of adiponectin mutation with type 2 diabetes: a candidate gene for the insulin resistance syndrome. Diabetes. 2002; 51:2325–2328. PMID: 12086969.
10. Song KE, Kim DJ, Park JW, Cho HK, Lee KW, Huh KB. Clinical characteristics of Korean type 2 diabetic patients according to insulin secretion and insulin resistance. J Korean Diabetes Assoc. 2007; 31:123–129.
crossref
11. Kim MJ, Yoo KH, Park HS, Chung SM, Jin CJ, Lee Y, et al. Plasma adiponectin and insulin resistance in Korean type 2 diabetes mellitus. Yonsei Med J. 2005; 46:42–50. PMID: 15744804.
crossref
12. Lee YY, Lee NS, Cho YM, Moon MK, Jung HS, Park YJ, et al. Genetic association study of adiponectin polymorphisms with risk of type 2 diabetes mellitus in Korean population. Diabet Med. 2005; 22:569–575. PMID: 15842511.
crossref
13. Li LL, Kang XL, Ran XJ, Wang Y, Wang CH, Huang L, et al. Associations between 45T/G polymorphism of the adiponectin gene and plasma adiponectin levels with type 2 diabetes. Clin Exp Pharmacol Physiol. 2007; 34:1287–1290. PMID: 17973869.
crossref
14. Bacci S, Menzaghi C, Ercolino T, Ma X, Rauseo A, Salvemini L, et al. The +276 G/T single nucleotide polymorphism of the adiponectin gene is associated with coronary artery disease in type 2 diabetic patients. Diabetes Care. 2004; 27:2015–2020. PMID: 15277433.
crossref
15. Yang WS, Yang YC, Chen CL, Wu IL, Lu JY, Lu FH, et al. Adiponectin SNP276 is associated with obesity, the metabolic syndrome, and diabetes in the elderly. Am J Clin Nutr. 2007; 86:509–513. PMID: 17684226.
crossref
16. Marshall C, Hitman GA, Partridge CJ, Clark A, Ma H, Shearer TR, et al. Evidence that an isoform of calpain-10 is a regulator of exocytosis in pancreatic beta-cells. Mol Endocrinol. 2005; 19:213–224. PMID: 15471947.
17. Horikawa Y. Calpain-10 (NIDDM1) as a susceptibility gene for common type 2 diabetes. Endocr J. 2006; 53:567–576. PMID: 16873988.
crossref
18. Song Y, You NC, Hsu YH, Sul J, Wang L, Tinker L, et al. Common genetic variation in calpain-10 gene (CAPN10) and diabetes risk in a multi-ethnic cohort of American postmenopausal women. Hum Mol Genet. 2007; 16:2960–2971. PMID: 17855447.
crossref
19. Chen SF, Lu XF, Yan WL, Huang JF, Gu DF. Variations in the calpain-10 gene are associated with the risk of type 2 diabetes and hypertension in northern Han Chinese population. Chin Med J (Engl). 2007; 120:2218–2223. PMID: 18167206.
crossref
20. Ezzidi I, Turki A, Messaoudi S, Chaieb M, Kacem M, Al-Khateeb GM, et al. Common polymorphisms of calpain-10 and the risk of type 2 diabetes in a Tunisian Arab population: a case-control study. BMC Med Genet. 2010; 11:75. PMID: 20470430.
crossref
21. del Bosque-Plata L, Aguilar-Salinas CA, Tusie-Luna MT, Ramirez-Jimenez S, Rodriguez-Torres M, Auron-Gomez M, et al. Association of the calpain-10 gene with type 2 diabetes mellitus in a Mexican population. Mol Genet Metab. 2004; 81:122–126. PMID: 14741193.
crossref
22. Cassell PG, Jackson AE, North BV, Evans JC, Syndercombe-Court D, Phillips C, et al. Haplotype combinations of calpain 10 gene polymorphisms associate with increased risk of impaired glucose tolerance and type 2 diabetes in South Indians. Diabetes. 2002; 51:1622–1628. PMID: 11978665.
crossref
23. Picos-Cardenas VJ, Sainz-Gonzalez E, Miliar-Garcia A, Romero-Zazueta A, Quintero-Osuna R, Leal-Ugarte E, et al. Calpain-10 gene polymorphisms and risk of type 2 diabetes mellitus in Mexican mestizos. Genet Mol Res. 2015; 14:2205–2215. PMID: 25867367.
24. Chen Y, Kittles R, Zhou J, Chen G, Adeyemo A, Panguluri RK, et al. Calpain-10 gene polymorphisms and type 2 diabetes in West Africans: the Africa America Diabetes Mellitus (AADM) Study. Ann Epidemiol. 2005; 15:153–159. PMID: 15652721.
crossref
25. Cox NJ, Hayes MG, Roe CA, Tsuchiya T, Bell GI. Linkage of calpain 10 to type 2 diabetes: the biological rationale. Diabetes. 2004; 53(Suppl 1):S19–S25. PMID: 14749261.
26. Daimon M, Oizumi T, Saitoh T, Kameda W, Yamaguchi H, Ohnuma H, et al. Calpain 10 gene polymorphisms are related, not to type 2 diabetes, but to increased serum cholesterol in Japanese. Diabetes Res Clin Pract. 2002; 56:147–152. PMID: 11891023.
crossref
27. Friedewald WT, Levy RI, Fredrickson DS. Estimation of the concentration of low-density lipoprotein cholesterol in plasma, without use of the preparative ultracentrifuge. Clin Chem. 1972; 18:499–502. PMID: 4337382.
crossref
28. Hanis CL, Boerwinkle E, Chakraborty R, Ellsworth DL, Concannon P, Stirling B, et al. A genome-wide search for human non-insulin-dependent (type 2) diabetes genes reveals a major susceptibility locus on chromosome 2. Nat Genet. 1996; 13:161–166. PMID: 8640221.
crossref
29. Horikawa Y, Oda N, Cox NJ, Li X, Orho-Melander M, Hara M, et al. Genetic variation in the gene encoding calpain-10 is associated with type 2 diabetes mellitus. Nat Genet. 2000; 26:163–175. PMID: 11017071.
crossref
30. Yu SY, Ryu HK, Park HJ, Choi YJ, Huh KB, Kim WY. Adiponectin gene SNP 276G → T, nutrient intakes, and cardiovascular disease risk in Korean type 2 DM patients. Nutr Res Pract. 2007; 1:363–370. PMID: 20368963.
crossref
31. Zacharova J, Chiasson JL, Laakso M. STOP-NIDDM Study Group. The common polymorphisms (single nucleotide polymorphism [SNP] +45 and SNP +276) of the adiponectin gene predict the conversion from impaired glucose tolerance to type 2 diabetes: the STOP-NIDDM trial. Diabetes. 2005; 54:893–899. PMID: 15734870.
32. Tripathy D, Eriksson KF, Orho-Melander M, Fredriksson J, Ahlqvist G, Groop L. Parallel manifestation of insulin resistance and beta cell decompensation is compatible with a common defect in type 2 diabetes. Diabetologia. 2004; 47:782–793. PMID: 15114470.
crossref
Table 1

Clinical Characteristics of the Study Population

enm-33-364-i001
Characteristic Diabetic Control P value
No. of subjects (male/female) 249 (158/91) 131 (61/70) NS
Age, yr 56.03±6.73 54.52±6.39 NS
BMI, kg/m2 24.67±3.64 23.73±2.53 0.009
SBP, mm Hg 124.00±10.37 123.39±12.57 NS
DBP, mm Hg 77.57±6.95 75.82±9.29 0.038
FPG, mmol/L 7.75±2.19 5.00±0.33 <0.001
TC, mmol/L 4.84±1.00 5.04±0.96 0.060
TG, mmol/L 1.71±0.95 1.23±0.64 <0.001
LDL-C, mmol/L 2.73±0.85 2.96±0.83 0.010
HDL-C, mmol/L 0.28±0.31 1.40±0.32 0.001
Adiponectin, μg/mL 7.34±4.85 8.47±6.17 0.040
Fasting insulin, μU/L 3.92±4.88 3.34±2.68 NS
HOMA-IR 2.52±4.06 1.35±1.05 <0.001
HOMA-β, % 60.48±65.84 77.42±65.48 0.017

Values are expressed as mean±SD.

NS, not significant; BMI, body mass index; SBP, systolic blood pressure; DBP, diastolic blood pressure; FPG, fasting plasma glucose; TC, total cholesterol; TG, triglyceride; LDL-C, low density lipoprotein cholesterol; HDL-C, high density lipoprotein cholesterol; HOMA-IR, homeostasis model assessment of insulin resistance; HOMA-β, homeostasis model assessment of β-cell function.

Table 2

Association between Adiponectin and CAPN10 Gene Polymorphisms and Type 2 Diabetes

enm-33-364-i002
Gene Genotype No. of case (%) No. of control (%) OR (95% CI) P value
ACDC 276G/T TT 121 (48.6) 60 (45.8) 1.00
TG 102 (41.0) 54 (41.2) 0.91 (0.57–1.45) 0.69
GG 26 (10.4) 17 (13.0) 0.84 (0.41–1.71) 0.63
ACDC 45T/G GG 119 (47.8) 61 (46.6) 1.00
GT 108 (43.4) 60 (45.8) 0.96 (0.61–1.51) 0.86
TT 22 (8.8) 10 (7.6) 1.12 (0.49–2.58) 0.79
CAPN10 43G/A GG 202 (81.1) 101 (77.1) 1.00
GA 44 (17.7) 29 (22.1) 0.76 (0.44–1.31) 0.32
AA 3 (1.2) 1 (0.8) 1.04 (0.10–10.5) 0.97
CAPN10 63C/T CC 132 (53.4) 77 (59.2) 1.00
CT 93 (37.7) 49 (37.7) 1.11 (0.70–1.77) 0.65
TT 22 (8.9) 4 (3.1) 3.38 (1.10–10.4) 0.03

Adjusted for age and gender.

CAPN1, calpain-10; OR, odds ratio; CI, confidence interval; ACDC, adiponectin.

Table 3

Association between Dominant, Recessive Polymorphisms Model and Type 2 Diabetes

enm-33-364-i003
Gene Additive model Dominant model OR (95% CI) Recessive model OR (95% CI)
Genotype OR (95% CI) P value Genotype Dominant model OR (95% CI) P value Genotype Recessive model OR (95% CI) P value
ACDC 276G/T TT 0.91 (0.66–1.26) 0.58 TT 1.00 TT+TG 1.00
TG+GG 1.00 TG+GG 0.89 (0.58–1.39) 0.61 GG 0.88 (0.45–1.72) 0.71
ACDC 45T/G GG 1.02 (0.72–1.43) 0.93 GG 1.00 GG+GT 1.00
GT+TT 1.00 GT+TT 0.99 (0.64–1.52) 0.94 TT 1.14 (0.51–2.55) 0.74
CAPN10 43G/A GG 0.80 (0.49–1.31) 0.38 GG 1.00 GG+GA 1.00
GA+AA 1.00 GA+AA 0.77 (0.45–1.31) 0.34 AA 1.10 (0.11–11.1) 0.94
CAPN10 63C/T CC 1.39 (0.96–2.00) 0.08 CC 1.00 CC+CT 1.00
CT+TT 1.00 CT+TT 1.28 (0.82–3.01) 0.27 TT 3.23 (1.06–9.79) 0.04

Adjusted for age and gender.

OR, odds ratio; CI, confidence interval; ACDC, adiponectin; CAPN10, calpain-10.

TOOLS
Similar articles