

 ePub
ePub Citation
 Print
Print


INTRODUCTION
White spot lesions (WSLs) are one of the most common problems associated with orthodontic treatment.12 Fixed orthodontic appliances lead to cleansing difficulties, which result in plaque accumulation and an increased risk for WSLs.1 With regard to the incidence and severity of WSLs after orthodontic treatment with fixed appliances, a previous study found significantly more decalcified areas on teeth with fixed appliances, while the labiogingival region of the maxillary lateral incisors showed the highest incidence of WSLs.2
In some cases, WSLs that develop during orthodontic treatment spontaneously disappear after removal of the fixed appliance. However, most of them remain as permanent lesions and cause esthetic and functional impairments.3 Therefore, interventions such as fluoride application, remineralization using casein phosphopeptide amorphous calcium phosphate complexes, resin infiltration, and microabrasion have been proposed.45678
Despite the invaluable results of previous studies, scientific evidence supporting various methods for the management of WSLs is still lacking,4 and till date, there is no gold standard treatment method for WSLs. While measures for remineralization of these lesions have been the primary focus, esthetic improvements associated with the treatment have been less frequently investigated. However, the esthetic aspect cannot be neglected, because many patients with WSLs are not satisfied with remineralization treatment alone and desire further esthetic improvement. In this regard, external teeth bleaching has been discussed as a potential solution for improving the esthetics of WSLs.910
When external bleaching is selected for improving the esthetics of WSLs, the decrease in the microhardness of sound and demineralized enamel surfaces after bleaching must not be overlooked.11 Even though a previous study has reported that bleaching does not significantly increase the depth of the demineralization area in teeth with early artificial caries,12 some researchers recommended that fluoridation should be performed during the bleaching therapy in order to enhance remineralization of the bleached teeth, and that a daily fluoridation regimen involving the application 0.05% sodium fluoride (NaF) solution is necessary.1314
To the best of our knowledge, the effect of external bleaching and fluoridation on the color of WSLs has not been clearly established. Thus, the aim of the present in-vitro study was to investigate the effects of tooth bleaching with or without fluoridation on the esthetics of WSLs via the evaluation of colorimetric values using a spectroradiometer (SR) and digital images (DIs).
MATERIALS AND METHODS
Sample preparation
Enamel blocks measuring 8 × 8 mm were cut from bovine incisors without any caries, enamel defects, or stains. A total of 125 bovine enamel blocks were embedded in plastic cells filled with acrylic resin.
Maxillary lateral incisor brackets with 0.022-inch slot (Tomy International Inc., Tokyo, Japan) were bonded to the enamel blocks using Transbond XT adhesive (3M Unitek, Monrovia, CA, USA). Etching gel was not used to prevent increased enamel demineralization and bond strengthening, which could lead to difficulty during bracket removal and alter the appearance of the tooth surface.15 The bracket slots were positioned 3 mm from the incisal margin of the enamel blocks and centered in the mesiodistal dimension. For the induction of artificial WSLs only at the gingival aspect of the bracket, the incisal area was covered with two layers of acid-resistant nail varnish (Figure 1).
The demineralizing gel was prepared by the slow addition of 6% (w/v) hydroxyethyl cellulose to a 50 mM lactic acid solution (pH 4.5).16 Then, each sample was immersed in a 50 mL plastic tube containing 5 mL of demineralization gel. All tubes were stored in an incubator (KIN-072; Kukje ENG Co., Goyang, Korea) set at a temperature of 37℃. After 7 days, the brackets were debonded, and any adhesive remnants were cautiously removed using a low-speed round carbide bur under copious water irrigation. The varnish was removed using acetone, and the specimens were washed in distilled deionized water for 2 minutes.
Treatment procedures
The samples were randomly divided into five groups (n = 25). In group 1 (control), the samples were immersed in artificial saliva (2.200 g/L of gastric mucin, 0.381 g/L of sodium chloride, 0.213 g/L of calcium chloride dihydrate, 0.738 g/L of dipotassium phosphate, and 1.114 g/L of potassium chloride; pH was adjusted to 7.00 with 85% lactic acid)17 and stored in an incubator at 37℃. In group 2 (home bleaching), 15% carbamide peroxide gel (Opalescence PF Regular; Ultradent Products, Inc., South Jordan, UT, USA) was applied on the enamel surface for 4 hours, followed by washing with distilled deionized water and gentle drying. The procedure was repeated daily for 3 weeks. In group 3 (home bleaching + NaF), the same procedure used in group 2 was repeated, with additional immersion in 0.05% NaF solution for 5 minutes per day for 3 weeks. In group 4 (in-office bleaching), external tooth bleaching using 40% hydrogen peroxide gel (Opalescence Boost PF Regular; Ultradent Products, Inc.) was performed for 40 minutes in accordance with the manufacturer's instructions. This treatment was repeated three times at 1-week intervals. In group 5 (in-office bleaching + NaF), the same procedure used in group 4 was performed, with an additional daily 5-minute fluoridation regimen involving the application of 0.05% NaF solution for 3 weeks.
All procedures were implemented by a single dentist. When the samples were not under treatment, they were immersed in artificial saliva and placed in an incubator at 37℃. The NaF solution and artificial saliva were changed once every week.
Spectroradiometer analysis
All specimens were subjected to color measurements using SR (PR-670; Spectrascan, Photo Research Inc., Syracuse, NY, USA). A circular area measuring 6 mm in diameter covering both sound enamel and WSL areas was used for measurement on each block (Figure 1A). The measurements were taken at three time points: before WSL formation (T1), after WSL formation (T2), and after completion of the tooth bleaching treatment (T3).
Commission Internationale l'Eclairage color values (CIE L*a*b*; L*: 100 = white, 0 = black; a*: +a = red, −a = green; b*: +b = yellow, −b = blue)18 for each specimen were recorded using SR. The color change between T1 and T2 (ΔE*SRT1T2) was calculated as follows: ΔE*SRT1T2 = [(L*T1 − L*T2)2 + (a*T1 − a*T2)2 + (b*T1 − b*T2)2]1/2. The identical formula was applied to calculate the color change between T2 and T3 (ΔE*SRT2T3) and between T1 and T3 (ΔE*SRT1T3).
Digital image analysis
A digital camera (EOS 100D; Canon, Tokyo, Japan) with a 100-mm macro lens (Canon) was used to obtain DIs of the enamel blocks. All samples were photographed in a dark room under a manual camera setting (aperture, f5.6; shutter speed, 1/125s; ISO sensitivity, 400). The photographic procedure was standardized by mounting the camera on a rigid copystand at a distance of 38 cm from the enamel surface. The light source consisted of two lamps set at a 45° angle to the axis of the lens. All photographs were obtained at T1, T2, and T3.
The CIE L*a*b* values were acquired for sound enamel (P1) and WSL areas (P2) using Photoshop (Adobe Systems, San Jose, CA, USA; Figure 1B), which enabled the direct comparison of color differences between P1 and P2. P1 and P2 were positioned 1.5 mm from the incisal and gingival margins of the enamel blocks and mesiodistally centered. The color difference (ΔE*DI) between P1 and P2 was calculated as follows: ΔE*DI = [(L*P1 − L*P2)2 + (a*P1 − a*P2)2 + (b*P1 − b*P2)2]1/2.
Statistical analyses
All statistical analyses were performed using SPSS (IBM SPSS Statistics for Windows, version 22.0; IBM Co., Armonk, NY, USA), with a significance level of α = 0.05. Differences in SR-based color changes (ΔE*SR) were compared among the five groups using analysis of variance (ANOVA) and Tukey's post-hoc tests.
SR-based L*, a*, and b* values and ΔE*DI were analyzed using two-way repeated-measures ANOVA with Greenhouse–Geisser correction, and Bonferroni-corrected pairwise group comparisons were performed.
RESULTS
Spectroradiometer analysis
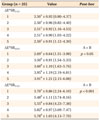
Table 1 shows the mean color changes (ΔE*SR) among the different time points (T1, T2, and T3). The color change after bleaching (ΔE*SRT2T3) was significantly greater in the treatment groups than in the control group (p < 0.05), and the overall color change from T1 to T3 (ΔE*SRT1T3) was significantly lesser in group 1 than in the other groups (p < 0.001).
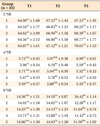
At T1 and T2, there were no significant differences in the mean lightness (L*) values among the five groups. The mean L* value increased significantly at T2 in all groups (Table 2), with a further increase at T3. The control group showed no significant changes in these values.
The mean redness (+a*) value significantly increased from T1 to T2 in all groups (p < 0.001), followed by a significantly decrease at T3 in all groups except group 1.
The mean yellowness (+b*) value decreased from T2 to T3 in all groups except group 1, in which it exhibited an increase (p < 0.001).
Digital image analysis
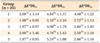
Table 3 shows the results of DI analysis. At T1, the DI-based color difference (ΔE*DIT1) demonstrated no significant difference among the five groups, while it significantly increased from T1 to T2 in all groups (p < 0.001) and significantly decreased from T2 to T3 in all treatment groups (p < 0.001), with an insignificant decrease in the control group. No significant differences in ΔE*DIT3 were shown between the four treatment groups (p > 0.05).
DISCUSSION
WSLs remain to be a serious side effect despite efforts by clinicians to prevent them. Tooth bleaching has been proposed as a possible solution to these problems.910
As per the SR analysis conducted in the present study, the mean lightness (L*) and redness (+a*) values were significantly higher after WSL formation (T2) than before WSL formation (T1) in all groups; this indicated that the formation of WSLs led to an increase in the overall lightness and redness of the enamel surface. The increase in L* values was in agreement with the findings in a previous study, where the formation of WSLs increased L* values measured using a spectrophotometer.6
We also found that SR-based L* values and a* and b* values were significantly higher and lower, respectively, after external tooth bleaching; this indicated that bleaching significantly improved the lightness (L*), redness (+a*), and yellowness (+b*) properties of the teeth, as observed in previous studies.919
As per DI analysis, the color difference between sound enamel and WSL areas (ΔE*DI) at T1 was similar in all groups, while the difference at T2 was significantly more distinct than that at T1. After external bleaching treatment, the mean ΔE*DI showed no significant change in the control group, while the treatment groups showed significant decreases. The bleaching method and use of fluoridation did not influence the results, which were similar to the SR-based results.
In the present study, there was no conclusive evidence that the bleaching method, i.e., home bleaching or in-office bleaching, influenced the lightness change. This result was in agreement with those of previous studies2021 evaluating the two bleaching methods. In one study, tooth whitening was initially faster with a high concentration of the bleaching gel; however, the efficacy obtained with a lower concentration was similar to that obtained with a higher concentration when the treatment time was extended.21
According to previous reports concerning color changes, a color difference is said to be clinically visible when the ΔE value is higher than 3.7.22 Although the data is not shown, at T3, 20 samples (80%) in the control group exhibited a visible and clinically acceptable color difference (3.7 ≤ ΔE*DI < 6.8), while ≥ 20 samples in the four treatment groups showed an invisible and clinically perceptible color difference (ΔE*DI < 3.7). This distinct trend in ΔE*DI values at T3 indicates that the bleaching therapy induced better color matching between the sound enamel and WSL areas. This finding is also in agreement with those in previous studies, which stated that bleaching therapy may improve the conspicuous appearance of WSLs or blemished surfaces associated with fluorosis.910
With regard to the concern that bleaching may weaken a decalcified tooth surface, a study concluded that bleaching treatments did not significantly increase the total demineralization area in teeth with early artificial caries.12 Another study also concluded that bleaching reduced color differences between sound and carious enamel without causing adverse effects on the mineral composition or microhardness.5 In contrast, other studies have found reduced microhardness and increased susceptibility to caries-like lesions in bleached teeth.1123 In this regard, a review proposed the daily use of 0.05% NaF mouth rinses in order to reduce the prevalence and severity of WSLs.24 Another study also recommended that fluoridation should be performed during and after bleaching therapy in order to enhance remineralization of the bleached teeth.25 However, literature for evaluating whether fluoridation undermines the esthetic effects of bleaching treatment remains limited. Thus, we attempted to evaluate the effects of fluoridation on the tooth esthetics after bleaching, and the results showed that fluoridation did not influence the degree of esthetic improvement. Therefore, we recommend that clinicians apply fluoride during bleaching treatment for WSLs without the concern about reduced esthetic effects.
The evaluation of tooth color is possible via a number of methods, including visual assessment with shade guides, spectrophotometry, colorimetry, and computer analysis of DIs. These methods have been successfully employed to measure longitudinal tooth color changes following dental bleaching procedures.26 Two different methods of color determination (SR measurement and DI analysis) were chosen for this study. Color measurement using SR enables the observer to directly determine the tooth surface color, which is considered to be advantageous over DI analysis. However, SR measurements have window size limitations with regard to color determination. It has been found that the L*a*b* color coordinates tend to shift toward green and blue and lesser brightness relative to that of the actual color coordinates beneath a window diameter of < 5 mm.27 Therefore, SR was used to measure the color of the entire sound enamel and WSL areas, while DI analysis was used to measure smaller sound enamel and WSL areas.
The main limitation of this study was its in-vitro design, whereby the actual oral environment cannot be reproduced but materials and techniques can be assessed. For simulation of the clinical conditions during orthodontic treatment of teeth, artificial WSLs were induced at the gingival aspects of enamel blocks, because this is a common site of involvement.28 Moreover, WSLs were induced on bracket-bonded enamel surfaces in order to investigate colorimetric properties similar to those for teeth receiving orthodontic treatment.
Statistical analysis of data obtained in the present study revealed a significant improvement in esthetics after bleaching treatment, regardless of fluoridation. However, for clinical application, it must be remembered that these results are based on an in-vitro experimental model that did not include complex intraoral conditions such as bacterial biofilms, enzyme systems, and natural saliva.28
Finally, the results reported in the present study are focused on the esthetic aspects of WSLs rather than the mechanical aspects such as surface microhardness, remineralization capacity, and surface smoothness. Mechanical aspects are just as important as esthetic aspects; therefore, the clinical application of tooth bleaching for teeth with WSLs is a challenge. Further in-vitro and in-vivo studies assessing the mechanical aspects as well are necessary before clinical application.
CONCLUSION
The findings of our study suggest that external home or in-office tooth bleaching with or without fluoridation can improve the esthetics of WSLs, as indicated by the decreased color difference between sound enamel and WSL areas after bleaching. The use of fluoride application during bleaching treatment may enhance remineralization of the bleached teeth without undermining the effects of bleaching.

 XML Download