

 ePub
ePub Citation
 Print
Print


INTRODUCTION
Facial asymmetry frequently coexists with skeletal Class III malocclusion1234 and is closely correlated with the perception of beauty.5 The number of patients with facial asymmetry has been increasing,6 as has the complexity of this condition. Accordingly, more accurate diagnosis and treatment planning are essential for its management.
In patients with facial asymmetry, dental compensation for the maintenance of occlusal function occurs in the transverse direction as well as anteroposterior and vertical directions.7 Accordingly, camouflage orthodontic treatment should be planned to compensate for the skeletal discrepancy in the occlusal relationship. Therefore, it is necessary to evaluate the dental compensation pattern in patients with Class III malocclusion and facial asymmetry, and the treatment modality for the camouflage should be selected after considering the amount of dental compensation and the periodontal condition. In addition, the pattern of dental compensation should be carefully analyzed in patients with facial asymmetry who are scheduled to undergo orthodontic treatment combined with orthognathic surgery. Sufficient elimination of dental compensation would provide more accurate repositioning of the mandible and result in successful correction of the facial asymmetry and occlusion.8910
Conventionally, facial asymmetry and dental compensation have been assessed on posteroanterior (PA) cephalograms.1112 However, this method has some limitations such as the superimposition of anatomical structures and the magnification and distortion of images.13 Furthermore, measurements on PA cephalograms could be affected by the head orientation.14 In order to overcome these limitations, several recent studies15161718 have analyzed dental compensation using cone-beam computed tomography (CBCT). In these studies, the Frankfort horizontal (FH) plane151617 or the frontozygomatic suture plane18 was used as the reference plane for evaluating the maxillary dental compensation. However, because the maxilla is moved during orthognathic surgery, it is necessary to evaluate dental compensation relative to the maxillary basal bone. Moreover, because maxillary canting can exist and occasionally occur in the opposite direction from the menton deviation,1920 the abovementioned planes cannot be used as the maxillary reference plane. Therefore, the maxillary dental compensation pattern in reference to the maxillary basal bone and the correlations between maxillary canting and transverse dental compensation need to be evaluated. In addition, most previous studies have focused only on the correlation between dental compensation and menton deviation, and few have assessed the correlation with other skeletal asymmetry variables.
From the above perspectives, we designed the present study to analyze the transverse dental compensation relative to the maxillary and mandibular basal bones using CBCT and investigate the correlations between skeletal measurements in the frontal plane, such as maxillary and mandibular canting and ramus inclination, and menton deviation, as well as the correlations between transverse dental compensation and skeletal asymmetry variables, in patients with skeletal Class III malocclusion and facial asymmetry.
MATERIALS AND METHODS
Subjects
In total, 30 (16 men and 14 women; mean age, 21.13 ± 2.87 years; mean ANB, −2.56° ± 2.30°) patients who had undergone CBCT for orthodontic diagnosis at Wonkwang University Dental Hospital (Iksan and Daejeon, Korea) between January 2013 and February 2017 were enrolled (asymmetry group). In addition, 30 students (15 men and 15 women; mean age, 23.40 ± 3.94 years; mean ANB, 2.28° ± 1.50°) of the Wonkwang University dental college who exhibited normal occlusion and a skeletal Class I relationship without facial asymmetry were enrolled as a control group.
For the control group, the inclusion criteria were as follows: skeletal Class I relationship (0° < ANB < 4°) and menton deviation by < 2.0 mm. For the asymmetry group, the inclusion criteria were as follows: skeletal Class III malocclusion (ANB < 0°) and menton deviation by > 3.0 mm. Both groups had a complete permanent dentition, with no malposed canines or first molars, no history of orthodontic treatment, no degenerative temporomandibular joint disease, no systemic diseases or trauma history, and no congenital deformities of the facial bones. This study was approved by the institutional review board of Wonkwang University Dental Hospital in Iksan (WKDIRB201705-01) and Daejeon (W1706/001-001).
CBCT imaging and three-dimensional (3D) image reconstruction
CBCT images were acquired using the Alphard VEGA scanner (Asahi Roentgen Ind. Co., Ltd., Kyoto, Japan; field of view, 200 × 179 mm; 80 kV; 5.00 mA; exposure time, 17 s; voxel size, 0.39 mm; and slice thickness, 1.00 mm). All CBCT data were stored in Digital Imaging and Communications in Medicine (DICOM) format.
The DICOM files were reconstructed to generate 3D images using OnDemand3D 1.0 software (Cybermed, Seoul, Korea). The reconstructed 3D images were reoriented parallel to the FH plane, which was constructed to pass through the right side of the orbitale and the porion on both sides, and a plane passing through the nasion and basion (midsagittal plane), perpendicular to the FH plane.
Measurements
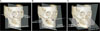
The landmarks and reference planes used for obtaining measurements in the present study are described in Figure 1. The maxillary and mandibular reference planes were defined as suggested by Park et al.21 The maxillary plane was constructed to pass through the right and left maxillares and anterior nasal spine (ANS). The midmaxillary plane was constructed to pass through ANS and posterior nasal spine, perpendicular to the maxillary plane. The mandibular plane was constructed to pass through the menton and gonion on both sides, and the midmandibular plane was constructed to pass though the menton and the midpoint of the gonion on both sides, perpendicular to the mandibular plane.
The deviated side was defined as the side toward which the menton was deviated in relation to the midsagittal plane. The other side was defined as the nondeviated side. Differences in variables between the two sides were calculated by subtracting the value for the nondeviated side from the value for the deviated side.
Skeletal measurements
Skeletal measurements included maxillary and mandibular canting, the ramus inclination on both sides, and menton deviation (Figure 2A). Maxillary canting (°) was measured as the angle between the FH plane and the projected line connecting the right and left maxillares on the frontal plane. Mandibular canting (°) was measured as the angle between the FH plane and the projected line connecting the right and left gonions on the frontal plane, which is synonymous with the mandibular roll in the study by Ryu et al.22 The ramus inclination (°) was measured as the angle between the FH plane and the projected line connecting the condylion and gonion on the frontal plane. Menton deviation (mm) was measured as the distance between the midsagittal plane and the menton.
Dental measurements
Dental measurements included the buccolingual inclinations of the maxillary and mandibular canines and first molars and the transverse distances between the cusp tips or root apices of these teeth and the midmaxillary or midmandibular plane. The dental measurements are defined in Table 1 and Figure 2B and C.
All image reorientation and measurement procedures were conducted by the same operator.
Statistical analysis
G*Power 3.1.9.2 software (Franz Faul, Universität Kiel, Germany) was used to determine the sample size, and we found that more than 26 patients per group were required to achieve a significant difference with a typical two-tailed statistical analysis when the program set the α value at 0.05 and power (1−β) at 0.8.
For evaluation of the intraobserver reliability, all measurements in 10 patients were repeated by the same investigator after a 3-week interval. The intraclass correlation coefficients (0.831–0.996) indicated excellent reproducibility of the measurements.
The independent t-test was performed to compare each variable for the same side between the control and asymmetry groups, while the paired t-test was used to evaluate significant differences between the deviated and nondeviated sides in the asymmetry group. Pearson correlation coefficients were calculated for the correlations among skeletal measurements and between skeletal and dental measurements in the asymmetry group. All statistical analyses were performed using Statistical Package for the Social Sciences (SPSS) software, version 12.0 (SPSS Inc., Chicago, IL, USA). A 95% confidence level (p < 0.05) was considered statistically significant.
RESULTS
Comparisons between the control and asymmetry groups
The difference in the ramus inclination between the left and right sides (p < 0.001) and menton deviation (p < 0.001) were significantly greater in the asymmetry group than in the control group. Maxillary and mandibular canting showed no significant differences between the two groups. In the asymmetry group, the ramus inclination was greater on the deviated side than on the nondeviated side (p < 0.001; Table 2).
All patients in the asymmetry group showed dental compensation in all angular and linear measurements except the distances from the midmaxillary plane to the root apex of the maxillary canine and the mesiobuccal root apex of the maxillary first molar, and the distance from the midmandibular plane to the mesial root apex of the mandibular first molar. Differences in the maxillary and mandibular canine (p < 0.01) and first molar (p < 0.01) inclinations between the left and right sides were significantly greater in the asymmetry group than in the control group. When dental measurements were compared between the deviated and nondeviated sides in the asymmetry group, the maxillary teeth on the deviated side were significantly more buccally inclined than those on the nondeviated side (p < 0.001), whereas the mandibular teeth on the deviated side were significantly more lingually inclined than those on the nondeviated side (p < 0.001).
With regard to the linear measurements, left-right differences in the distances from the maxillary and mandibular canine and first molar cusp tips to the midmaxillary and midmandibular planes, respectively, (maxillary canine, p < 0.01; first molar, p < 0.01; mandibular canine, p < 0.001; first molar, p < 0.001), as well as the distance from the root apex of the mandibular canine to the midmandibular plane (p < 0.05), were significantly greater in the asymmetry group than in the control group. In the asymmetry group, the maxillary canine (p < 0.01) and first molar (p < 0.05) cusp tips on the deviated side were more buccally positioned than those on the nondeviated side, whereas the root apex of the maxillary canine (p < 0.05) and the cusp tips and root apices of the mandibular teeth on the deviated side were more lingually positioned than those on the nondeviated side (canine cusp tip, p < 0.001; root apex, p < 0.01; first molar cusp tip, p < 0.001; root apex, p < 0.01; Table 3).
Correlations between measurements in the asymmetry group
In the asymmetry group, mandibular canting showed a significant positive correlation with the difference in the ramus inclination between the deviated and nondeviated sides (r = 0.321, p < 0.05) and maxillary canting (r = 0.348, p < 0.05). Moreover, the amount of menton deviation positively correlated were mandibular canting (r = 0.378, p < 0.05) and the difference in the ramus inclination (r = 0.337, p < 0.05; Table 4).
Maxillary canting was negatively correlated with differences in the maxillary first molar inclination (r = −0.341, p < 0.05) and distances from the midmaxillary plane to the maxillary canine root apex (r = −0.424, p < 0.01) and maxillary first molar cusp tip (r = −0.509, p < 0.01) and root apex (r = −0.467, p < 0.01) between the two sides.
The difference in the distance from the mandibular canine root apex to the midmandibular plane between the two sides increased with an increase in mandibular canting (r = −0.333, p < 0.05).
Positive correlations were observed between the difference in the ramus inclination and differences in the maxillary first molar inclination (r = 0.388, p < 0.05), distances from the maxillary canine (r = 0.309, p < 0.05) and first molar (r = 0.447, p < 0.01) cusp tips to the midmaxillary plane, and distance from the maxillary first molar root apex to the midmaxillary plane (r = 0.331, p < 0.05).
The amount of menton deviation showed positive correlations with differences in the maxillary canine inclination (r = 0.323, p < 0.05) and distance from the maxillary canine cusp tip to the midmaxillary plane (r = 0.365, p < 0.05) between the deviated and nondeviated sides. The difference in the mandibular first molar inclination between sides increased with an increase in menton deviation (r = −0.385, p < 0.05), as did differences in the distances from the midmandibular plane to the mandibular canine (r = −0.530, p < 0.01) and first molar (r = −0.372, p < 0.05) cusp tips and the mandibular canine root apex (r = −0.405, p < 0.05; Table 5).
DISCUSSION
In the present study, we analyzed the transverse dental compensation in reference to the maxillary and mandibular basal bones using CBCT and evaluated the correlations between transverse dental compensation and skeletal asymmetry variables in patients with skeletal Class III malocclusion and facial asymmetry. We found that the patients exhibited an apparent difference in the transverse dental compensation between the deviated and the nondeviated sides. Furthermore, transverse dental compensation was correlated with the maxillary and mandibular asymmetry patterns.
Skeletal Class III malocclusion is relatively common in Asians234 and is frequently accompanied by facial asymmetry.1234 It could be caused by excessive growth of the mandible, and the prevalence of facial asymmetry in skeletal Class III patients has been reported as 17% to 80%.1234 In this regard, Severt and Proffit1 found that the lower face showed more asymmetry than the midface. Vig and Hewitt7 documented that the dentoalveolar region and the lower parts of the nasal cavity showed functional adaptation in response to mandibular asymmetry, and compensatory changes in the dentoalveolar structures occurred to maintain bilaterally symmetrical function and maximum intercuspation of teeth. Therefore, elimination of dental compensation is important to move the maxilla and mandible into their appropriate positions during orthognathic surgery.8910
Conventionally, facial asymmetry and dental compensation have been evaluated using dental casts and/or two-dimensional radiographs, particularly PA cephalograms.1112 However, these methods have some limitations such as superimposition and image magnification and distortion according to the head orientation. Major et al.13 suggested that there was a considerable range in the magnitude of error with different horizontal and vertical values. Moreover, they examined the effect of the head orientation on PA cephalometric landmark identification and concluded that there were identification errors with head rotation.14
Recently, because of the high reliability of CBCT,2324 methods for the evaluation of facial asymmetry using this imaging modality have been introduced.212526 CBCT could also be a useful tool for the assessment of dental compensation. Several studies151617 have evaluated dental compensation patterns and investigated their correlation with skeletal discrepancies using CBCT. Park et al.15 suggested that the amount of menton deviation was negatively correlated with the difference (deviated-nondeviated side) in the mandibular first molar's angular measurements and positively correlated with the difference in the maxillary first molar's angular measurements. Song et al.16 also reported that the maxillary canine and first molar on the deviated side were more buccally positioned than those on the nondeviated side, whereas the mandibular first molar on the deviated side was more lingually positioned than that on the nondeviated side. In addition, relative to their counterparts on the nondeviated side, the maxillary first molar and mandibular first molar on the deviated side were buccally and lingually angulated, respectively. Previous studies used the FH plane151617 or the frontozygomatic suture plane18 for the evaluation of maxillary dental compensation. However, if the correction of maxillary canting though maxillary surgery is planned, these reference planes cannot be used. Therefore, maxillary dental compensation should be evaluated in reference to the maxillary basal bone. Moreover, previous studies have focused on the correlation of dental compensation with menton deviation only, and few have assessed the correlation of this parameter with other skeletal asymmetry variables in the maxilla or mandible.
In the present study, most patients in the asymmetry group exhibited mandibular prognathism, so dental compensation was thought to be affected by such a small amount of menton deviation. Haraguchi et al.2 investigated the characteristics of facial asymmetry in human adults with mandibular prognathism by including subjects with a deviation of > 2.0 mm from the facial midline in an asymmetry group. Chebib and Chamma27 suggested that deviation by > 3.0 mm is abnormal. Accordingly, the asymmetry group in our study included patients with menton deviation by > 3.0 mm.
With regard to skeletal measurements, the asymmetry group showed a greater difference in the ramus inclination between the two sides than did the control group, with the ramus inclination being greater on the deviated side than on the nondeviated side. Furthermore, the difference in the ramus inclination between the two sides increased with an increase in menton deviation. However, maxillary and mandibular canting showed no significant differences between the asymmetry and control groups. Mandibular canting was positively correlated with the amount of menton deviation, whereas maxillary canting was not. Canting of ≥ 3° could be recognized as facial asymmetry.28 Therefore, ramus inclination and mandibular canting in the frontal plane should be assessed for the evaluation of facial asymmetry.
In the present study, interside differences in tooth inclinations and transverse distances from canine and first molar cusp tips to the midmaxillary or midmandibular plane were significantly greater in the asymmetry group than in the control group. Moreover, in the asymmetry group, the maxillary teeth on the deviated side were more buccally inclined while the cusp tips on the deviated side were more buccally positioned than those on the nondeviated side. On the other hand, the mandibular teeth on the deviated side were more lingually inclined while and both the cusp tips and root apices on the deviated side were more lingually positioned than those on the nondeviated side. Because maxillary and mandibular dental compensation increases with an increase in menton deviation, this compensation should be assessed to establish a plan for camouflage treatment or orthodontic treatment combined with orthognathic surgery. However, the differences in the mandibular dental measurements were smaller than those in previous studies.151618 This could be explained by the fact that menton deviation (5.84 ± 2.39 mm) in this study was smaller than that in previous studies,151618 and that patients with crossbite in the mandibular first molar region were also included in this study.
With an increase in maxillary canting, the difference in the maxillary first molar inclination between the two sides decreased. On the other hand, greater menton deviation resulted in greater differences in the mandibular first molar inclination and distances from the cusp tips and root apices of the mandibular teeth to the midmandibular plane between sides.
If orthognathic surgery is planned, it is important to eliminate dental compensation before orthognathic surgery for repositioning the basal bones in their appropriate position. In order to establish an appropriate plan for presurgical orthodontic treatment, dental compensation should be evaluated. Therefore, more active presurgical orthodontic treatment for transverse decompensation is required for patients with greater menton deviation. There have been several attempts to correct skeletal canting by molar intrusion through orthodontic treatment, which could minimize the need for orthognathic surgery. However, surgical intervention may be advantageous if the treatment period is insufficient for canting correction by molar intrusion or if excessive molar intrusion is needed. Besides, in accordance with the increase in maxillary canting, the bilateral maxillary first molars tended to show more symmetric buccal inclinations relative to the maxillary basal bone in the present study. This correlation may decide whether maxillary occlusal canting can be corrected by maxillary surgery or orthodontic treatment.
This study has some limitations. The patients were not divided according to the type of facial asymmetry, and projected lines on the frontal planes of the basal bones were used to calculate tooth inclination. However, the projected line could be influenced according to divergence of the horizontal reference plane of the basal bone and could also be changed by the mesiodistal angulation of the tooth.29 Further studies with a large sample size should divide the experimental groups according to the vertical facial pattern or type of facial asymmetry.
CONCLUSION
Ramus was as much inclined toward the deviated side as menton was deviated. Transverse dental compensation was correlated with the maxillary and mandibular asymmetry patterns. These results would be helpful in understanding the pattern of transverse dental compensation and planning surgical procedure for patients with skeletal Class III malocclusion and facial asymmetry.


 XML Download