

 PDF
PDF ePub
ePub Citation
 Print
Print


INTRODUCTION
Chronic hepatitis B virus (HBV) infection is still a serious global health threat. In 2015, its global prevalence was 3.5%, with 257–270 million people living with chronic HBV infection. The natural course of chronic HBV infection is generally divided into four sequential phases: hepatitis B e antigen (HBeAg)-positive chronic infection (EPCI) and hepatitis (EPCH), followed by HBeAg-negative chronic infection (ENCI) and hepatitis (ENCH) [1]; however, it is often diverse and variable. In patients with chronic HBV infection, persistent or recurrent chronic hepatitis is a major risk factor for cirrhosis, hepatocellular carcinoma, and hepatic decompensation [1234]. Currently, most clinical practice guidelines on the management of chronic HBV infection [1234] focus on liver pathological assessment or on serum HBV DNA and alanine transferase (ALT), which serve as main markers to differentiate EPCH from EPCI and ENCH from ENCI and to decide antiviral treatment. Recent studies have demonstrated that serum hepatitis B surface antigen (HBsAg) and hepatitis B core antibody (HBcAb) are also markers for differentiating EPCH from EPCI and ENCH from ENCI [56789].
Hepatitis B core-related antigen (HBcrAg) is a denatured mixture consisting of HBeAg, hepatitis B core antigen (HBcAg), and a 22-kDa precore protein (p22cr) [1011]. p22cr has been found in HBV DNA-negative and HBcAg-deficient Dane-like particles [12]. HBeAg, HBcAg, and p22cr are all products of the precore/core gene and share 149 amino acid residues [12]. The levels of serum HBcrAg vary among the phases of chronic HBV infection [1314]. We investigated changes in serum HBcrAg in the different phases of chronic HBV infection and evaluated the performance of serum HBcrAg in predicting EPCH and ENCH in comparison with that of other serum virological markers.
METHODS
Study population
This retrospective study included 492 treatment-naive Chinese patients with chronic HBV infection who underwent liver biopsy at the Shanghai Public Health Clinical Center of Fudan University, China, between January 2012 and June 2015. Among them, 292 were HBeAg-positive, including 189 males and 103 females with a median age of 32.0 years (range: 14–72 years), and 200 were HBeAg-negative, including 124 males and 76 females with a median age of 42.5 years (range: 17–72 years). There was no difference in the male : female ratio (χ2=0.272, P=0.6017), but there was a significant difference in median age (Z=8.152, P<0.0001) between HBeAg-positive and HBeAg-negative patients.
On the basis of a detailed medical history as well as dynamic routine serum biochemical and virological tests at least one year before liver biopsy, the 492 patients were classified as EPCI (N=49), EPCH (N=243), ENCI (N=101), and ENCH (N=99), with reference to the European Association for the Study of the Liver guidelines [1] and the Scheuer standard [15] for liver pathological assessment. According to the the Scheuer standard, grade is used to describe the intensity of necro-inflammation, and stage is a measure of fibrosis and architectural alteration. The grades include five levels, G0–G4, and the stages include five levels, S0–S4. The patients with EPCI had pathological grade ≤G1 and pathological stage ≤S1, as well as serum ALT <0.68 µkat/L and serum HBV DNA >107 IU/mL every three to four months in at least the past one year and at the date of liver biopsy. Patients with ENCI had pathological grade ≤G1 and any pathological stage, as well as serum ALT <0.68 µkat/L and serum HBV DNA <2×10⁴ IU/mL every three to four months in at least the past one year and at the date of liver biopsy. Patients with EPCH and ENCH had pathological grade >G1 and/or pathological stage >S1, or serum ALT ≥0.68 µkat/L with any level of serum HBV DNA at least once in at least the past one year and at the date of liver biopsy.
We did not include patients who could not be clearly phased, such as those who met the pathological and dynamic biochemical criteria for EPCI but whose serum HBV DNA during serial monitoring and at the date of liver biopsy was ≤107 IU/mL at least once, and those who met the criteria for ENCI but whose serum HBV DNA during serial monitoring and at the date of liver biopsy was >2×10⁴ IU/mL at least once. We also excluded patients with HBV combined with other forms of viral hepatitis, drug-induced liver injuries, significant alcohol consumption (>20 g/day), nonalcoholic fatty liver disease (steatosis >5% of hepatocytes), Schistosoma japonicum liver disease, endocrine and metabolic diseases, and blood system diseases, and patients who had accepted therapy with nucleos(t)ides, interferon-alpha, glycyrrhizinate, or matrine/oxymatrine in the last six months.
Ethics
This study was approved by the independent ethics committee of Shanghai Public Health Clinical Center of Fudan University (2013-K-008, 2016-S-046-02). All patients provided written consent before liver biopsy, and all clinical investigations were conducted according to the 2013 Declaration of Helsinki.
Laboratory assays
Fasting blood samples were collected in the morning one week before and after liver biopsy. The serum was separated and stored at −40℃. Serum HBcrAg was measured using a chemiluminescent enzyme immunoassay LUMIPULSE G1200 automated analyzer (Fujirebio, Tokyo, Japan) and auxiliary reagents (Fujirebio, lot number: SAX5031). The linear detection range of HBcrAg is 1–10,000 kU/mL, and a sample was retested at a dilution of 1:100 if HBcrAg exceeded the upper limit of detection (ULD).
Serum HBsAg and HBeAg were measured using a chemiluminescent microparticle immunoassay ARCHITECT i2000 automated analyzer (Abbott Laboratories, Chicago, IL, USA) and auxiliary reagents (Abbott, lot number: 82194FN00). The linear detection range of HBsAg is 0.05–250 IU/mL, and a sample was retested at a dilution of 1:500 if HBsAg exceeded the ULD. The lower limit of detection (LLD) of HBeAg is 1.0 sample-to-cutoff ratio (SCO). Serum HBV DNA was quantified with the Bio-Rad iCycleriQ real-time PCR detection system (Bio-Rad Laboratories, Berkeley, CA, USA) and the Qiagen PCR kit (Qiagen, Shenzhen, China, lot number: 20170101/4) with a detection range of 5×10²–5×10⁷ IU/mL.
Serum ALT, aspartate transferase (AST), albumin (ALB), and cholinesterase (ChE) were measured with a Hitachi 7600 automated biochemist analyzer (Hitachi, Tokyo, Japan) and auxiliary reagents. Blood platelets (PLT) were counted using a Sysmex-XT 4000i automated hematology analyzer (Sysmex, Mundelein, IL, USA) and an auxiliary reagent.
Pathological diagnoses
Ultrasound-assisted liver biopsies were performed using a one-sec liver biopsy needle (16G). The biopsy specimens were immediately transferred into plastic tubes, snap-frozen, and processed within 36 hours. A biopsy sample length of at least 10 mm was required for inclusion in this study. Liver pathology was diagnosed independently by one experienced pathologist who was blinded to all serum biochemical and virological parameters. The diagnosis was based on the Scheuer standard [15]. Intrahepatic HBsAg and HBcAg were detected by immunohistochemistry. Intrahepatic HBsAg and HBcAg expression levels were scored as 0, 1, 2, and 3 according to proportions of immunolabelled cells of 0%, <5%, 25–49%, and >50%, respectively.
Statistical analyses
A two-independent samples Mann-Whitney U test was used to assess differences in age, serum biochemical parameters, and serum virological markers between EPCI and EPCH and between ENCI and ENCH. Pearson's chi-square test was used to evaluate differences in frequencies in different liver pathological grades and stages, and in different intrahepatic HBsAg and HBcAg scores between EPCI and EPCH and between ENCI and ENCH. Spearman's rank correlation analysis was used to analyze the correlations between serum HBcrAg and biochemical parameters, and other serum virological markers, and between serum HBcrAg and liver pathological grade and stage, and intrahepatic HBsAg and HBcAg score. The ROC curve was used to evaluate the performance of serum HBcrAg and other serum virological markers for predicting EPCH and ENCH. A two paired-sample Delong Z-test was used to evaluate differences in areas under ROC curves (AUCs) of serum HBcrAg and other serum virological markers for predicting EPCH and ENCH. The optimal cutoff and the tradeoff cutoff were determined with reference to the maximum sum and the minimum difference in sensitivity and specificity of the same cutoff, respectively. P<0.05 (two-tailed) was considered statistically significant. MedCalc version 15.8 (MedCalc Software, Mariakerke, Belgium) was used for statistical analyses.
RESULTS
Clinical, biochemical,and pathological characteristics of study population
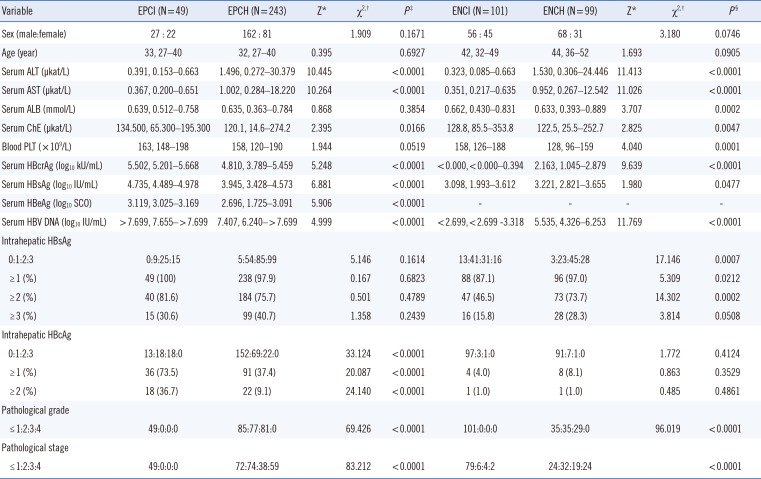
The clinical, laboratory and pathological data of the study population are summarized in Table 1.
Virological markers during different phases of chronic HBV infection
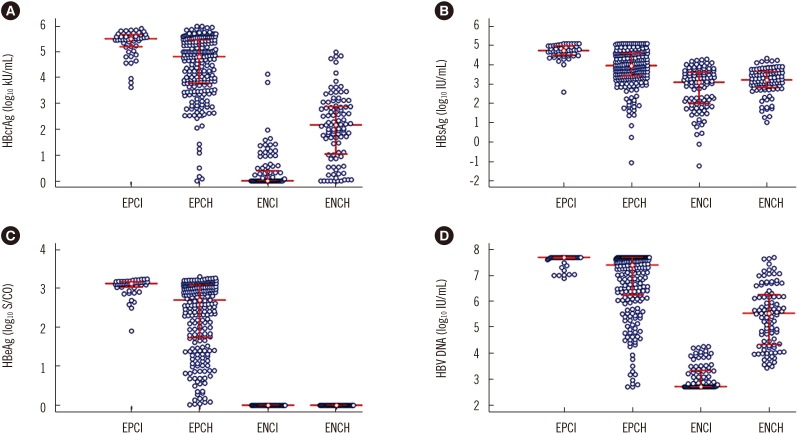
The distributions of serum HBcrAg, HBsAg, HBeAg, and HBV DNA were illustrated in Fig. 1A–D, respectively. The frequencies of serum HBcrAg higher than 100 times the ULD in EPCI and EPCH were 0.00% (0/49) and 0.82% (2/243), respectively, and lower than the LLD in ENCI and ENCH were 61.39% (62/101) and 7.07% (7/99), respectively (Fig. 1A). The frequencies of serum of serum HBsAg higher than 500 times the ULD in EPCI and EPCH were 12.24% (6/49) and 5.76% (14/243), respectively (Fig. 1B). The frequencies of serum HBV DNA higher than the ULD in EPCI and EPCH were 71.43% (35/49) and 37.45% (91/243), respectively (Fig. 1D), and lower than the LLD in ENCI and ENCH were 51.49% (52/101) and 0% (0/99), respectively (Fig. 1D).
The differences in median serum HBcrAg, HBsAg, and HBV DNA, and in frequencies of intrahepatic HBsAg and HBcAg scores between EPCI and EPCH and between ENCI and ENCH are summarized in Table 1.
The frequencies of intrahepatic HBsAg ≥1 and ≥2 in EPCI were higher than those in ENCI (χ2=5.375, P=0.0204 and χ2=15.275, P=0.0001, respectively); and of intrahepatic HBcAg ≥1, ≥2, and ≥3 in EPCI were also higher than those in ENCI (χ2=77.999, P<0.0001, χ2=34.944, P<0.0001, and χ2=17.340, P<0.0001, respectively). The frequencies of different intrahepatic HBsAg scores in EPCH were not different from those in ENCH (χ2=5.287, P=0.1520), while of intrahepatic HBcAg score ≥1 and ≥2 in EPCH were higher than those in ENCH (χ2=28.086, P<0.0001 and χ2=6.029, P=0.0141, respectively).
Correlation of HBcrAg with biochemical parameters, other virological markers, and pathological states
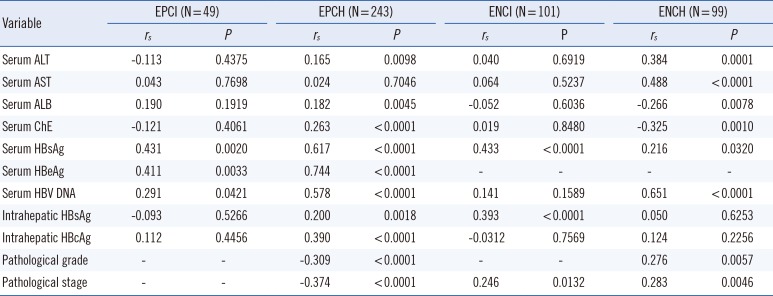
The Spearman's correlation coefficients of serum HBcrAg with serum biochemical parameters and other HBV markers, intrahepatic HBsAg and HBcAg, and liver pathological grade and stage in different phases are summarized in Table 2.
AUCs of HBcrAg, HBsAg, and HBV DNA for predicting EPCH and ENCH
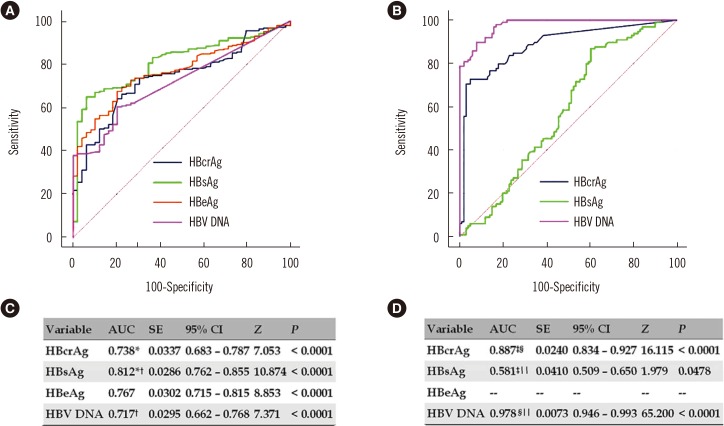
The ROC curves of HBcrAg, HBsAg, and HBV DNA for predicting EPCH and ENCH were illustrated in Fig. 2A and 2B, respectively, and the AUCs of those were described in Fig. 2C and 2D, respectively.
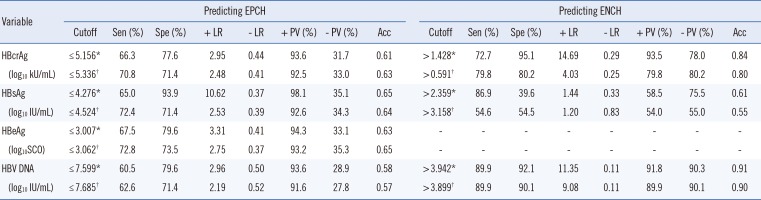
Performance of HBcrAg, HBsAg, and HBV DNA in predicting EPCH and ENCH
The corresponding diagnostic parameters based on the optimal cutoffs and tradeoff cutoffs of serum HBcrAg, HBsAg, and HBV DNA in predicting EPCH and ENCH were summarized in Table 3.
DISCUSSION
We investigated changes in serum HBcrAg in different phases of chronic HBV infection and their relationships with serum biochemical parameters, liver pathological states, and other serum and intrahepatic virological markers. We also evaluated the performance of serum HBcrAg in predicting EPCH and ENCH (compared with HBsAg, and HBV DNA), and we determined clinically valuable tradeoff cutoffs of serum HBcrAg for distinguishing the different phases.
Seto et al. [13] reported that serum HBcrAg had no significant correlation with serum ALT in all four phases of chronic HBV infection. Maasoumy et al. [14] reported that serum HBcrAg had a significant positive correlation with serum ALT and AST in only ENCH. However, neither of these studies evaluated the correlation between serum HBcrAg and liver pathological states. In our study, serum HBcrAg had no correlation with liver pathological grade and stage in EPCI, but it had a weak negative correlation with pathological grade and stage in EPCH; serum HBcrAg had a weak positive correlation with pathological stage in ENCI, and it had a weak positive correlation with pathological grade and stage in ENCH. These findings suggested that the quantitative change in serum HBcrAg in the HBeAg-positive stage is opposite to that in the HBeAg-negative stage during liver injury and fibrosis progression.
Seto et al. [13] and Maasoumy et al. [14] demonstrated that serum HBcrAg had a significant positive correlation with serum HBsAg and HBV DNA in all four phases. We obtained similar results; however, neither of these studies evaluated the correlations of serum HBcrAg with intrahepatic HBsAg and HBcAg. In our study, serum HBcrAg had no correlation with intrahepatic HBsAg and HBcAg in EPCI, but it had a weak positive correlation with intrahepatic HBsAg and HBcAg in EPCH. Further, serum HBcrAg had a weak positive correlation with intrahepatic HBsAg, but it showed no correlation with intrahepatic HBcAg in ENCI, and it had no correlation with intrahepatic HBsAg and HBcAg in ENCH. These findings indicate that the quantitative change in serum HBcrAg remains substantially synchronized with the changes in serum HBsAg and HBV DNA, and essentially in the same direction as intrahepatic HBsAg and HBcAg, irrespective of HBeAg status.
Previous studies [6131416] as well as our own results indicated that serum virological markers showed the highest levels in EPCI and differentiated decrease in EPCH, with HBsAg showing the strongest decrease, followed by HBeAg, HBcrAg, and HBV DNA; however, these markers showed the lowest levels in ENCI and differentiated increases in ENCH, with HBV DNA showing the strongest increase, followed by HBcrAg and HBsAg. Our study also indicated that intrahepatic HBsAg and HBcAg showed the highest expression in EPCI and differentiated reductions in EPCH, with the reduction in HBcAg being more significant than that in HBsAg; In contrast, intrahepatic HBsAg exhibited low expression, and intrahepatic HBcAg was close to “zero” expression in ENCI. They showed differentiated increases in ENCH, with the increase in HBsAg being more significant than that in HBcAg.
There were reverse changes in quantitative and semi-quantitative virological markers between HBeAg-positive and HBeAg-negative patients and differential changes in those within HBeAg-positive and HBeAg-negative patients. It suggested that the virological and immunological pathogeneses in the onset and progression of disease differ between the HBeAg-positive and HBeAg-negative stages, in which HBsAg might play an important immune regulatory role [1718]. HBcrAg, including HBcAg and HBeAg, might be the primary target of the immune response [19]. In the HBeAg-positive stages, the overexpression of HBsAg might lead to immune exhaustion against HBV antigen [20], and hepatitis activation might arise from the spontaneous decrement of HBV replication and HBsAg expression, resulting in the initial activation of an immune response mainly against HBcrAg, accompanied by increased liver injury and progressed fibrosis and decreased HBV replication and antigen expression. The initial activation of the immune response continues until HBeAg is significantly reduced or seroconverted and maintains the immune response against HBcrAg. In the HBeAg-negative stages, the low to near “zero” expression of HBcrAg might lead to HBV antigen immune ignorance, and hepatitis activation might arise from the opportunistic increase in HBV replication and HBcrAg expression, resulting in the re-activation of an immune response mainly against HBcrAg accompanied by increased liver re-injury and progressed re-fibrosis, and again decrease HBV replication and antigen expression. The re-activation of the immune response continues until HBsAg is significantly reduced or seroconverted and maintains the immune response against HBcrAg and HBsAg.
Gou et al. [21] compared the performance of serum HBcrAg and HBsAg for predicting EPCI and ENCI using a small number of samples, where the difference in AUCs between serum HBcrAg and serum HBsAg for predicting EPCI was not statistically significant, but that for predicting ENCI was. However, they did not provide information on serum HBV DNA for predicting EPCI and ENCI. Our study indicated that serum HBcrAg, HBsAg, and HBV DNA could predict EPCH and ENCH. Among those, the largest AUCs were of serum HBsAg for predicting EPCH and of serum HBV DNA for predicting ENCH. The AUC of serum HBcrAg for predicting EPCH was significantly smaller than that of serum HBsAg, and was not significantly larger than that of serum HBV DNA. In contrast, the AUC for predicting ENCH was significantly smaller than that of serum HBV DNA and significantly larger than that of serum HBsAg. These data suggest that serum HBcrAg might be an important surrogate marker in predicting EPCH and ENCH.
Our study had some limitations. First, it was a cross-sectional study, not a longitudinal study, which generally yields stronger evidence. Second, we did not explore relationships between serum HBcrAg and HBV genotypes, serum and intrahepatic HBV RNA, and intrahepatic HBV covalently closed circular DNA. Third, we did not investigate the relationship between serum HBcrAg and quantitative serum anti-HBc.
In conclusion, serum HBcrAg, HBsAg, and HBV DNA display a differentiated decrease from EPCI to EPCH, in which the decrease in HBcrAg is smaller than that in HBsAg and larger than that in HBV DNA. In contrast, serum HBcrAg, HBsAg, and HBV DNA show differentiated increases from ENCI to ENCH, in which the increase in HBcrAg is larger than that in HBsAg and smaller than that in HBV DNA. Although serum HBsAg and serum HBV DNA performed best in predicting EPCH and ENCH, respectively, serum HBcrAg is an important surrogate marker for predicting EPCH and ENCH.
 XML Download