Journal List > Ann Lab Med > v.39(1) > 1100982

Farokhizadeh, Dehbidi, Geramizadeh, Yaghobi, Malekhosseini, Behmanesh, Sanati, Afshari, Moravej, and Karimi: Association of MicroRNA Polymorphisms With Hepatocellular Carcinoma in an Iranian Population

Abstract

Background

Single nucleotide polymorphisms (SNPs) can modulate various biological processes by influencing microRNA (miRNA) biogenesis and altering target selection. Common SNPs may alter the processing of miRNA and may be associated with hepatocellular carcinoma (HCC). We investigated the relationship between miR-499A>G, miR-149C>T, miR-196a2T>C, and miR-146aG>C and HCC susceptibility, examining the interaction of the miRNAs with hepatitis B virus (HBV).

Methods

We evaluated the associations of miR-499A>G (rs3746444), miR-149C>T (rs2292832), miR-196a2T>C (rs11614913), and miR-146aG>C (rs2910164) with HCC susceptibility in 100 HCC patients (70 males and 30 females) and 120 healthy controls (70 males and 50 females), using the PCR-restriction fragment length polymorphism method.

Results

For miR-499A>G, the frequencies of the AG genotype and G allele were higher in female HCC patients than in female controls (P=0.02 and 0.045, respectively). The frequency of the A allele was higher in HBV-positive HCC patients than in controls (P=0.019). For miR-149C>T, the frequency of the CC genotype was higher in female HCC patients than in female controls (P=0.009). For miR-196a2T>C, the frequencies of the CT and CC genotypes and the C allele were higher in HBV-positive HCC patients than in controls (P<0.001, P=0.009, and P<0.001, respectively). The frequencies of miR-146aG>C polymorphisms did not differ between HCC patients and controls.

Conclusions

miR-499A>G, miR-149C>T, and miR-196a2T>C were associated with the development of HCC in women and/or that of HBV-related HCC. They can be considered genetic risk factors for the development of HCC among Iranians.

INTRODUCTION

Hepatocellular carcinoma (HCC) is the fifth most common cancer and the cause of more than half a million deaths each year, making it the third most common cause of cancer-related death worldwide [1]. This disease has several risk factors, including chronic hepatitis B virus (HBV) and hepatitis C virus infections, alcohol abuse, liver cirrhosis, and exposure to aflatoxin B1. However, most individuals with these risk factors never develop HCC, and many HCC cases develop in individuals without the above risk factors; thus, other factors, such as genetics, may play an important role in the development of HCC [2].
Recent studies have demonstrated that a new class of small regulatory RNA molecules, termed microRNAs (miRNAs), are involved in HCC progression [34]. miRNAs are a group of small noncoding RNA molecules that have been identified in many organisms. They can regulate the expression of genes in a variety of eukaryotic systems. miRNAs are transcribed from endogenous DNA and processed from primary transcripts (pri-miRNAs) to hairpin precursors (pre-miRNA) comprising two strands: the leading strand, which is used for production of mature miRNA, and the passenger strand, which is believed to be degraded. Mature miRNAs are involved in post-transcriptional gene expression by base pairing with target mRNAs of protein-coding genes [5]. miRNAs play essential roles in many physiological processes, such as development [6], cellular variation [7], proliferation, cell death, and metabolism [8910]. Many studies have confirmed that alterations in miRNA expression are involved in cancer development by regulating the expression of proto-oncogenes or tumor-suppressor genes [51112]. miRNA polymorphisms may be involved in hepatocarcinogenesis and can determine the susceptibility of an individual to the development of HCC.
Single nucleotide polymorphisms (SNPs) are common genetic variations in the human genome. SNPs in protein-coding genes can affect the functions of proteins and in turn influence susceptibility to a specific cancer [1314]. Recently, four well-known miRNA polymorphisms (miR-499A>G, miR-149C>T, miR-196a2T>C, and miR-146aG>C) have been shown to contribute to different types of cancers, such as breast cancer, gastric cancer, cervical squamous cell cancer, and colorectal cancer [1516171819].
We investigated the potential associations of miR-499A>G, miR-149C>T, miR-196a2T>C, and miR-146aG>C with susceptibility to HCC and the interactions of these miRNAs with HBV in order to confirm whether these SNPs can serve as biomarkers for susceptibility to HCC in Iranian patients. We studied the interaction of the miRNAs with only HBV since HBV infection is a widespread risk factor for HCC in the Iranian population.

METHODS

Patients and controls

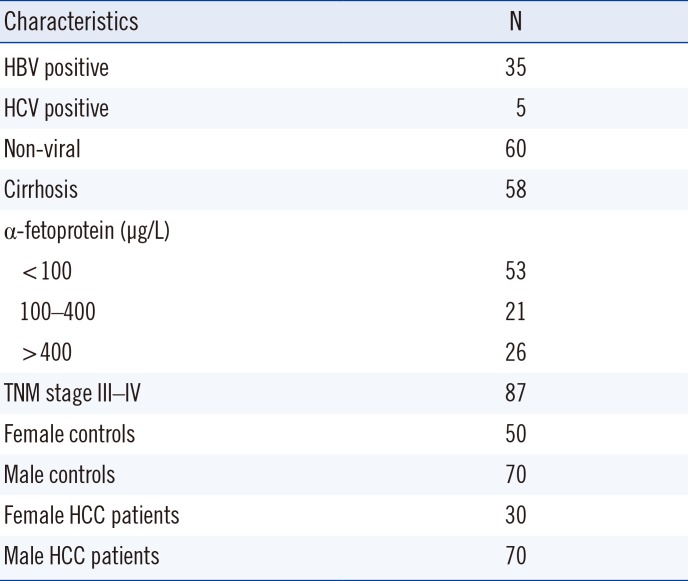
In this retrospective study, 100 patients diagnosed as having HCC (based on liver biopsy) between October 2008 and December 2013 were recruited. During the same period, 120 controls without clinical liver disease, recruited among random donors from a blood transfusion organization, were matched to the patients by age and sex. Of the HCC patients, 70 were male, and the median age was 36 (range: 10–60) years. Of the controls. 70 were male, and the median age was 38 (range: 25–60) years. All patients and controls were of Iranian descent and admitted to Namazi Hospital, Shiraz, Iran, during the study period. All completed a questionnaire on demographic characteristics, history of cancer, alcohol use, and tobacco use. Those with a history of cancer, alcohol use, or tobacco use were excluded. Patients' clinical characteristics, including tumor differentiation, tumor size, metastasis, cirrhosis, Child-Pugh class and chemotherapy, were collected from medical records. Both patients and controls were at Hardy-Weinberg equilibrium for all polymorphisms (P>0.05). Their characteristics are shown in Table 1. Both patients and controls were at Hardy–Weinberg equilibrium for all polymorphisms (P>0.05).
The Ethics Committee of Shiraz University of Medical Sciences approved the study protocol, which conformed to the 1975 Helsinki Declaration. Written informed consent was obtained from all patients and controls.

DNA extraction and genotyping

Genomic DNA from patients was extracted from HCC biopsy tissue samples using a DNeasy Blood & Tissue Kit (Qiagen, Hilden, Germany), and genomic DNA from the control group was extracted from whole blood and purified using the phenol-chloroform extraction method. Different isolation methods were used for DNA from patients and controls because the samples were from different tissue sources, and we could not obtain biopsy tissues from the control group but rather had to use blood. The purity of the extracted DNA samples was confirmed by checking the 260/280 ratio of each sample.
Polymorphisms of miR-499A>G (rs3746444), miR-149C>T (rs2292832), miR-196a2T>C (rs11614913), and miR-146aG>C (rs2910164) were analyzed using PCR-restriction fragment length polymorphism (RFLP). The four polymorphic regions were amplified using previously used primers [20] with slight modifications (Table 2) and the following PCR conditions: one cycle at 95℃ for 5 minutes; 40 cycles at 95℃ for 1 minute, 59℃ for 1 minute, and 72℃ for 1 minute; and one final cycle of extension at 72℃ for 10 minutes. The miR-499A>G, miR-149C>T, miR-196a2T>C, and miR-146aG>C polymorphisms were detected by digesting the PCR products with restriction endonucleases BclI, AluI, MspI, and SacI, respectively (Thermo Fisher Scientific, Waltham, MA, USA). The reaction products (5 µL) were run on 3.0% agarose gels stained with ethidium bromide and directly visualized under ultraviolet illumination. For each of the miRNA polymorphisms, 12 samples were randomly chosen for a second PCR assay followed by DNA sequencing to validate the RFLP findings.

Statistical analysis

Allele and genotype frequencies were calculated in the patients and controls by direct gene counting. Frequencies were compared between patients and controls using chi-square tests and Fisher's exact tests. All reported P values were two-tailed. P<0.05 was considered statistically significant. Bonferroni correction was performed for each test. Statistical analyses were performed using SPSS version 16 (IBM Corp., Armonk, NY, USA). Hardy-Weinberg equilibrium was measured using Arlequin V311 (http://cmpg.unibe.ch/software/arlequin3). The study power of each test was calculated using power SSC ver. 1 (Tarbiat Modares University, Tehran, Iran).

RESULTS

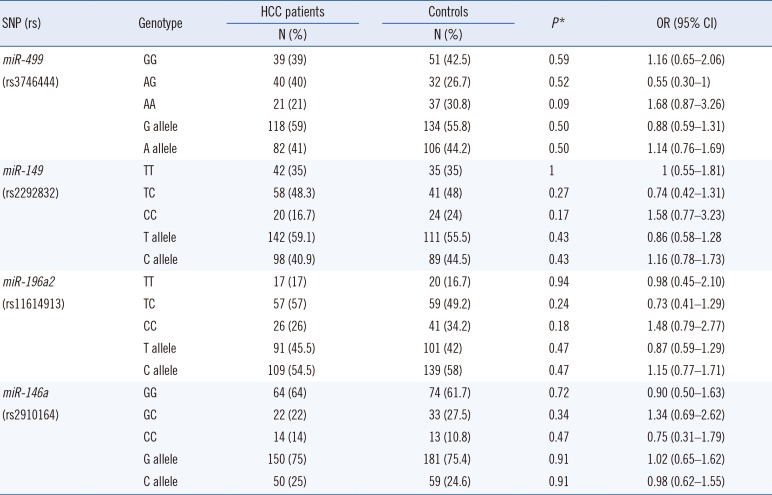
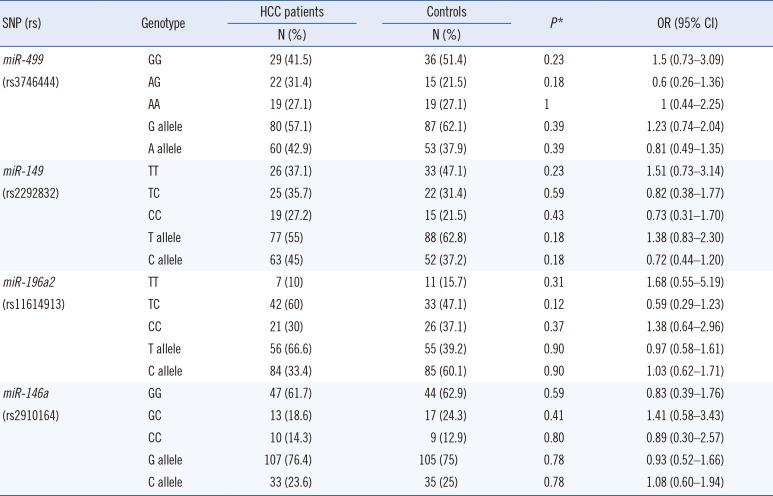
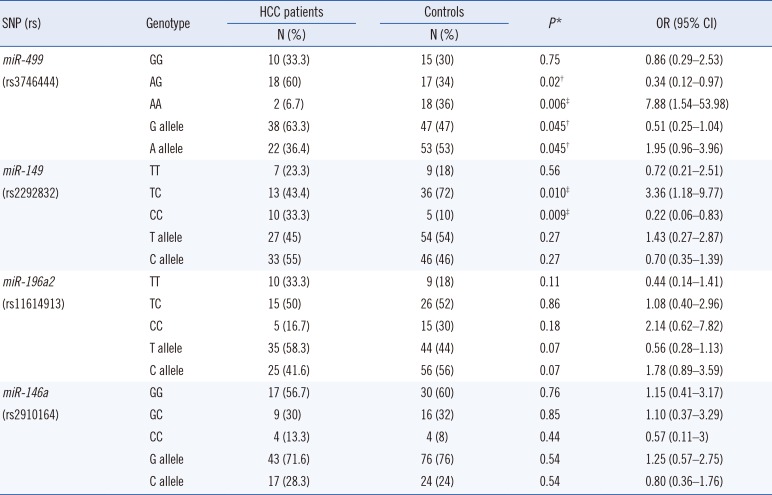
As shown in Table 3, the genotypic and allelic frequencies of miR-499A>G, miR-149C>T, miR-196a2T>C, and miR-146aG>C polymorphisms did not differ between HCC patients and controls. After classification of patients and controls according to sex (Tables 4 and 5), the frequencies of the AG genotype and the G allele in the miR-499A>G polymorphism were higher in female patients than in female controls (OR=0.34, 95% confidence interval [CI]=0.12–0.970, P=0.02, study power=67%; OR=0.51, 95% CI=0.25–1.04, P=0.045, study power=72%, respectively). In contrast, the frequencies of the AA genotype and the A allele in miR-499A>G polymorphism were lower in female patients than in female controls (OR=7.03, 95% CI=1.36–48.47, P=0.006, study power=98%; OR=1.95, 95% CI=0.96–3.96, P=0.045, study power=62%, respectively).
In addition, for the miR-149C>T polymorphism, the frequency of the CC genotype was higher in female patients than in female controls (OR=0.22, 95% CI=0.06–0.83, P=0.009, study power =88%). In contrast, the frequency of the TC genotype was lower in female patients than in female controls (OR=3.36, 95% CI= 1.18–9.77, P=0.010, study power=79%).
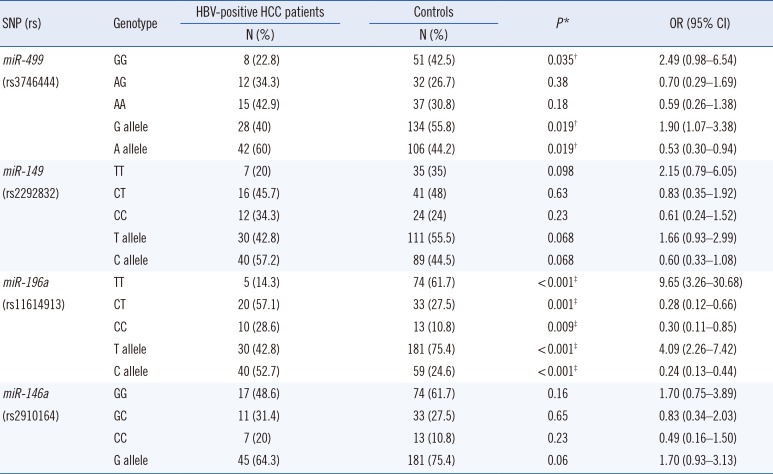
Further analysis was performed to determine the relationship between the four miRNA polymorphisms and HBV-related HCC (Table 6). For the miR-499A>G polymorphism, the frequencies of the G allele and the GG genotype were lower in HBV-positive HCC patients than in controls (OR=1.9, 95% CI=1.07–3.38, P=0.019, study power=65%; OR=2.49, 95% CI=0.98–6.54, P=0.035, study power=69%, respectively). In contrast, the frequency of the A allele was higher in HBV-positive HCC patients than in controls (OR=0.53, 95% CI=0.3–0.94, P=0.019, study power=68%).
In addition, for the miR-196a2T>C polymorphism, the frequencies of the CT and CC genotypes and the C allele were higher in HBV-positive HCC patients than in controls (OR=0.28, 95% CI=0.12–0.66, P=0.001, study power=89%; OR=0.3, 95% CI=0.11–0.85, P=0.009, study power=97%; OR=0.24, 95% CI=0.13–0.44, P<0.001, study power=99%). In contrast, the frequencies of the TT genotype and the T allele were lower in HBV-positive HCC patients than in controls (OR=9.65, 95% CI=3.29–30.68, P<0.001, study power=96%; OR=4.09, 95% CI=2.26–7.42, P<0.001, study power=94%, respectively).

DISCUSSION

Identifying the genetic biomarkers of HCC susceptibility may contribute to lowering HCC-related mortality through early diagnosis, patient care, and personalized therapy [21]. We investigated the potential associations of miR-499A>G, miR-149C>T, miR-196a2T>C, and miR-146aG>C with HCC susceptibility and the interactions of these miRNAs with HBV infection in Iranian patients. We found that the genotypic and allelic frequencies of miR-146a and miR-196a2 polymorphisms did not significantly differ between HCC patients and controls. However, the genotypic and allelic frequencies of miR-499 and miR-149 polymorphisms significantly differed between female patients and female controls. Further analysis showed that miR-499 and miR-196a2 polymorphisms were associated with the risk of HBV-related HCC.
He et al.'s [22] meta-analysis examined the potential associations between the four common SNPs (miR-499A>G, rs3746444; miR-149C>T, rs2292832; miR-196a2T>C, rs11614913; and miR-146aG>C, rs2910164) and cancer risk. They demonstrated that the rs11614913TT and the rs2910164C genotypes were significantly associated with decreased cancer risk, particularly colorectal and lung, esophageal, cervical, prostate cancers, and HCC; however, the rs3746444G allele was a risk factor for cancers in the Asian population. A previous study suggested that miR-146a rs2910164 and miR-499 rs3746444 polymorphisms may not be associated with the risk of HCC, particularly in the Asian population [23]. Another study showed that miR-196 family members inhibit cell migration, invasion, and metastasis, which are functionally linked to expression of homeobox protein Hox-C8 (HOXC8) through a mechanism involving translational repression [24].
Importantly, our results showed that the frequencies of the C allele, the homozygous CC genotype, and the heterozygous CT genotype in miR-196a2 were significantly higher in HBV-positive HCC patients than in controls. In contrast, the frequencies of the T allele and the homozygous TT genotype were significantly lower in HBV-positive HCC patients than in controls. Our results showed that inheritance of the miR-196a2 C allele and the CC and CT genotypes may increase the risk of HCC in HBV-positive patients by affecting the expression of mature miR-196a2 and HOXC8, thereby enhancing cell migration/invasion. Our results provide evidence that the miR-196a2 polymorphism may be an indicator of HCC susceptibility in HBV-positive patients. Xu et al. [25] evaluated the relationship between the miR-196a2 SNP and the risk of HCC recurrence after liver transplantation. They revealed that inheritance of the homozygous CC genotype of miR-196a2 was associated with higher miR-196a2 expression than inheritance of the TT genotype. Polymorphisms in pre-miR-196a-2 have been associated with HCC susceptibility in a Turkish population [26]. Other studies have also demonstrated the relationship between this SNP and other cancers. For example, Song et al. [27] showed that individuals who inherited the CC genotype were more susceptible to epithelial ovarian cancer than those who inherited the TT or CT genotype. With the finding of increased expression of mature miR-196a in patients with the C allele, they concluded that the miR-196a2 CC genotype may increase the risk of ovarian cancer [27].
miR-146a functions as a pro-apoptotic molecule by inhibiting the nuclear factor kappa B pathway and blocking its influence on cell proliferation, angiogenesis, metastasis, and cancer cell survival. Loss of function of miR-146a promotes cancer cell migration and invasion in vitro, whereas reciprocally increased miR-146a expression inhibits cancer invasion [2829]. Functional polymorphisms in miR-146a have been associated with the risk of HCC [30], particularly in male patients in China [25]. Another study in China showed a significant association between miR-146a and susceptibility to HBV-related HCC [31]. In contrast, in our study and two others in a Turkish population [3233], miR-146a polymorphisms did not significantly affect susceptibility to HCC. The differences in results could be attributed to variations in genotypic and allelic frequencies of specific genes across ethnic groups. Further analyses of larger populations with different ethnic groups are needed to confirm the association of miR-146a polymorphisms with the risk of HCC.
The SOX6 and Rod1 genes are two direct targets of miR-499. The SOX6 gene induces G1/S cell cycle arrest by upregulating p53 and p21 and downregulating cyclin D1/CDK4, cyclin A, and β-catenin [34]. The association of the miR-499 polymorphism with HCC susceptibility has been studied in Korean [20], Chinese [3135], and Turkish populations [32]. We also demonstrated a significant association between the miR-499 polymorphism and HCC susceptibility in HBV-positive patients. We showed that the frequency of the G allele was significantly lower in HBV-positive HCC patients than in controls. In contrast, the frequency of the A allele was significantly higher in HBV-positive HCC patients than in controls. Similar to our results, Zou et al. [35] showed that the miR-499 G allele was significantly associated with decreased risk of HCC among Chinese patients infected with HBV in a dominant model. Liu et al. [36] also demonstrated that miR-499-5p promotes cellular invasion and tumor metastasis in colorectal cancer by targeting FOXO4 and PDCD4. However, a study in a Turkish population reported that the miR-499 polymorphism has no role in genetic susceptibility to HCC [32].
miR-149 is a pro-apoptotic miRNA that can repress the expression of the Akt1 and E2F1 genes. Silencing of Akt1 and E2F1 can induce apoptosis in human tumor cell lines [37]. We showed that the frequency of the CC genotype (mutant-type homozygote) in the miR-149 polymorphism was significantly higher in female HCC patients than in female controls. In contrast, the frequency of the TC genotype was significantly lower in female HCC patients than in female controls. Similarly, two other studies reported that miR-149 polymorphisms are associated with the development of HCC [3839]. However, other researchers found a significant decrease in HCC risk with the CT and CT+CC genotypes in miR-149 in comparison with the TT genotype [2040].
Thus, a multicenter or nationwide study of the general Iranian population with a larger sample size is needed to confirm our results. Furthermore, it is still unclear whether the studied polymorphisms resulted in changes in the levels of mature miR-149 and miR-499 in HCC tissues. The specific mechanisms through which genetic polymorphisms affect the levels of pre-miRNAs and their target genes should be determined in future studies.
In conclusion, we found that polymorphisms in miR-499, miR-149, and miR-196a2 were associated with the development of HCC in women and/or HBV-related HCC in the Iranian population. Additional studies on the relationships between these miRNA polymorphisms and HCC in diverse ethnic populations are warranted to clarify the importance of these miRNA SNPs as biomarkers for HCC susceptibility.

Acknowledgment

This work was supported by a grant from the Iranian National Science Foundation (grant number 91000598).

Notes

Authors' Disclosures of Potential Conflicts of Interest: The authors declare that they have no conflicts of interest.

References

1. Gomaa AI, Khan SA, Toledano MB, Waked I, Taylor-Robinson SD. Hepatocellular carcinoma: epidemiology, risk factors and pathogenesis. World J Gastroenterol. 2008; 14:4300–4308. PMID: 18666317.
2. Caldwell S. The epidemiology of hepatocellular cancer: from the perspectives of public health problem to tumor biology. J Gastroenterol. 2009; 44(S19):96–101. PMID: 19148801.
3. Huang S. The role of microRNAs in liver cancer progression. Br J Cancer. 2011; 104:235–240. PMID: 21102580.
4. Li Y, Zhang M, Chen H, Dong Z, Ganapathy V, Thangaraju M, et al. Ratio of miR-196s to HOXC8 messenger RNA correlates with breast cancer cell migration and metastasis. Cancer Res. 2010; 70:7894–7904. PMID: 20736365.
5. Bartel DP. MicroRNAs: genomics, biogenesis, mechanism, and function. Cell. 2004; 116:281–297. PMID: 14744438.
6. Wienholds E. MicroRNA function in animal development. FEBS Lett. 2005; 579:5911–5922. PMID: 16111679.
7. Chen JF, Mandel EM, Thomson JM, Wu Q, Callis TE, Hammond SM, et al. The role of microRNA-1 and microRNA-133 in skeletal muscle proliferation and differentiation. Nat Genet. 2006; 38:228–233. PMID: 16380711.
8. Cimmino A, Calin GA, Fabbri M, Iorio MV, Ferracin M, Shimizu M, et al. miR-15 and miR-16 induce apoptosis by targeting BCL2. Proc Natl Acad Sci U S A. 2005; 102:13944–13949. PMID: 16166262.
9. Hatfield SD, Shcherbata HR, Fischer KA, Nakahara K, Carthew RW, Ruohola-Baker H. Stem cell division is regulated by the microRNA pathway. Nature. 2005; 435:974–978. PMID: 15944714.
10. Skalsky RL. Reduced expression of brain-enriched microRNAs in glioblastomas permits targeted regulation of a cell death gene. PLoS One. 2011; 6:e24248. PMID: 21912681.
11. Lewis BP, Burge CB, Bartel DP. Conserved seed pairing, often flanked by adenosines, indicates that thousands of human genes are microRNA targets. Cell. 2005; 120:15–20. PMID: 15652477.
12. Calin GA. MicroRNA signatures in human cancers. Nat Rev Cancer. 2006; 6:857–866. PMID: 17060945.
13. Brendle A, Lei H, Brandt A, Johansson R, Enquist K, Henriksson R, et al. Polymorphisms in predicted microRNA-binding sites in integrin genes and breast cancer: ITGB4 as prognostic marker. Carcinogenesis. 2008; 29:1394–1399. PMID: 18550570.
14. Chin LJ, Ratner E, Leng S, Zhai R, Nallur S, Babar I, et al. A SNP in a let-7 microRNA complementary site in the KRAS 3′ untranslated region increases non-small cell lung cancer risk. Cancer Res. 2008; 68:8535–8540. PMID: 18922928.
15. Ryan BM, Robles AI, Harris CC. Genetic variation in microRNA networks: the implications for cancer research. Nat Rev Cancer. 2010; 10:389–402. PMID: 20495573.
16. Jeon YJ, Choi YS, Rah H, Kim SY, Choi DH, Cha SH, et al. Association study of microRNA polymorphisms with risk of idiopathic recurrent spontaneous abortion in Korean women. Gene. 2012; 494:168–173. PMID: 22222140.
17. Min KT, Kim JW, Jeon YJ, Jang MJ, Chong SY, Oh D, et al. Association of the miR-146aC>G, 149C>T, 196a2C>T, and 499A>G polymorphisms with colorectal cancer in the Korean population. Mol Carcinog. 2012; 51:E65–E73. PMID: 22161766.
18. Park YS, Jeon YJ, Lee BE, Kim TG, Choi JU, Kim DS, et al. Association of the miR-146aC>G, miR-196a2C>T, and miR-499A>G polymorphisms with moyamoya disease in the Korean population. Neurosci Lett. 2012; 521:71–75. PMID: 22659075.
19. Wang AX, Xu B, Tong N, Chen SQ, Yang Y, Zhang XW, et al. Meta-analysis confirms that a common G/C variant in the pre-miR-146a gene contributes to cancer susceptibility and that ethnicity, gender and smoking status are risk factors. Genet Mol Res. 2012; 11:3051–3062. PMID: 23007982.
20. Kim WH, Min KT, Jeon YJ, Kwon CI, Ko KH, Park PW, et al. Association study of microRNA polymorphisms with hepatocellular carcinoma in Korean population. Gene. 2012; 504:92–97. PMID: 22583825.
21. Ludwig JA. Biomarkers in cancer staging, prognosis and treatment selection. Nat Rev Cancer. 2005; 5:845–856. PMID: 16239904.
22. He B, Pan Y, Cho WC, Xu Y, Gu L, Nie Z, et al. The association between four genetic variants in microRNAs (rs11614913, rs2910164, rs3746444, rs2292832) and cancer risk: evidence from published studies. PLoS One. 2012; 7:e49032. PMID: 23155448.
23. Hu M, Zhao L, Hu S, Yang J. The association between two common polymorphisms in MicroRNAs and hepatocellular carcinoma risk in Asian population. PLoS One. 2013; 8:e57012. PMID: 23437296.
24. Li W, Xie L, He X, Li J, Tu K, Wei L, et al. Diagnostic and prognostic implications of microRNAs in human hepatocellular carcinoma. Int J Cancer. 2008; 123:1616–1622. PMID: 18649363.
25. Xu X, Ling Q, Wang J, Xie H, Wei X, Lu D, et al. Donor miR-196a-2 polymorphism is associated with hepatocellular carcinoma recurrence after liver transplantation in a Han Chinese population. Int J Cancer. 2016; 138:620–629. PMID: 26365437.
26. Akkız H, Bayram S, Bekar A, Akgöllü E, Ülger Y. A functional polymorphism in pre-microRNA-196a-2 contributes to the susceptibility of hepatocellular carcinoma in a Turkish population: a case-control study. J Viral Hep. 2011; 18:e399–e407.
27. Song ZS, Wu Y, Zhao HG, Liu CX, Cai HY, Guo BZ, et al. Association between the rs11614913 variant of miRNA-196a-2 and the risk of epithelial ovarian cancer. Oncol Lett. 2016; 11:194–200. PMID: 26870188.
28. Jazdzewski K, Murray EL, Franssila K, Jarzab B, Schoenberg DR, de la. Common SNP in pre-miR-146a decreases mature miR expression and predisposes to papillary thyroid carcinoma. Proc Natl Acad Sci U S A. 2008; 105:7269–7274. PMID: 18474871.
29. Hurst DR, Edmonds MD, Scott GK, Benz CC, Vaidya KS, Welch DR. Breast cancer metastasis suppressor 1 up-regulates miR-146, which suppresses breast cancer metastasis. Cancer Res. 2009; 69:1279–1283. PMID: 19190326.
30. Xu T, Zhu Y, Wei QK, Yuan Y, Zhou F, Ge YY, et al. A functional polymorphism in the miR-146a gene is associated with the risk for hepatocellular carcinoma. Carcinogenesis. 2008; 29:2126–2131. PMID: 18711148.
31. Xiang Y, Fan S, Cao J, Huang S, Zhang LP. Association of the microRNA-499 variants with susceptibility to hepatocellular carcinoma in a Chinese population. Mol Biol Rep. 2012; 39:7019–7023. PMID: 22311030.
32. Akkiz H, Bayram S, Bekar A, Akgöllü E, Üsküdar O. Genetic variation in the microRNA-499 gene and hepatocellular carcinoma risk in a Turkish population: lack of any association in a case-control study. Asian Pac J Cancer Prev. 2011; 12:3107–3112. PMID: 22393998.
33. Akkız H, Bayram S, Bekar A, Akgöllü E, Usküdar O, Sandıkçı M. No association of pre-microRNA-146a rs2910164 polymorphism and risk of hepatocellular carcinoma development in Turkish population: a case-control study. Gene. 2011; 486:104–109. PMID: 21807077.
34. Qin YR, Tang H, Xie F, Liu H, Zhu Y, Ai J. Characterization of tumor-suppressive function of SOX6 in human esophageal squamous cell carcinoma. Clin Cancer Res. 2011; 17:46–55. PMID: 21084391.
35. Zou HZ. Positive association between miR-499A> G and hepatocellular carcinoma risk in a Chinese population. Asian Pac J Cancer Prev. 2013; 14:1769–1772. PMID: 23679271.
36. Liu X, Zhang Z, Sun L, Chai N, Tang S, Jin J, et al. MicroRNA-499-5p promotes cellular invasion and tumor metastasis in colorectal cancer by targeting FOXO4 and PDCD4. Carcinogenesis. 2011; 32:1798–1805. PMID: 21934092.
37. Lin J, Horikawa Y, Tamboli P, Clague J, Wood CG, Wu X. Genetic variations in microRNA-related genes are associated with survival and recurrence in patients with renal cell carcinoma. Carcinogenesis. 2010; 31:1805–1812. PMID: 20732906.
38. Kou JT, Fan H, Han D, Li L, Li P, Zhu J, et al. Association between four common microRNA polymorphisms and the risk of hepatocellular carcinoma and HBV infection. Oncol Lett. 2014; 8:1255–1260. PMID: 25120701.
39. Zhang Y, Guo X, Xiong L, Yu L, Li Z, Guo Q, et al. Comprehensive analysis of microRNA-regulated protein interaction network reveals the tumor suppressive role of microRNA-149 in human hepatocellular carcinoma via targeting AKT-mTOR pathway. Mol Cancer. 2014; 13:253. PMID: 25424347.
40. Liu X, Wang T, Wakita T, Yang W. Systematic identification of microRNA and messenger RNA profiles in hepatitis C virus-infected human hepatoma cells. Virology. 2010; 398:57–67. PMID: 20006370.
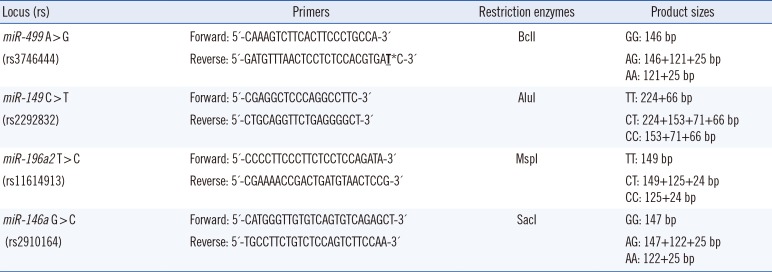
Table 1

Characteristics of HCC patients (N=100) and controls (N=120)

alm-39-58-i001
Characteristics N
HBV positive 35
HCV positive 5
Non-viral 60
Cirrhosis 58
α-fetoprotein (μg/L)
 <100 53
 100–400 21
 >400 26
TNM stage III–IV 87
Female controls 50
Male controls 70
Female HCC patients 30
Male HCC patients 70

Abbreviations: HBV, Hepatitis B virus; HCV, Hepatitis C virus; HCC, hepatocellular carcinoma.

Table 2

Primer sequences used for miRNA amplification, restriction enzymes, and product sizes

alm-39-58-i002
Locus (rs) Primers Restriction enzymes Product sizes
miR-499 A>G (rs3746444) Forward: 5′-CAAAGTCTTCACTTCCCTGCCA-3′ BclI GG: 146 bp
Reverse: 5′-GATGTTTAACTCCTCTCCACGTGAT*C-3′ AG: 146+121+25 bp
AA: 121+25 bp
miR-149 C>T (rs2292832) Forward: 5′-CGAGGCTCCCAGGCCTTC-3′ AluI TT: 224+66 bp
Reverse: 5′-CTGCAGGTTCTGAGGGGCT-3′ CT: 224+153+71+66 bp
CC: 153+71+66 bp
miR-196a2 T>C (rs11614913) Forward: 5′-CCCCTTCCCTTCTCCTCCAGATA-3′ MspI TT: 149 bp
Reverse: 5′-CGAAAACCGACTGATGTAACTCCG-3′ CT: 149+125+24 bp
CC: 125+24 bp
miR-146a G>C (rs2910164) Forward: 5′-CATGGGTTGTGTCAGTGTCAGAGCT-3′ SacI GG: 147 bp
Reverse: 5′-TGCCTTCTGTCTCCAGTCTTCCAA-3′ AG: 147+122+25 bp
AA: 122+25 bp

*The highlighted nucleotide was included to produce a restriction site to detect and digest by the corresponding restriction enzyme.

Abbreviation: miRNA, microRNA.

Table 3

Genotype and allele frequencies of the miR-499A>G, miR-149C>T, miR-196a2T>C, and miR-146aG>C polymorphisms in HCC patients and controls

alm-39-58-i003
SNP (rs) Genotype HCC patients Controls P* OR (95% CI)
N (%) N (%)
miR-499 (rs3746444) GG 39 (39) 51 (42.5) 0.59 1.16 (0.65–2.06)
AG 40 (40) 32 (26.7) 0.52 0.55 (0.30–1)
AA 21 (21) 37 (30.8) 0.09 1.68 (0.87–3.26)
G allele 118 (59) 134 (55.8) 0.50 0.88 (0.59–1.31)
A allele 82 (41) 106 (44.2) 0.50 1.14 (0.76–1.69)
miR-149 (rs2292832) TT 42 (35) 35 (35) 1 1 (0.55–1.81)
TC 58 (48.3) 41 (48) 0.27 0.74 (0.42–1.31)
CC 20 (16.7) 24 (24) 0.17 1.58 (0.77–3.23)
T allele 142 (59.1) 111 (55.5) 0.43 0.86 (0.58–1.28
C allele 98 (40.9) 89 (44.5) 0.43 1.16 (0.78–1.73)
miR-196a2 (rs11614913) TT 17 (17) 20 (16.7) 0.94 0.98 (0.45–2.10)
TC 57 (57) 59 (49.2) 0.24 0.73 (0.41–1.29)
CC 26 (26) 41 (34.2) 0.18 1.48 (0.79–2.77)
T allele 91 (45.5) 101 (42) 0.47 0.87 (0.59–1.29)
C allele 109 (54.5) 139 (58) 0.47 1.15 (0.77–1.71)
miR-146a (rs2910164) GG 64 (64) 74 (61.7) 0.72 0.90 (0.50–1.63)
GC 22 (22) 33 (27.5) 0.34 1.34 (0.69–2.62)
CC 14 (14) 13 (10.8) 0.47 0.75 (0.31–1.79)
G allele 150 (75) 181 (75.4) 0.91 1.02 (0.65–1.62)
C allele 50 (25) 59 (24.6) 0.91 0.98 (0.62–1.55)

*P values were obtained using chi-square tests and Fisher's exact tests by comparing corresponding rows with the sums of the other rows.

Abbreviations: OR, odds ratio; HCC, hepatocellular carcinoma; CI, confidence interval; SNP, single nucleotide polymorphism.

Table 4

Genotype and allele frequencies of the miR-499A>G, miR-149C>T, miR-196a2T>C, and miR-146aG>C polymorphisms in male HCC patients and controls

alm-39-58-i004
SNP (rs) Genotype HCC patients Controls P* OR (95% CI)
N (%) N (%)
miR-499 (rs3746444) GG 29 (41.5) 36 (51.4) 0.23 1.5 (0.73–3.09)
AG 22 (31.4) 15 (21.5) 0.18 0.6 (0.26–1.36)
AA 19 (27.1) 19 (27.1) 1 1 (0.44–2.25)
G allele 80 (57.1) 87 (62.1) 0.39 1.23 (0.74–2.04)
A allele 60 (42.9) 53 (37.9) 0.39 0.81 (0.49–1.35)
miR-149 (rs2292832) TT 26 (37.1) 33 (47.1) 0.23 1.51 (0.73–3.14)
TC 25 (35.7) 22 (31.4) 0.59 0.82 (0.38–1.77)
CC 19 (27.2) 15 (21.5) 0.43 0.73 (0.31–1.70)
T allele 77 (55) 88 (62.8) 0.18 1.38 (0.83–2.30)
C allele 63 (45) 52 (37.2) 0.18 0.72 (0.44–1.20)
miR-196a2 (rs11614913) TT 7 (10) 11 (15.7) 0.31 1.68 (0.55–5.19)
TC 42 (60) 33 (47.1) 0.12 0.59 (0.29–1.23)
CC 21 (30) 26 (37.1) 0.37 1.38 (0.64–2.96)
T allele 56 (66.6) 55 (39.2) 0.90 0.97 (0.58–1.61)
C allele 84 (33.4) 85 (60.1) 0.90 1.03 (0.62–1.71)
miR-146a (rs2910164) GG 47 (61.7) 44 (62.9) 0.59 0.83 (0.39–1.76)
GC 13 (18.6) 17 (24.3) 0.41 1.41 (0.58–3.43)
CC 10 (14.3) 9 (12.9) 0.80 0.89 (0.30–2.57)
G allele 107 (76.4) 105 (75) 0.78 0.93 (0.52–1.66)
C allele 33 (23.6) 35 (25) 0.78 1.08 (0.60–1.94)

*P values were obtained using chi-square tests and Fisher's exact tests comparing the corresponding rows with the sum of the other rows.

Abbreviations: OR, odds ratio; HCC, hepatocellular carcinoma; CI, confidence interval; SNP, single nucleotide polymorphism.

Table 5

Genotype and allele frequenciwes of the miR-499A>G, miR-149C>T, miR-196a2T>C, and miR-146aG>C polymorphisms in female HCC patients and controls

alm-39-58-i005
SNP (rs) Genotype HCC patients Controls P* OR (95% CI)
N (%) N (%)
miR-499 (rs3746444) GG 10 (33.3) 15 (30) 0.75 0.86 (0.29–2.53)
AG 18 (60) 17 (34) 0.02 0.34 (0.12–0.97)
AA 2 (6.7) 18 (36) 0.006 7.88 (1.54–53.98)
G allele 38 (63.3) 47 (47) 0.045 0.51 (0.25–1.04)
A allele 22 (36.4) 53 (53) 0.045 1.95 (0.96–3.96)
miR-149 (rs2292832) TT 7 (23.3) 9 (18) 0.56 0.72 (0.21–2.51)
TC 13 (43.4) 36 (72) 0.010 3.36 (1.18–9.77)
CC 10 (33.3) 5 (10) 0.009 0.22 (0.06–0.83)
T allele 27 (45) 54 (54) 0.27 1.43 (0.27–2.87)
C allele 33 (55) 46 (46) 0.27 0.70 (0.35–1.39)
miR-196a2 (rs11614913) TT 10 (33.3) 9 (18) 0.11 0.44 (0.14–1.41)
TC 15 (50) 26 (52) 0.86 1.08 (0.40–2.96)
CC 5 (16.7) 15 (30) 0.18 2.14 (0.62–7.82)
T allele 35 (58.3) 44 (44) 0.07 0.56 (0.28–1.13)
C allele 25 (41.6) 56 (56) 0.07 1.78 (0.89–3.59)
miR-146a (rs2910164) GG 17 (56.7) 30 (60) 0.76 1.15 (0.41–3.17)
GC 9 (30) 16 (32) 0.85 1.10 (0.37–3.29)
CC 4 (13.3) 4 (8) 0.44 0.57 (0.11–3)
G allele 43 (71.6) 76 (76) 0.54 1.25 (0.57–2.75)
C allele 17 (28.3) 24 (24) 0.54 0.80 (0.36–1.76)

*For genotypes, P values were obtained using chi-square tests and Fisher's exact tests by comparing the corresponding rows with the sum of the other rows; For alleles, P<0.05 was considered statistically significant; For genotypes, P<0.017 was considered statistically significant (Bonferroni correction).

Abbreviations: OR, odds ratio; HCC, hepatocellular carcinoma; CI, confidence interval; SNP, single nucleotide polymorphism.

Table 6

Genotype and allele frequencies of the miR-499A>G, miR-149C>T, miR-196a2T>C, and miR-146aG>C polymorphisms in HBV-positive HCC patients and controls

alm-39-58-i006
SNP (rs) Genotype HBV-positive HCC patients Controls P* OR (95% CI)
N (%) N (%)
miR-499 (rs3746444) GG 8 (22.8) 51 (42.5) 0.035 2.49 (0.98–6.54)
AG 12 (34.3) 32 (26.7) 0.38 0.70 (0.29–1.69)
AA 15 (42.9) 37 (30.8) 0.18 0.59 (0.26–1.38)
G allele 28 (40) 134 (55.8) 0.019 1.90 (1.07–3.38)
A allele 42 (60) 106 (44.2) 0.019 0.53 (0.30–0.94)
miR-149 (rs2292832) TT 7 (20) 35 (35) 0.098 2.15 (0.79–6.05)
CT 16 (45.7) 41 (48) 0.63 0.83 (0.35–1.92)
CC 12 (34.3) 24 (24) 0.23 0.61 (0.24–1.52)
T allele 30 (42.8) 111 (55.5) 0.068 1.66 (0.93–2.99)
C allele 40 (57.2) 89 (44.5) 0.068 0.60 (0.33–1.08)
miR-196a (rs11614913) TT 5 (14.3) 74 (61.7) < 0.001 9.65 (3.26–30.68)
CT 20 (57.1) 33 (27.5) 0.001 0.28 (0.12–0.66)
CC 10 (28.6) 13 (10.8) 0.009 0.30 (0.11–0.85)
T allele 30 (42.8) 181 (75.4) < 0.001 4.09 (2.26–7.42)
C allele 40 (52.7) 59 (24.6) < 0.001 0.24 (0.13–0.44)
miR-146a (rs2910164) GG 17 (48.6) 74 (61.7) 0.16 1.70 (0.75–3.89)
GC 11 (31.4) 33 (27.5) 0.65 0.83 (0.34–2.03)
CC 7 (20) 13 (10.8) 0.23 0.49 (0.16–1.50)
G allele 45 (64.3) 181 (75.4) 0.06 1.70 (0.93–3.13)

*For genotypes, P values were obtained using chi-square tests and Fisher's exact tests by comparing the corresponding rows with the sum of the other rows; For alleles, P<0.05 was considered statistically significant; For genotypes, P<0.017 was considered statistically significant (Bonferroni correction).

Abbreviations: OR, odds ratio; HCC, hepatocellular carcinoma; CI, confidence interval; SNP, single nucleotide polymorphism; HBV, hepatitis B virus.

TOOLS
Similar articles