Abstract
Purpose
Changes in serum biomarkers of cardiac and muscle damage have been studied in ultra-marathon runners for distances up to 308 km. We investigated these biomarker changes following a 622-km super-ultramarathon race.
Methods
A group of men with a mean age of 52.7±4.8 years participated. Blood samples were obtained pre-race, during the race, and post-race, to analyze the aforementioned biomarkers.
Results
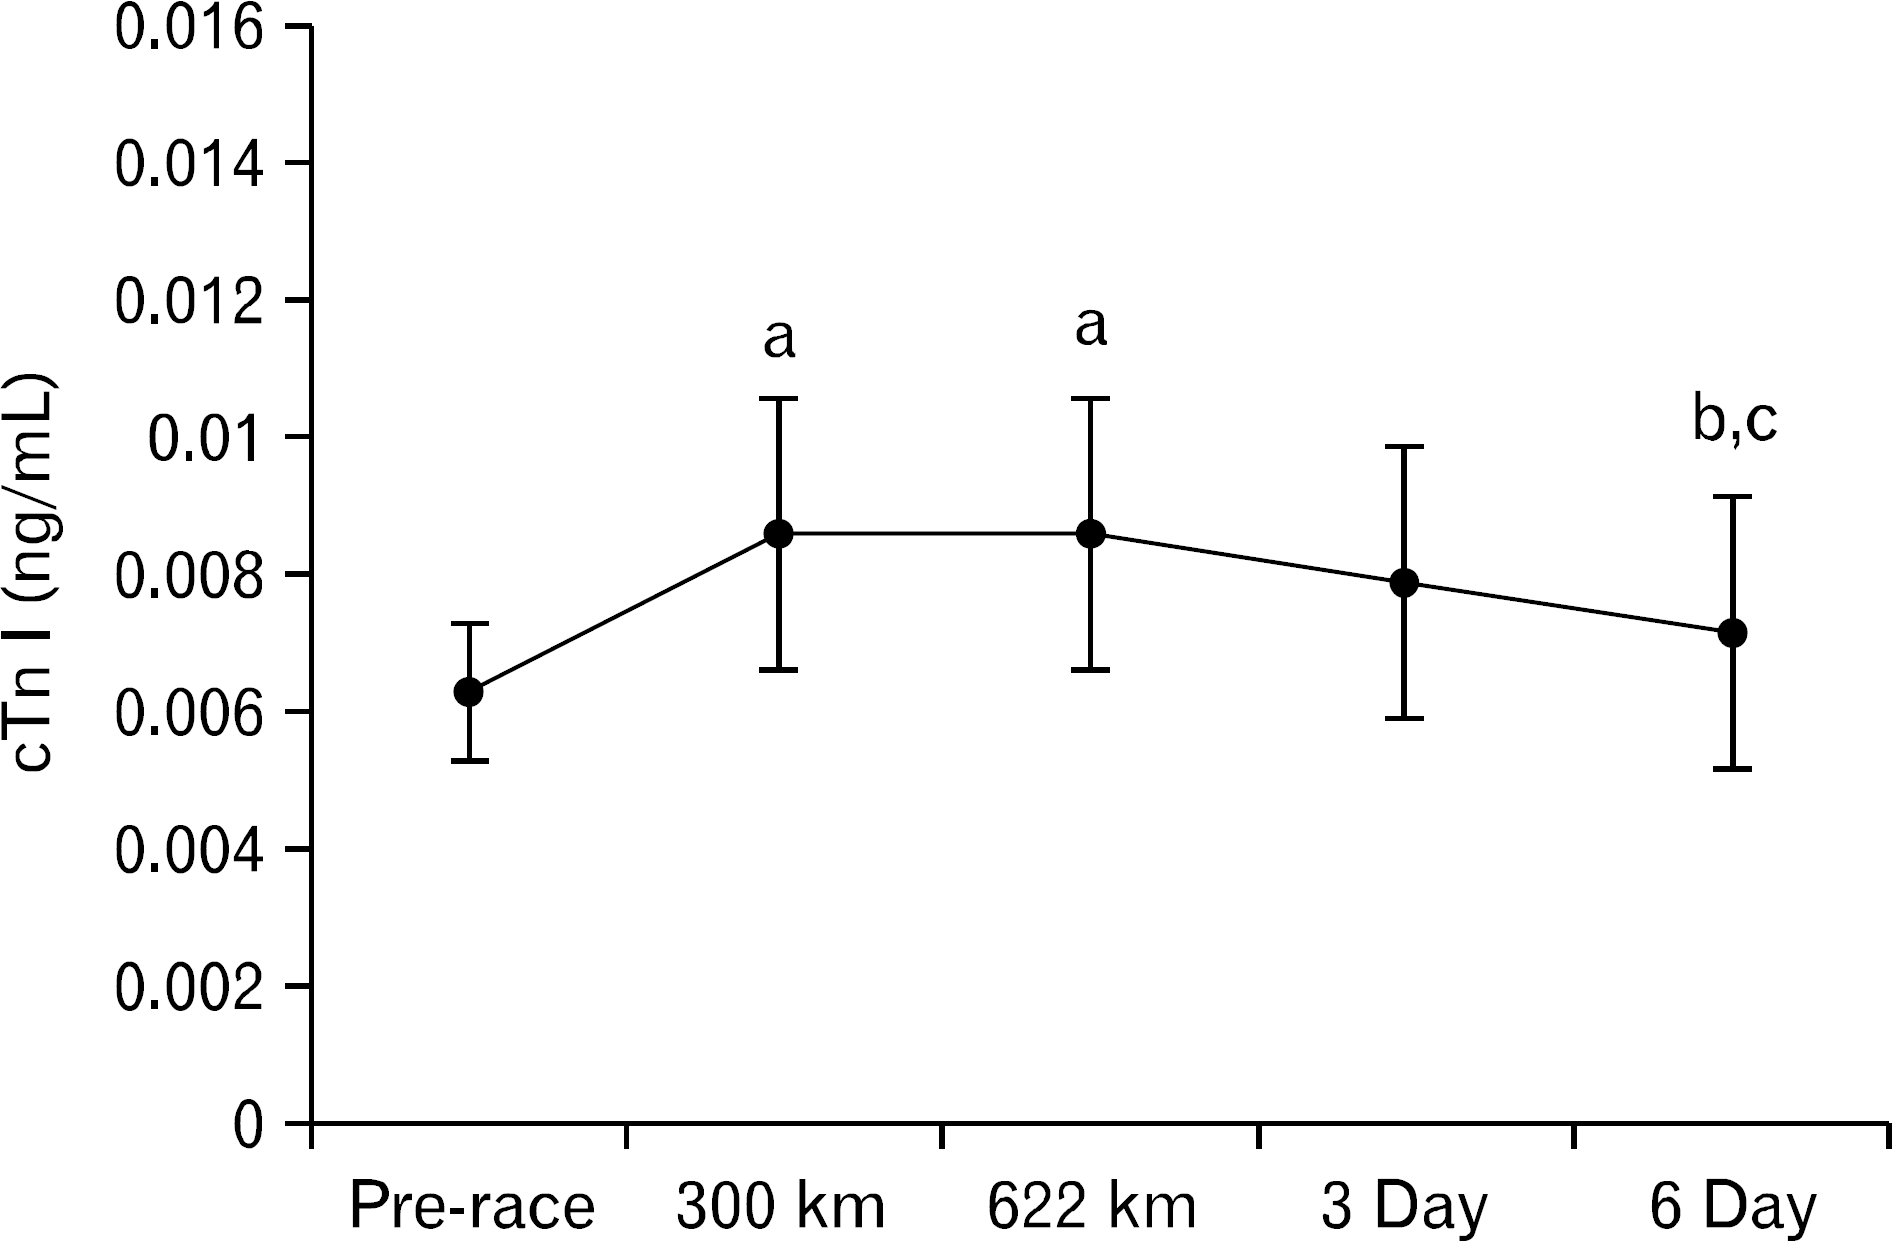
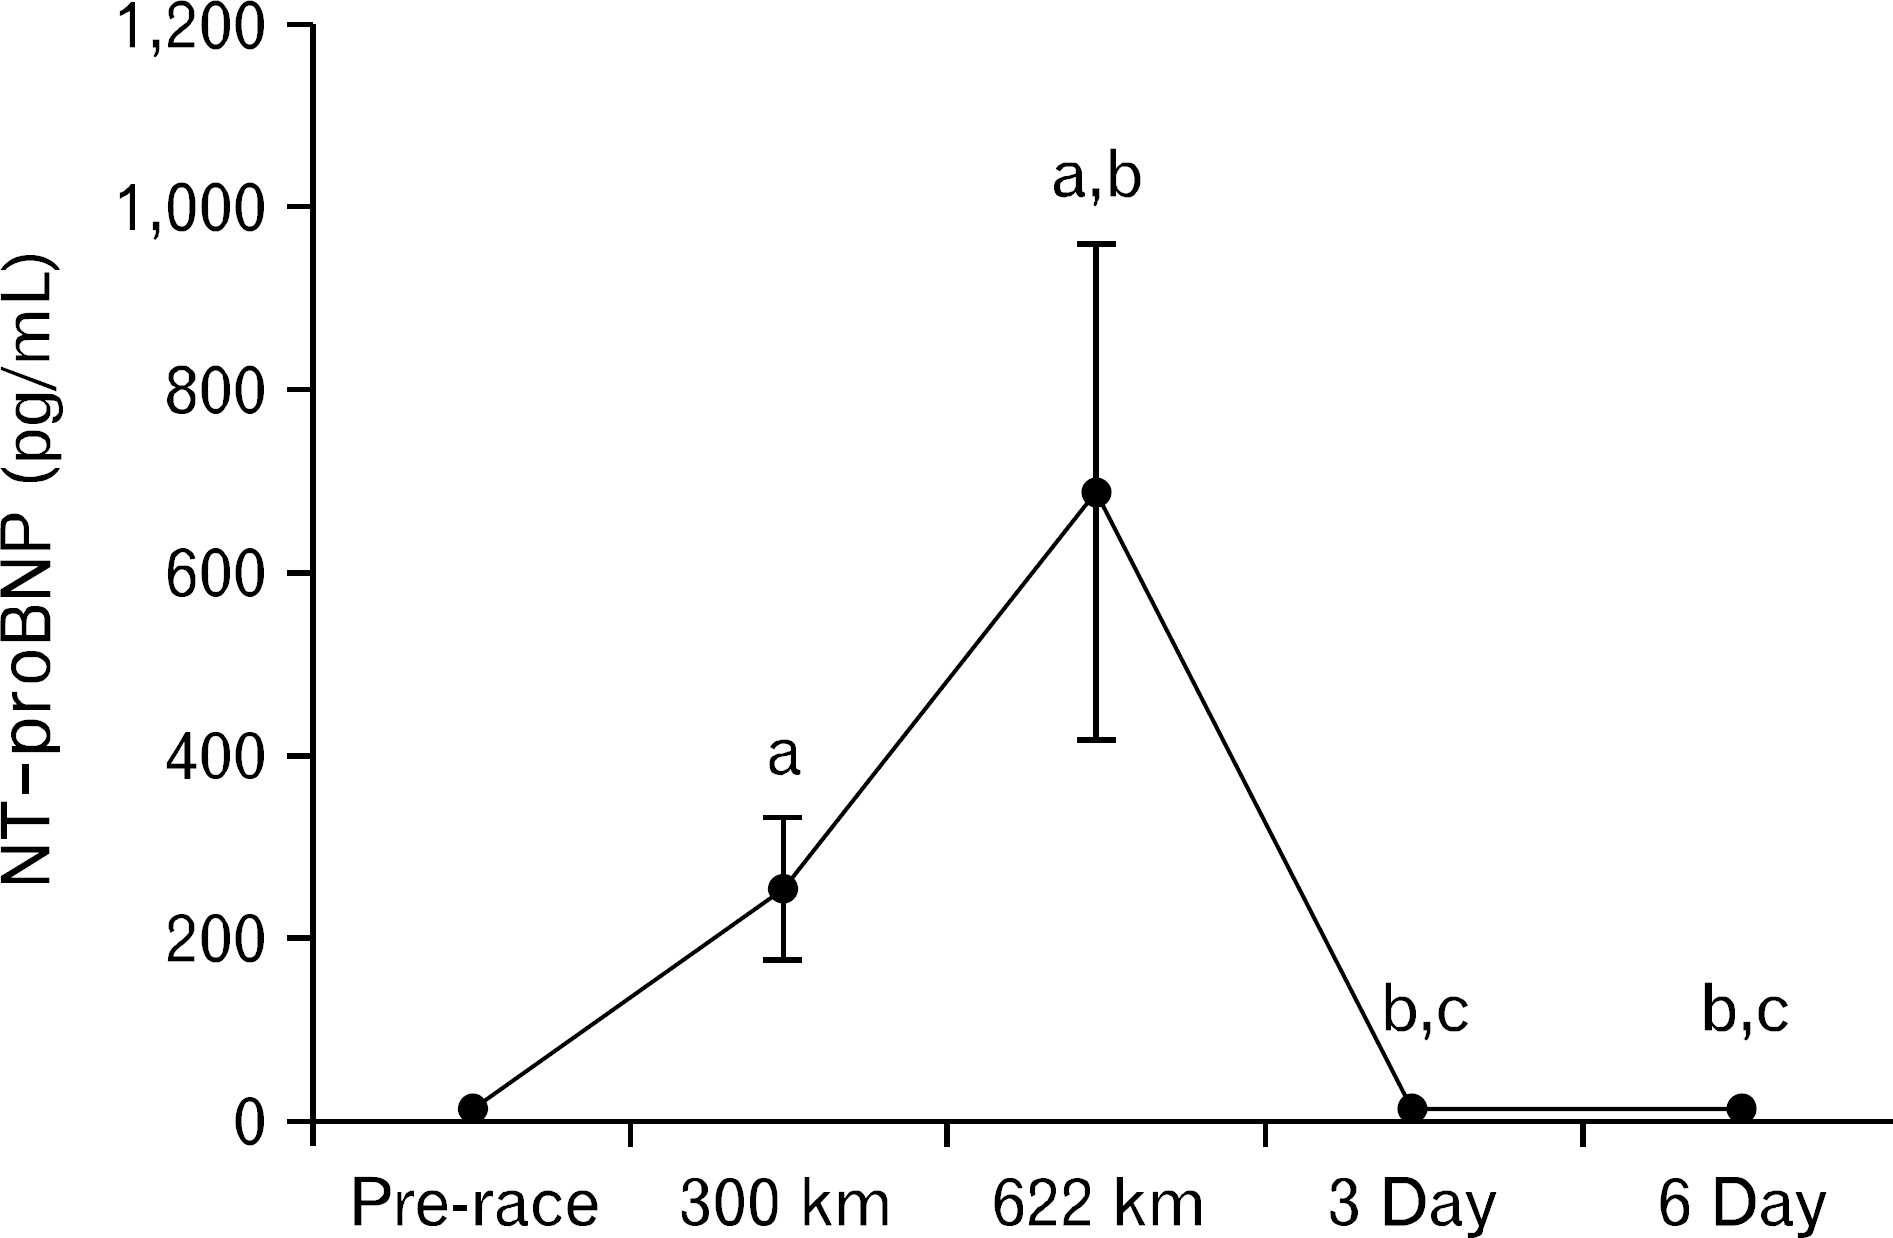
Creatine kinase and creatine kinase-MB (CK-MB) levels increased during the race, and both steadily declined post-race with CK-MB declining at a slower rate. Lactic acid dehydrogenase levels overall were increased over pre-race levels. White blood cell counts increased during the race. Red blood cell decreased from pre-race to 300 km and 622 km. Platelet increased only in the recovery period. High-sensitivity C-reactive protein levels were increased throughout the race and at day 3 compared to pre-race levels. Cardiac troponin I (cTnI) levels increased during the race. N-terminal pro b-type natriuretic peptide (NT-proBNP) levels increased during the race.
REFERENCES
1. Fortescue EB, Shin AY, Greenes DS, et al. Cardiac troponin increases among runners in the Boston Marathon. Ann Emerg Med. 2007; 49:137–43. .e1.

2. Sedaghat-Hamedani F, Kayvanpour E, Frankenstein L, et al. Biomarker changes after strenuous exercise can mimic pulmonary embolism and cardiac injury: a metaanalysis of 45 studies. Clin Chem. 2015; 61:1246–55.
3. Herrmann M, Scharhag J, Miclea M, Urhausen A, Herrmann W, Kindermann W. Post-race kinetics of cardiac troponin T and I and N-terminal pro-brain natriuretic peptide in marathon runners. Clin Chem. 2003; 49:831–4.

4. Clarkson PM. Exertional rhabdomyolysis and acute renal failure in marathon runners. Sports Med. 2007; 37:361–3.

5. Scharhag J, George K, Shave R, Urhausen A, Kindermann W. Exercise-associated increases in cardiac biomarkers. Med Sci Sports Exerc. 2008; 40:1408–15.

6. Legaz-Arrese A, George K, Carranza-Garcia LE, Munguia-Izquierdo D, Moros-Garcia T, Serrano-Ostariz E. The impact of exercise intensity on the release of cardiac biomarkers in marathon runners. Eur J Appl Physiol. 2011; 111:2961–7.

7. Serrano-Ostariz E, Legaz-Arrese A, Terreros-Blanco JL, et al. Cardiac biomarkers and exercise duration and intensity during a cycle-touring event. Clin J Sport Med. 2009; 19:293–9.
8. Serrano-Ostariz E, Terreros-Blanco JL, Legaz-Arrese A, et al. The impact of exercise duration and intensity on the release of cardiac biomarkers. Scand J Med Sci Sports. 2011; 21:244–9.
9. Yoon JH, Park Y, Ahn J, Shin KA, Kim YJ. Changes in the markers of cardiac damage in men following long-distance and ultra-long-distance running races. J Sports Med Phys Fitness. 2016; 56:295–301.
10. Scharhag J, Herrmann M, Urhausen A, Haschke M, Herrmann W, Kindermann W. Independent elevations of N-terminal pro-brain natriuretic peptide and cardiac troponins in endurance athletes after prolonged strenuous exercise. Am Heart J. 2005; 150:1128–34.

11. Scott JM, Esch BT, Shave R, Warburton DE, Gaze D, George K. Cardiovascular consequences of completing a 160-km ultra-marathon. Med Sci Sports Exerc. 2009; 41:26–34.

12. Roth HJ, Leithauser RM, Doppelmayr H, et al. Cardio-specificity of the 3rd generation cardiac troponin T assay during and after a 216 km ultra-endurance marathon run in Death Valley. Clin Res Cardiol. 2007; 96:359–64.

13. Bartzeliotou AI, Margeli AP, Tsironi M, et al. Circulating levels of adhesion molecules and markers of endothelial activation in acute inflammation induced by prolonged brisk exercise. Clin Biochem. 2007; 40:765–70.

14. Kim YJ, Shin YO, Lee JB, et al. The effects of running a 308 km ultra-marathon on cardiac markers. Eur J Sport Sci. 2014; 14(Suppl 1):S92–7.

15. Dill DB, Costill DL. Calculation of percentage changes in volumes of blood, plasma, and red cells in dehydration. J Appl Physiol. 1974; 37:247–8.

16. Wu HJ, Chen KT, Shee BW, Chang HC, Huang YJ, Yang RS. Effects of 24 h ultra-marathon on biochemical and hematological parameters. World J Gastroenterol. 2004; 10:2711–4.

17. Warhol MJ, Siegel AJ, Evans WJ, Silverman LM. Skeletal muscle injury and repair in marathon runners after competition. Am J Pathol. 1985; 118:331–9.
18. Ridker PM, Hennekens CH, Buring JE, Rifai N. C-reactive protein and other markers of inflammation in the prediction of cardiovascular disease in women. N Engl J Med. 2000; 342:836–43.

19. Heber S, Volf I. Effects of physical (in)activity on platelet function. Biomed Res Int. 2015; 2015:165078.

20. Kim HJ, Lee YH, Kim CK. Biomarkers of muscle and cartilage damage and inflammation during a 200 km run. Eur J Appl Physiol. 2007; 99:443–7.
21. Kobayashi Y, Takeuchi T, Hosoi T, Yoshizaki H, Loeppky JA. Effect of a marathon run on serum lipoproteins, creatine kinase, and lactate dehydrogenase in recreational runners. Res Q Exerc Sport. 2005; 76:450–5.

22. Rose LI, Bousser JE, Cooper KH. Serum enzymes after marathon running. J Appl Physiol. 1970; 29:355–7.

24. Pearson JR, Carrea F. Evaluation of the clinical usefulness of a chemiluminometric method for measuring creatine kinase MB. Clin Chem. 1990; 36:1809–11.

25. Thygesen K, Alpert JS, White HD. Joint ESC/ACCF/AHA/WHF Task Force for the Redefinition of Myocardial Infarction. Universal definition of myocardial infarction. Eur Heart J. 2007; 28:2525–38.
26. Shave R, Baggish A, George K, et al. Exercise-induced cardiac troponin elevation: evidence, mechanisms, and implications. J Am Coll Cardiol. 2010; 56:169–76.
27. Kim YJ, Shin YO, Lee YH, et al. Effects of marathon running on cardiac markers and endothelin-1 in EIH athletes. Int J Sports Med. 2013; 34:777–82.

Fig. 1.
Changes in troponin I at each distance and time point. Values are presented as mean±standard deviation. a: significantly different from the pre-race at p<0.05, b: significantly different from the 300 km at p<0.05, c: significantly different from the 622 km at p<0.05. cTnI, cardiac troponin I (normal range, ≤0.78 ng/mL).

Fig. 2.
Changes in NT-proBNP at each distance and time point. Values are presented as mean±standard deviation. a: significantly different from the pre-race at p<0.05, b: significantly different from the 300 km at p<0.05, c: significantly different from the 622 km at p<0.05. NT-pro BNP, N-terminal pro b-type natriuretic peptide (normal range, ≤125 pg/mL).

Table 1.
Characteristics of dem respiratory fitness in study partici ographics and cardio-ipants (n=10)
Table 2.
Changes in the bio-markers of cardiac and muscle damage at each distance and time point
| Factor | Pre-race | 300 km | 622 km | 3 Day | 6 Day |
|---|---|---|---|---|---|
| CK (IU/L) | 112.1±37.6 | 2.369.0±758.1∗ | 2,252.3±700.8∗ | 240.5±156.0†,‡ | 106.1±40.3†,‡ |
| CK-MB (ng/mL) | 2.6±1.3 | 36.8±18.7∗ | 45.8±17.0∗ | 8.1±5.2∗,†,‡ | 3.3±1.4†,‡,§ |
| CK-MB/CK ratio | 0.02±0.01 | 0.02±0.01 | 0.02±0.01 | 0.03±0.02 | 0.03±0.01 |
| LDH (IU/L) | 327.5±35.3 | 980.6±372.6∗ | 1,210.8±315.4∗ | 669.5±171.9∗,‡ | 452.1±84.1∗,†,‡,§ |
| hs-CRP (mg/dL) | 0.03±0.03 | 1.32±0.89∗ | 1.67±1.29∗ | 0.24±0.20∗,†,‡ | 0.06±0.06†,‡,§ |
Values are presented as mean±standard deviation. CK: creatine kinase (normal range, 58–348 IU/L), CK-MB: creatine kinase MB (normal range, 0–5.0 ng/mL), CK-MB/CK ratio: normal range, <2.5%), LDH: lactate dehydrogenase (normal range, ≤260 IU/L), hs-CRP: highlysensitive C-reactive protein (normal range, ≤0.3 mg/dL).
Table 3.
Changes in hematological parameters at each distance and time point
| Factor | Pre-race | 300 km | 622 km | 3 Day | 6 Day |
|---|---|---|---|---|---|
| WBC (103/UL) | 6.3±1.1 | 11.9±3.8∗ | 12.0±4.1∗ | 6.9±2.2†,‡ | 6.5±1.2†,‡ |
| RBC (106/L) | 4.5±0.5 | 4.1±0.3∗ | 4.1±0.4∗ | 4.2±0.5 | 4.3±0.5 |
| Hb (g/dL) | 14.4±1.5 | 13.1±0.7∗ | 12.8±1.1∗ | 13.6±1.3 | 13.9±1.3‡ |
| Hct (%) | 40.9±3.7 | 38.0±1.9 | 37.9±3.0 | 39.9±3.2 | 40.8±3.4 |
| Platelet (×103/L) | 211.4±54.3 | 207.8±49.0 | 224.8±45.5 | 287.3±62.0∗,†,‡ | 293.8±78.0∗,†,‡ |


 PDF
PDF ePub
ePub Citation
 Print
Print


 XML Download