This article has been
cited by other articles in ScienceCentral.
Abstract
Background
The aim of this study was to analyze regional differences in the stress distribution within the distal femur in advanced osteoarthritis (OA).
Methods
Distal femoral specimens with primary OA were obtained from 10 female donor cadavers (mean age, 65 years; range, 53–79). As controls, distal femurs without OA were obtained from 10 age- and sex-matched female cadavers (mean age, 67 years; range, 58–81). The articular surface of the distal femur was divided into anterior, middle, and posterior regions on each condyle. Mechanical properties and microstructure were assessed for each region with micro-computed tomography and finite element model analysis.
Results
The control group showed differences in stress distribution among 6 regions on the distal femur (P=0.037), but there was no regional difference in stress distribution among 6 regions on the distal femur in the advanced OA group (P=0.179).
Conclusions
Regional stress distribution in the distal femur was different between advanced OA and normal groups. There were no regional differences in stress distribution in the advanced OA group. Altered loading patterns, bone remodeling, and chemical composition will affect stress distribution.
Go to :

Keywords: Femur, Finite element analysis, Fractures, Osteoarthritis, Stress
INTRODUCTION
Stress shielding is an important factor related with loosening of the implant. If the mechanical strength of the bone is weaker than implant, the loading on a bone decreases and the bone will become less dense and weaker because there is little stimulus for continued remodeling that is required to maintain bone mass. In the manufacturing new implants, information about mechanical strength of bone is important to reduce the stress shielding.
In primary osteoarthritis (OA), larger loads are transmitted to the medial compartment with progression of lateral femoral bowing, and cartilage is usually denuded in the middle and posterior regions of the medial condyle.[
123] Surgeons usually feel that denuded region will be harder than unaffected region, whereas surgeons also found weak subchondral bone or cyst after bone cutting. Author supposed that mechanical strength of the distal femur may be different regionally in the advanced OA, and may increase in the middle and posterior regions of medial condyle. However, author found no study about the regional stress distribution on distal femur in advanced OA.
Author hypothesized that stress on the distal femur may be different regionally in the advanced OA. The analysis of the regional stress distribution was conducted by micro-computed tomography (CT) based on finite element model (FEM) analysis.
Go to :

METHODS
All procedures were approved by the Institutional Review Board (IRB) of our institution (IRB No. KYUH 2017-03-006).
1. Specimen preparation.
Prior to preparation, reviewing patients' history was performed to exclude other relevant knee disorders except primary OA, and any cadavers with a history of knee fracture or with evidence of prior operation during anatomic dissection were excluded from the analysis. Distal femur specimens with primary OA were obtained from ten donors composed of all female and over 50 years old at death (mean age, 65 years; range, 53–79). As controls, distal femur without OA was obtained from gender matched and over 50 years old (mean age, 67 years; range, 58–81). In OA femur specimen, visible inspection showed the typical features of advanced OA. These feature included erosion of cartilage down to exposed subchondral bone (International Cartilage Repair Society [ICRS] grade 4), osteophytes.[
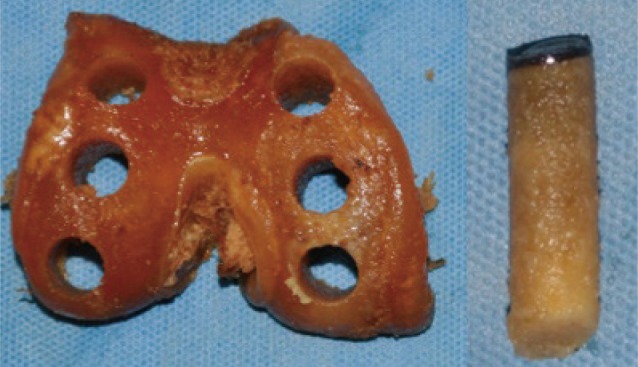
4] Control femur specimen without OA had no macroscopic visual pathology or history of musculoskeletal disease, and they had intact cartilage surface. Articular surface of distal femur was divided with anterior, middle, posterior regions at each condyle. A 10 mm inner diameter cylindrical saw was used to acquire trabecular bone core from 6 regions (
Fig. 1). The cancellous bone was collected with diameter of 10 mm and length of 10 mm, and we further cut 2.5 mm below the subchondral bone plate to avoid cortical plate.
 | Fig. 1Bone specimens were obtained from 6 regions of femoral condyle with using a 10 mm diameter trephine.
|
2. Micro-CT imaging
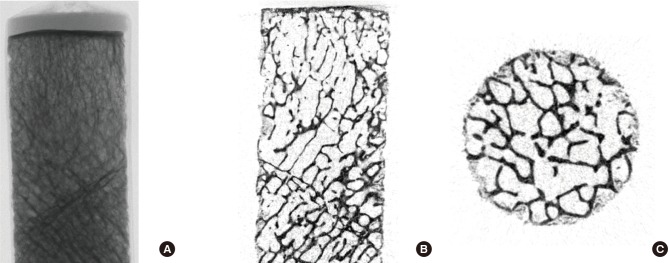
Total 20 specimens were scanned using micro-CT (Skyscan 1172; Skyscan, Aartselaar, Belgium) at 24.9 µm of spatial resolution under 70 kV's voltage and current of 141 µA. For each bone core, total of 1,024 consecutive micro-tomographic slices were acquired. Two dimentional (D) images with 1,024×1,024 pixels were established by an imaging software as shown in
Figure 2. Bone tissues were segmented from the bone marrow at thresholds ranged from 0.552 to 0.17. By employing the micro-CT scanner's built-in software, the two dimensional structural parameters, including the trabecular thickness (Tb.Th; mean trabecular thickness), the trabecular separation (Tb.Sp), and trabecular number (Tb.N, average number of trabeculae per unit length calculated as 1/[Tb.Th + Tb.Sp]) and the 3D structural parameters including the bone volume (BV) fraction (BV/trabecular volume [TV]), which is the ratio of BV (volume of region segmented as bone) and TV (volume of region of interest), the structure model index (SMI; indicator of trabecular structure 0 for parallel plates and 3 for cylindrical rods), and degree of anisotropy (DOA; 1=isotropic and >1=anisotropic) within the 3 volume of interests (VOIs) were calculated by the software (Skyscan).
 | Fig. 2Micro-images taken from a micro-computed tomography: (A) X-ray transmission image, (B) sagittal image, and (C) cross-section image.
|
3. Reconstruction of FEM
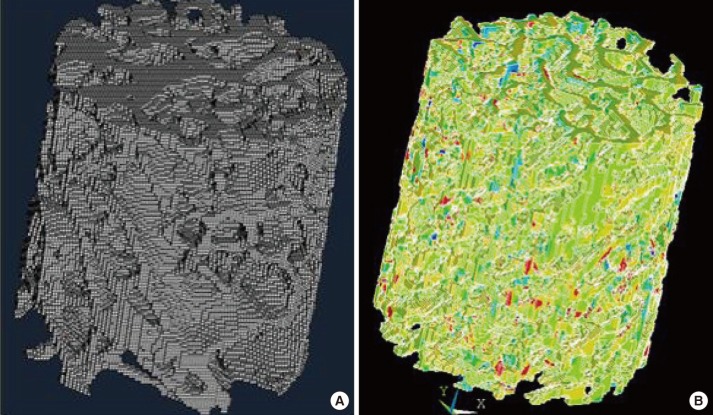
The segmented reconstructions of the VOI were converted to micro-FEMs by converting the voxels that represented the equally shaped bony tissue 8-node brick elements with using a mass-compensated, hexahedron-meshing technique. Tissue element properties were chosen to be liner, elastic and isotropic with a Young's modulus of 10 Gpa and a Poisson's ratio of 0.3 for the all models. Meshing and element reconstruction was made using Bionix (CNTIBIO, Suwon, Korea) software.
Finite element analysis was done using ANSYS 6.1 (Ansys Inc., Canonsburg, PA, USA) software. Boundary condition is applied at a strain of 1%, in which at the bottom face the displacements in the vertical direction were constrained, but all other faces of the cube were unconstrained. Mechanical parameter, yield stress (Mpa) was calculated with ANSYS 10.0 (
Fig. 3). Yield stress is the point on the stress-strain curve at which plastic deformation begins to occur, which is calculated here using the 0.2% offset rule.[
5]
 | Fig. 3Finite element (FE) analysis of trabecular bone. (A) The 8 node hexahedron mesh model. (B) Confined FE model.
|
4. Statistics
We used SPSS version 17.0 (SPSS Inc., Chicago, USA). Mann-Whitney U-test and Kruskal-Wallis test were used. Power analysis indicated that a sample size of 10 distal femur provided 90% power (β=0.1; α=0.05) to detect a significant regional difference of the yield strength using Kruskal-Wallis test. For all statistical analyses, exact P-values were given and a P-value <0.05 was considered to be significant.
Go to :

RESULTS
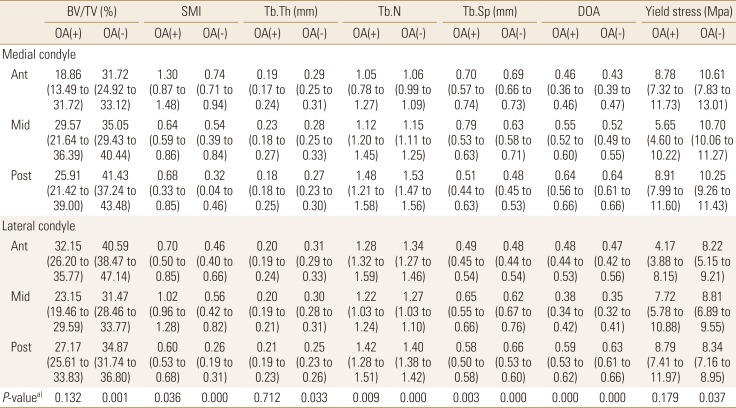
In the control group, there was regional difference of stress distribution among 6 regions on the distal femur (
P=0.037) but, there was no regional difference of stress distribution among 6 regions on the distal femur in the advanced OA group (
P=0.179) (
Table 1). There was significant regional difference in BV/TV, SMI, Tb.Th, Tb.Sp, Tb.N, and DOA in the control group as shown in
Table 1. In the advanced OA group, BV/TV, SMI, and Tb.Th showed no regional difference (
P=0.132,
P=0.036,
P=0.712) but, there was significant regional difference in Tb.Sp, Tb.N, and DOA (
P=0.003,
P=0.009,
P=0.000). Within the medial condyle, there was no regional difference of yield stress and all microstructural measures in the control group, but there was regional difference of yield stress and all microstructural measures except DOA in the advanced OA group as shown in
Table 2. In the middle region of medial condyle, OA group showed a decrease in BV/TV, SMI, and Tb.Th and yield stress and an increase in SMI and Tb.Sp. compared to the control group as shown in
Table 3.
Table 1
Summary of the mechanical and microstructural measures (median, interquartile range) on the 6 regions of osteoarthritis and control groups


Table 2
Comparison of mechanical and microstructural measures (median, interquartile range) between osteoarthritis and control groups within medial condyle


Table 3
Comparison of mechanical and microstructural measures (median, interquartile range) between osteoarthritis and control groups in middle region of medial condyle


Go to :

DISCUSSION
Author hypothesized that stress distribution on the distal femur may be different regionally in the advanced OA and it may increase in the middle and posterior regions of medial condyle. However, our results showed no regional differences in stress distribution among the 6 regions of the distal femur, and also within the medial compartment. Author postulated that the change of microstructure and chemical composition according to OA progression would have influence on the distribution of regional stress in advanced OA.
In this study, middle region of medial condyle, usually most severely affected region in primary OA, showed the change of microstructure and yield stress, rather the OA specimen tends to have a lower yield stress compared with non-OA group as shown
Table 3. This finding is consistent with that of Li and Aspden [
3] who found that OA bone had a lower compressive strength compared with both normal and osteoporotic bone. Brown et al.[
6] also reported the cancellous bone mass in the femoral head during advanced OA is neither stiffer nor stronger than in normal cancellous bone.
Interestingly, in this study, Tb.Th is decreased in advanced OA as shown
Table 3. This changes was different from the change in early OA. Ding et al.[
7] reported an increased thickness in tibial trabecula during early OA. Boyd et al.[
8], in a study of distal femur structural in early OA, reported increasing Tb.Th indicating a process of filling of trabecular remodeling cavities.[
9] These results may be explained by the thickening of trabecula in early OA as early compensation for the decrease in mechanical stress.[
1011] However, in advanced OA, the thickening showed axial rearrangement against the altered mechanical stress. In the process of trabecular rearrangement, trabecular absorption results in a decrease of Tb.Th, and an increase of Tb.Sp and DOA.[
121314]
Although author did not investigate the regional composition of bone matrix, the changes in composition of bone matrix may be associated with altered stress distribution.[
15] Studies in trabecular bone sampled from femoral heads with end-stage OA indicate that under advanced clinical stages, the matrix of trabecular bone shows marked qualitative variation from both healthy and less severely affected bone.[
1415] Brown et al.[
6] reported that the overall mineral-to-collagen ratio was decreased in OA bone. In our previous study using Raman spectroscopy, we found that the maximum intensity of the phosphate, amide I, and α helix-to-random coil varied significantly between OA and control group.[
16]
There are some limitations of the study. First, the specimens of this study were all primary OA. The findings have a limited application to secondary OA (e.g., post-traumatic OA, rheumatoid arthritis) due to differences in pathogenesis of OA. Second, medical college are dependent on unclaimed bodies as voluntary donation was few. We did not have enough number of cadavers to match the ratio of male to female between OA group and control group. Therefore, we planned and enrolled only female cadavers because symptomatic primary OA is more prevalent in female.[
5] Therefore, this findings have a limited application to male population. Third, we did not evaluate the degree of deviation from normal mechanical axis of low extremity, which would have influence on the load distribution of knee joint. Fourth, in general, due to the small sample size, the statistical results require cautious interpretation, despite significant changes detected.
Go to :

CONCLUSIONS
Regional stress distribution is different from advanced OA group and normal group on the distal femur. There was no regional difference of stress distribution in the advanced OA. Altered loading patterns, bone remodeling and chemical composition will affect the change of stress distribution.
Go to :


 PDF
PDF ePub
ePub Citation
 Print
Print


 XML Download