

 PDF
PDF ePub
ePub Citation
 Print
Print


INTRODUCTION
Stomach cancer poses a serious burden to global health.1 Stomach cancer is the third leading cause of cancer death, with an estimated 951600 new stomach cancer cases and 723100 deaths in 2012. Incidence rates are highest in East Asia, particularly in Korea, Mongolia, Japan, and China.2 However, other than Korea and Japan, prevention and screening programs for stomach cancer in these countries are lacking.3 In Korea, stomach cancer is the second most common cancer in both sexes (37.2/100000), the most common cancer in men (54.1/100000), the fourth most common cancer in women (23/100000) (as of 2014), and the third leading cause of cancer death in both sexes (16.7/100000) (as of 2015).4
In 1999, Korea began organized screening for stomach cancer as part of the National Cancer Screening Program (NCSP) at no charge for medical aids recipients (MAP).5 By 2002, the NCSP was expanded to provide screening free of charge for National Health Insurance Service (NHIS) beneficiaries in the lowest 20% income stratum in 2002, and was further expanded to include those in the lowest 50% by 2005. Presently, MAP recipients and NHIS beneficiaries in the 50% or lower income bracket are eligible for stomach cancer screening free-of-charge, while remaining NHIS beneficiaries are eligible to undergo stomach cancer screening with a co-payment of 10% of the cost of the procedure.6 Through the NCSP, Korean men and women older than 40 years are eligible for stomach screening via endoscopy or upper gastrointestinal series (UGIS) biennially. Upon implementation of stomach cancer screening in the NCSP, screening rates increased from 7.5% in 2002 to 47.3% in 2012.7 Overall stomach cancer screening rates for both organized and opportunistic cancer screening programs increased annually by 4.2% from 2004 to 2013.8
Inequalities in the use of cancer screening according to socio-economic positions are higher in countries without population-based cancer screening programs.9 Nevertheless, nationwide screening programs do not completely eliminate inequalities.10 In a previous study, income disparities were reported to affect degrees of participation in cancer screening programs in Korea.11 However, this study applied conventional logistic regression instead of inequality indices, and was unable to report trends in changes in noted disparities. Thus, the present study was conducted to evaluate stomach cancer screening rates in Korea and trends therein from 2005–2015 using data collected through a population-based survey. We also assessed social economic status inequalities in stomach cancer screening in Korea using the slope index of inequality (SII) and relative index of inequality (RII) according to education and income levels.
MATERIALS AND METHODS
Study population
Data were derived from the Korean National Cancer Screening Survey (KNCSS). The KNCSS is an annual nationwide, population-based, cross-sectional survey conducted by the National Cancer Center in Korea, and seeks to assess behavioral patterns associated with cancer screening rates for stomach, liver, colorectal, breast, and cervical cancers. Eligible participants in the KNCSS include cancer free males aged 40 years or over and cancer free females aged 30 years or over. Informed consent was obtained from all participants. Details on the survey have been described elsewhere.12
We obtained KNCSS data from 2005 to 2015. In the NCSP, individuals aged between 40 to 74 years are targeted for stomach cancer screening. Thus, men and women aged between 40 to 74 years who participated in the KNCSS were included in the present study. The total number of KNCSS participants included in this study was 28913 persons. This study was approved by the Institutional Review Board of the National Cancer Center, Korea (approval number: NCCNCS-08-129).
Measures
Using a structured questionnaire, participants were asked about their experience with stomach cancer screening. The questions included “Have you ever undergone stomach cancer screening?,” “What test did you receive for stomach cancer screening?,” and “When did you receive these tests?” Screening status was defined as “screened” for men and women who underwent UGIS or endoscopy tests within 2 years for stomach cancer screening.
This study used two indicators of socioeconomic status: education level and monthly household income. Education level was categorized as elementary school graduates or lower, middle school graduates, high school graduates, and college graduates or more. Household income was categorized into quartiles. In the KNCSS, monthly household income has been collected as a categorical variable with 13 categories, ranging from 1000 USD to 5000 USD in 2005 and from 1000 USD to 10000 USD since 2006. In Stata (StataCorp, College Station, TX, USA), we used a default quartile function that automatically makes quartile points of household income for a sample according to income categories. Therefore, different cutoff points were applied for different years to divide income levels by quartile. The 1st quartile represents the lowest income group, whereas the 4th quartile indicates the highest income group. For each study year, income levels were divided into four groups as follows: <1500, 1500–1999, 2000–2999, and ≥3000 in 2005 and 2006; <1500, 1500–2499, 2500–3499, and ≥3500 in 2007, 2008, and 2009; <2000, 2000–2999, 3000–3999, and ≥4000 in 2010 and 2011; <2500, 2500–3499, 3500–3999, and ≥4000 in 2012; and <3000, 3000–3999, 4000–4999, and ≥5000 in 2013, 2014, and 2015.
Statistical analysis
Consecutive stomach cancer screening rates over 10 years were calculated with adjustment for weight reflected age structures of the Korean population for each study year. Weighted screening rates are presented as annual percent changes (APCs) within a 95% confidence interval (CI) to reflect significantly changing trends in stomach cancer screening rates. APCs were estimated for levels of each socioeconomic variable, fitted by SEER*Stat software from the National Cancer Institute (Bethesda, MD, USA).
To evaluate inequalities among subgroups in regards to participation in stomach cancer screening, education level and income level were considered. As indexes of inequality, SII and RII were calculated. To calculate SII, the respective social groups were first ordered from lowest to highest. Each social-group category covers a range in the cumulative distribution of the population and is given a score based on the midpoint of its range in the cumulative distribution in the population. SII is obtained via regression of the stomach cancer screening rates on the mean relative rank of education and income variables. SII is interpreted as the absolute difference in health status between the bottom and top of the social group distribution.1314 When the SII value equals zero, it means there is no inequality, and when the SII value is greater or less than zero, it means that stomach cancer screening rates are higher in the advantaged subgroups or in the disadvantaged subgroups, respectively. Dividing SII by the mean population health provides a relative inequality measure, RII. Its interpretation is similar to SII, but it measures proportionate, rather than absolute, increases or decreases in health between the highest and lowest socioeconomic groups.13 Thus, an RII value greater than one indicates higher rates of stomach cancer screening in high socioeconomic groups. An RII value equal to 1 indicates no inequality in stomach cancer screening, whereas an RII value less than one indicates higher rates of stomach cancer screening in low socioeconomic groups.
Forest plotting was applied to depict the obtained SII and RII values and to visualize statistically significant changes in trends for educational and household income inequalities in stomach cancer screening uptake. Pooled estimates of SII and RII across study years were also calculated. All statistical analyses were weighted according to age structures of Korean men and women in each corresponding year using data from Statistics Korea, and were performed using SAS statistical software (version 9.3; SAS Institute Inc., Cary, NC, USA).
RESULTS
Characteristics of the study population
Baseline characteristics of the study population in the KNCSS from 2005 to 2015 are presented in Table 1. Regarding sex ratio, men and women began to comprise 50% of the total study population in the latter half of the study years, with little differences by year. Individuals in their 40s and those in their 70s comprised the largest and smallest age groups, respectively. High school graduates were in the majority at around 50% in every study year (Table 1). Regarding socioeconomic characteristics of the study population according to gender, men comprised higher numbers of individuals in the 3rd and 4th quartiles of income, whereas women generally had a higher proportion of individuals in the 1st quartile. Regarding education, fewer men were elementary graduates or lower, and more were college graduates or more. A high number of women were elementary graduates or lower, with fewer college graduates or more especially in the first half of the study years (Supplementary Table 1, only online).
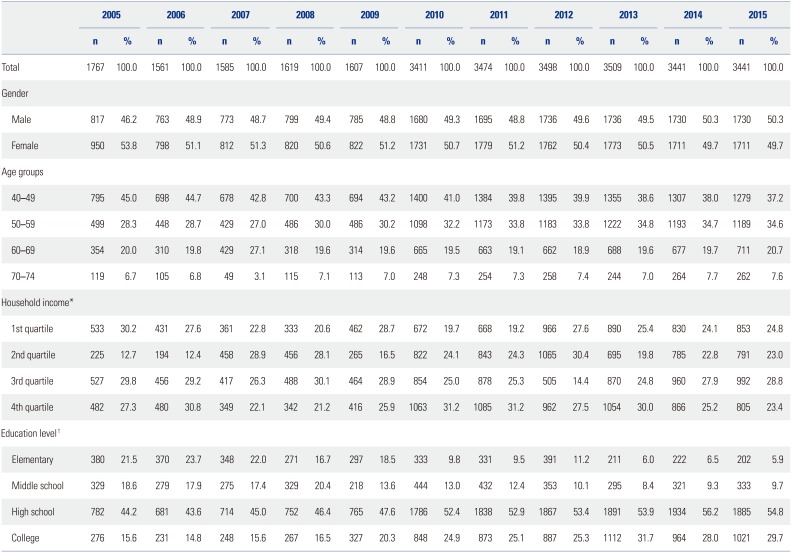
Table 1
Baseline Characteristics of the Study Population in the Korean National Cancer Screening Survey, 2005–2015
![]()
Stomach cancer screening rate and annual percentage changes
Overall stomach cancer screening rates increased continuously from 2005 to 2015. In subgroups of age and income level, significant APCs were observed. All subgroups showed increasing trends in stomach cancer screening rate, as represented by positive APC values (Table 2). All subgroups (age, income, and education level) of both men and women showed significant increasing APC trends in stomach cancer screening rate (Supplementary Table 2, only online). For women, however, the magnitude of APC values was relatively lower than that in men generally.
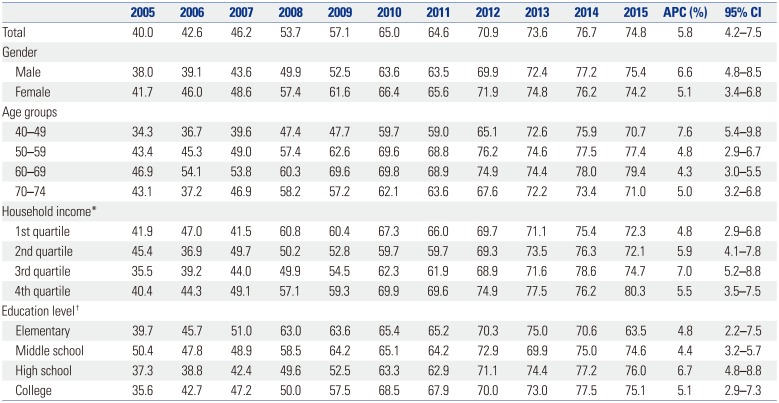
Table 2
Stomach Cancer Screening Rates (%) according to Socioeconomic Status with APCs in the Korean National Cancer Screening Survey, 2005–2015
APC, annual percent change; CI, confidence interval.
*The 1st quartile represents the lowest income group, whereas the 4th quartile indicates the highest income group, †Elementary means elementary graduates or lower, middle school means middle school graduates, high school means high school graduates, and college means college or more.
![]()
Absolute and relative inequality in stomach cancer screening
Socioeconomic inequalities in stomach cancer screening participation are illustrated in Fig. 1. In forest plots summarizing absolute and relative inequalities for the entire study population and study period, inequalities in stomach cancer screening rates according to education and income level were found, and the magnitude of the inequalities for income level was larger than that for education level both in absolute and relative measures.
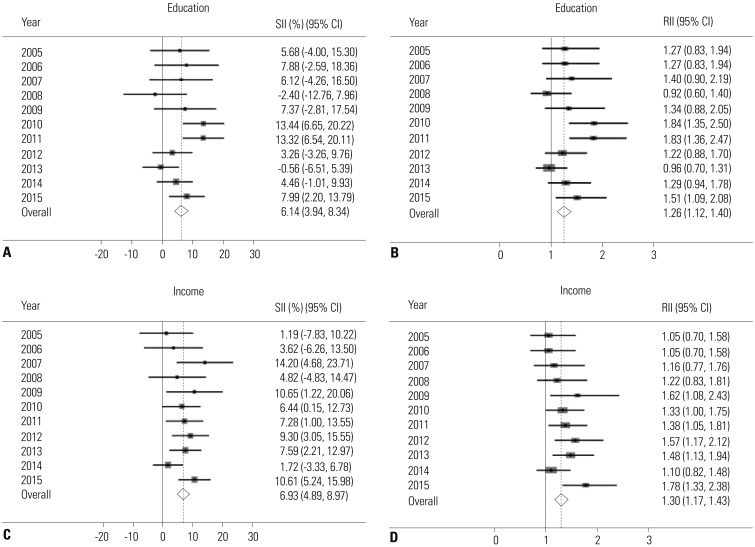
Fig. 1
Absolute and relative inequalities in stomach cancer screening from 2005 to 2015. (A) Absolute educational inequalities in stomach cancer screening rates. (B) Relative educational inequalities in stomach cancer screening rates. (C) Absolute household income inequalities in stomach cancer screening rates. (D) Relative household income inequalities in stomach cancer screening rates. Solid line represents the line of equality; dotted line reflects pooled coefficients. SII, slope index of inequality; RII, relative index of inequality; CI, confidence interval.
![]()
Representing absolute disparity, positive SII values indicated that advantaged individuals with greater education participated more in stomach cancer screening in all study years, except 2008 and 2013, with magnitudes ranging between 3.26% and 13.44% (Fig. 1A). Regarding RII, which represents relative disparity, values significantly greater than 1 indicated that advantaged individuals in regards to education status participated more in stomach cancer screening in 2010, 2011, and 2015 (Fig. 1B). Overall educational inequality was significant with pooled estimates of 6.14% (95% CI, 3.94 to 8.34) in absolute terms and 1.26 in relative terms (95% CI, 1.12 to 1.40).
Concerning household income, significant positive SII values indicated that people who belonged to the higher income group participated more in stomach cancer screening in 2007, 2009, 2010, 2011, 2012, 2013, and 2015 (Fig. 1C). Further, RII values significantly greater than 1 appeared in 2009, 2010, 2011, 2012, 2013, and 2015, further demonstrating that people with higher income participated more in stomach cancer screening (Fig. 1D). Overall pooled estimates for income inequality were statistically significant in both absolute terms (SII=6.93%; 95% CI, 4.89 to 8.97) and relative terms (RII=1.30; 95% CI, 1.17 to 1.43).
The absolute and relative inequalities in stomach cancer screening by gender are described in Supplementary Table 3 (only online). In men, with regard to education, we found statistically significant differences in both absolute and relative overall pooled inequality estimates (pooled SII=7.68%; 95% CI, 4.57 to 10.80, RII=1.25; 95% CI, 1.05 to 1.46). Also, income inequalities were statistically significant in both absolute and relative pooled estimates (pooled SII=6.04%; 95% CI, 3.12 to 8.96, RII=1.26; 95% CI, 1.08 to 1.45). In women, the overall pooled estimate in absolute inequality by education level was significant, with an SII value of 4.47% (95% CI, 1.36 to 7.59). Also, pooled estimates of inequality by income in both absolute and relative terms were significant (pooled SII=7.61%; 95% CI, 4.77 to 10.46, RII=1.37; 95% CI, 1.17 to 1.56). Overall, men showed relatively bigger SII and RII inequality estimates than women by education level. On the other hand, women showed bigger inequality SII and RII estimates than men by income level.
DISCUSSION
This study analyzed stomach cancer screening rates from 2005 to 2015, and identified inequalities in screening participation according to education status and income level. Generally, stomach cancer screening rates continuously increased with time. The noted increase in stomach cancer screening rates was expected due to the implementation of the NCSP in Korea. Continuity in nationwide cancer screening services through the NCSP was deemed to have contributed to the gradual increase in stomach cancer screening rates. Indeed, a previous study reported that participation rates have increased substantially for organized stomach cancer screening, but have remained relatively constant for opportunistic screening. In potential explanation thereof, more advantaged groups have been found to be more likely to participate in both organized and opportunistic screening.5 This is partly explained by the fact that more advantaged individuals are more concerned about their health. Also, the NCSP has continuously expanded its target population who can receive stomach cancer screening free of charge and increased subsidization of screening costs. Additionally, the NHIS and public health centers send invitation letters and make telephone calls to encourage the target population to participate in screening. For these reasons, organized screening could have a positive effect across all groups.
Despite the observed increases of stomach cancer screening, significant inequalities in stomach cancer screening rates according to education status and income level were found in the current study, and the magnitude of the inequality in relation to income level was quite large. Actually, screening rates have been found to be influenced by several factors. According to related studies for other cancers in other countries, even with the long-time presence of universal insurance coverage in Ontario, the disparities in the use of cancer screening procedures by the poor were similar to those in the United States, suggesting that universal coverage is not sufficient to overcome the large disparities in screenings across socioeconomic status.15 Meanwhile, organized screening programs for breast and colorectal cancer appear to have facilitated reductions in relative socioeconomic inequalities in France, even though the results were not statistically significant.16 In the United States, continued differences in breast cancer screening rates related to income level have been found among women.17 In previous studies on participation in stomach cancer screening in Korea, age, education, existence of spouse, drinking, and smoking were found to be influential factors for the use of
stomach cancer screening services.18 Another study showed that education-related inequality decreased, whereas income-related inequality increased, in organized screening and that both income and education-related disparities increased due to the widening of socioeconomic differences in opportunistic screening from 2005 to 2009 in Korea.5 In the current study, education inequality was significantly related to stomach cancer screening among men. Further, income inequalities in stomach cancer screening were noted in both male and female participants. Many reasons could account for income inequalities in stomach cancer screening: While the NSCP ensures stomach cancer screening for all individuals at no or little charge, only those who can dedicate time to undergoing screening can receive screening services. Regarding the observed gender differences in the magnitude of inequalities, especially in regards to income level, the present study indicates that women face greater inequality than men. Thus, the reasons for the gap among women in comparison to men warrant further study.
Our study has a few limitations. Participants were administered self-reported surveys, thereby possibly introducing recall bias in describing past screening experiences or socioeconomic variables. Further, several factors influencing participation in stomach cancer screening, beyond education and income level, such as residence area, were not considered and should be further studied. Specifically it is very meaningful to see the geographical gaps in screening rate in terms of inequality. Thus, further study is needed with additional information (e.g., number of screening units for each region) to explain geographical gaps.
This study identified groups of persons who were more likely to be excluded from the benefits of stomach cancer screening, which has been found in previous studies to be effective in early diagnosis of stomach cancer and mortality reduction. The disparity in screening rates in relation with income level appeared to be quite large. Active intervention through suitable policies targeting these underprivileged groups is needed so that all members of society could share the benefits of screening. Further studies are needed to outline longitudinal trends and identify other factors, such as geographical factors, in relation with disparities in stomach cancer screening.
 XML Download