

 PDF
PDF ePub
ePub Citation
 Print
Print


INTRODUCTION
Actinic keratosis (AK) was an intraepidermal tumor which caused by ultraviolet irradiation-induced skin damage1. Cutaneous squamous cell carcinoma is a widely malignancy and more than 250,000 patients were diagnosed per year2. Actinic keratosis was always deemed as a neoplastic lesion and also a precursor of cutaneous squamous cell carcinoma3. Anwar et al.4 processed a meta-analysis and concluded that approximately 0.075% AK disease transformed to cutaneous squamous cell carcinoma (CSCC). Previous studies also found that ultraviolet irradiation was the main cause for transformation from AK to CSCC, and related mechanisms were ultraviolet irradiation-induced chromosome variation, gene mutation and abnormal signaling pathways56.
Recently, various genes were found to be closely related with the pathogenesis of AK and CSCC diseases. Tumor Protein P53 (P53) was an important tumor suppressor gene, which could regulate cell cycle and induce cell apoptosis7. The mutation rate in patients with CSCC of p53 was reached to 90%, while it in AK cases was reached to 100%8. Neto et al.8 found that AK patients with low expression of P53 were more likely to develop CSCC disease. Besides, Kanellou et al.9 confirmed that mutation of Cyclin Dependent Kinase Inhibitor 2A (p16INK4a) could lead to the inactivation of p16 mediated cell cycle inhibitory path, and further promote AK develop to CSCC. In addition, ultraviolet irradiation could inhibit the transforming growth factor-beta1 (TGF-beta1) signaling pathways and further promote the transformation from AK to CSCC10. By down-regulating the expression level of Fas, phagocytosis function of natural killer cells was inhibited, and transformation from AK to CSCC was promoted11.
Though targeted therapy for CSCC has processed, the actual benefits tend to be small. Recently, microarray expression profiling was used for biomarker screening as an advanced and widely used method. Hameetman et al.12 combined geneome-wide single nudeotide polymorphism analysis, cluster and single-gene analyses and geneset enrichment analyses to research the pathways and genomic alterations involved in the pathogenesis, and found that several pathways activated in squamous cell carcinomas (SCCs) were already activated in AKs. In addition, similar differentially expressed genes were found in AK and SCC disease based on gene expression patterns13. Besides, Nindl et al.14 also used microarray expression profiling to identify differentially expressed genes among normal, AK and CSCC samples, and identified 42 up-regulated genes and 76 down-regulated genes for CSCC diagnosis. However, the molecular mechanism was complicated, and genes were always interacted with each other. In order to strength the diagnosis of CSCC, this study was to compare the gene expression profiles between CSCC and AK, and screen biomarkers for skin disease. Furthermore, Gene Ontology (GO) functional and Kyoto Encyclopedia of Genes and Genomes (KEGG) pathways were enriched. More importantly, pathway relation network and gene co-expression network were constructed to research the potential molecular mechanisms. This method could effectively show the relationship of genes and their pathways.
Go to : 
MATERIALS AND METHODS
Gene expression assay
The expression profile with GSE accession number GSE45216 was deposited in National Center for Biotechnology Information's Gene Expression Omnibus (GEO) database and downloaded with the platform of GPL570 [HG-U133_Plus_2] Affymetrix Human Genome U133 Plus 2.0 Array (Affymetrix, Santa Clara, CA, USA)15. This profile contained 40 samples: 30 cutaneous squamous cell carcinoma patients and 10 actinic keratosis patients.
Data preprocessing
The raw data was preprocessed by three steps: signal analysis, annotation and quality control. Firstly, Robust Multi-chip Average algorithm was chosen for background correction and standardization of probe set16. Afterwards, annotation files on affymetrix official website (http://www.affymetrix.com/support/technical/annotationfilesmain.affx) were referred for annotation of probe set. In addition, normalized unscaled standard errors were utilized for quality control and data standardization.
DEGs screening
Significance analysis of microarrays was processed to screen differently expressed genes (DEGs)17. Each gene was constructed statistical d score to measure the correlation between gene expression level and group setting. Random permutation of sample was applied to simulate the distribution of d score in random state. The threshold of DEGs was p<0.05 and fold change >2.
GO and KEGG pathway enrichment analysis
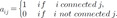
GO analysis was established by Gene Ontology Consortium and applied for qualified description of functions. KEGG was a powerful database for biological metabolic analysis and metabolic network research analysis. In this study, Fisher's exact test was processed for DEGs enrichment by the following Table 1.
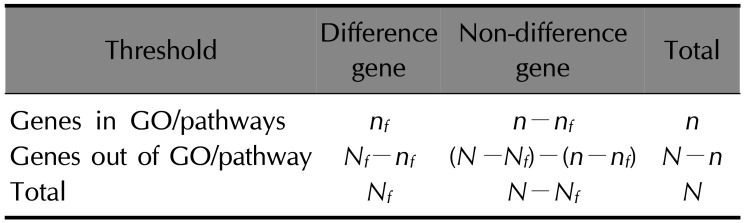
In addition, p-value was calculated by following formula:
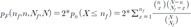
p-value of both enriched GO terms and pathways were corrected by Benjamini-Hochberg step-up method, and false discovery rate (FDR) was obtained. GO terms and KEGG pathways with p<0.05 was regarded as with significance.
Construction of pathway relationship network
Pathway relationship network could systematically reflect the signal conduction and synergism between these enriched pathways. The network was constructed based on KEGG database. The topological properties were calculated as follows:
The degree of node I was calculated according to the following formula: D(i)=∑nj=1aij;
The betweenness of node I was calculated by formula of B(i)=∑s ≠ i ≠ tσst(i)σst . Thereinto, σst represented total number of shortest path between s and t, while σst(i) represented the total number of the shortest path through i.
. Thereinto, σst represented total number of shortest path between s and t, while σst(i) represented the total number of the shortest path through i.Gene co-expression network construction
In order to screen more important genes related to cutaneous squamous cell carcinoma and actinic keratosis, DEGs of GO terms and KEGG pathways were inserted based on same gene symbol. Then, gene co-expression network was constructed according to gene expression data. Learning from scale-free properties, correlation co-efficient between DEGs was used to fit scale-free network. The mean connected degree of gene co-expression network was approximately controlled to 1.
Quantitative RT-PCR (qRT-PCR)
Total RNA were extracted from 20 AK samples and 20 SCC samples by cDNA synthesis kit (Bio-Rad, Veenendaal, The Netherlands) following the operation manual. The primers of screened biomarkers were shown in Table 2. qRT-PCR reaction was processed using SYBR Green supermix. The program included initialization for 6 min at 95℃, 45 cycles of denaturation for 15 s at 95℃, annealing for 30 s at 60℃, elongation for 30 s at 72℃, final annealing for 30 s at 72℃ and DNA melting curve from 55℃ to 95℃ with 0.2℃ increments every 10s. The experiment was repeated for 3 times. Relative gene expression between these samples was analyzed by t-test. p<0.05 was regarded the significant difference.
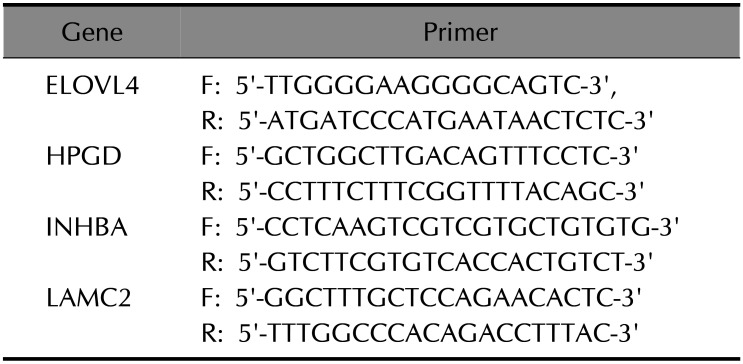
Table 2
The primers of screened biomarkers
![]()
Go to :
RESULTS
DEGs screening
Based on the threshold of p<0.05 and fold change >2, a total of 410 DEGs were screened, including 151 up-regulated and 259 down-regulated DEGs. For instance, leucine-rich repeat containing G protein-coupled receptor 6, calcium regulated heat stable protein 1, 24 kDa and integrin, beta-like 1 (with EGF-like repeat domains) were screened.
GO and pathway enrichment analysis
These screened DEGs were enriched into various functions, such as signal transduction (GO ID: 0007165, FDR=1.78E-06), negative regulation of apoptotic process (GO ID: 0043066, FDR=3.64E-06), brain development (GO ID: 0007420, FDR=1.57E-05) and cell junction assembly (GO ID: 0034329, FDR=1.85E-05) (Table 3).
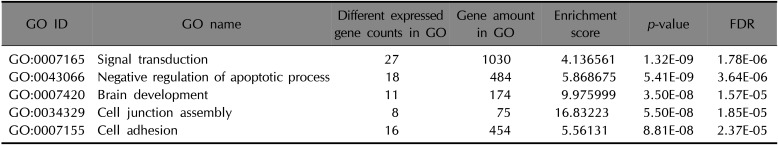
Table 3
Top 5 GO terms enriched by DEGs
![]()
Simultaneously, these screened DEGs also participated into differently pathways, including cytokine-cytokine receptor interaction (Pathway ID: 04060, FDR=6.79E-06), focal adhesion (Pathway ID: 04510, FDR=1.67E-05), rheumatoid arthritis (Pathway ID: 05323, FDR=1.84E-05) and pathways in cancer (Pathway ID: 05200, FDR=0.00012) (Table 4).
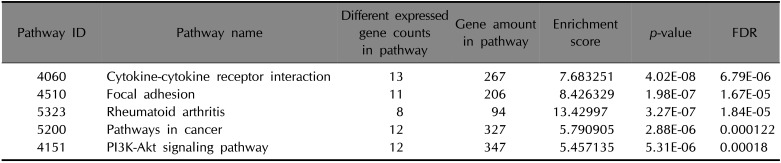
Table 4
Top 5 KEGG pathways enriched by DEGs
![]()
Construction of pathway relationship network
The pathway relationship network was constructed with 27 nodes and 65 edges (Fig. 1). Hub nodes of this network were mitogen-activated protein kinase (MAPK) signaling pathway (degree=17), apoptosis (degree=15), pathways in cancer (degree=14) and focal adhesion (degree=7). Interestingly, pathways in cancer was an up-stream pathway with outdegree of 14, while cytokine-cytokine receptor interaction was a down-stream pathway with indegree of 6.
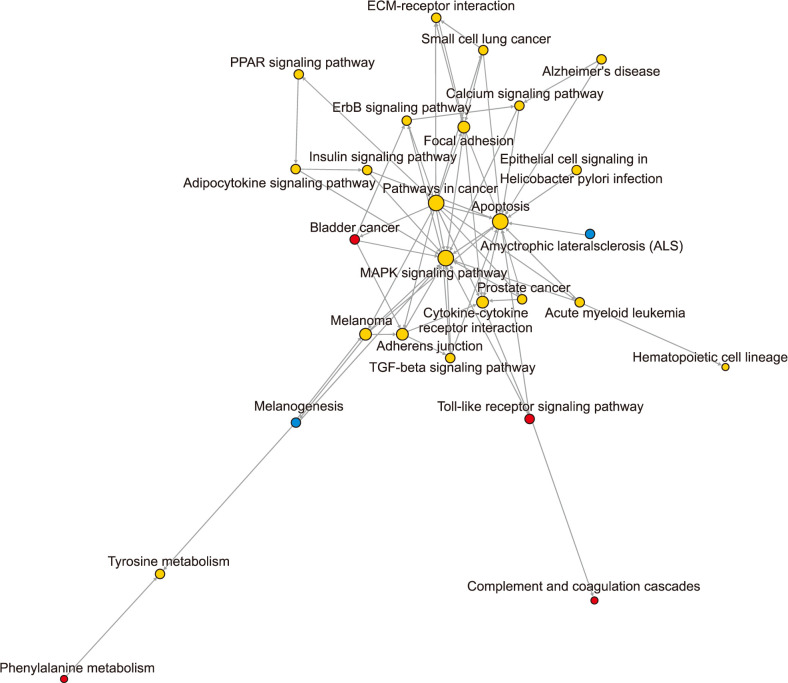 | Fig. 1Pathway relationship network. Red nodes represent pathways involved up-regulated differently expressed genes (DEGs) while blue nodes represent pathways involved down-regulated DEGs. Yellow nodes represent pathways involved both up- and down-regulated DEGs. Arrows represent regulatory directions. ECM: extracellular matrix, PPAR: peroxisome proliferator-activated receptor-gamma, ErbB: epidermal growth factor receptor, TGF: transforming growth factor.
|
Gene co-expression network construction
The gene co-expression network was constructed with 39 nodes and 84 edges (Fig. 2). Thereinto, hub nodes of this network included ELOVL fatty acid elongase 4 (ELOVL4, degree=12), hydroxyprostaglandin dehydrogenase 15-(NAD) (HPGD, degree=9), inhibin, beta A (INHBA, degree=9) and laminin, gamma 2 (LAMC2, degree=8). It was worth mentioning that ELOVL4 and HPGD were with positive relationships. Furthermore, LAMC2 and INHBA were also presented with positive relationships.
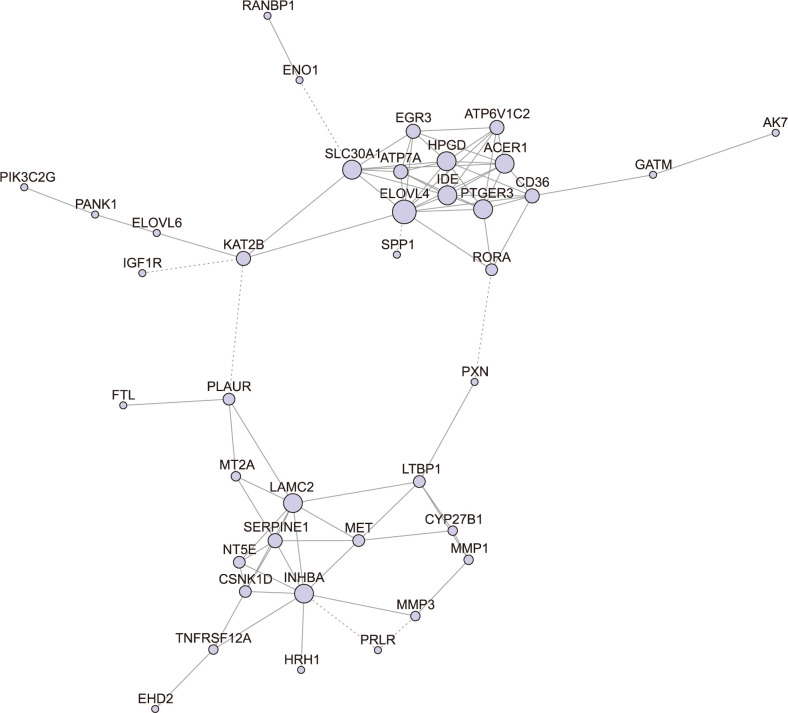 | Fig. 2Gene co-expression network. Violet nodes are DEGs and edges are relationships among these genes. The sizes of these nodes represent degree of these nodes. The positive correlation was represented by solid lines, while the negative correlation was shown by dotted lines. DEGs: differently expressed genes.
|
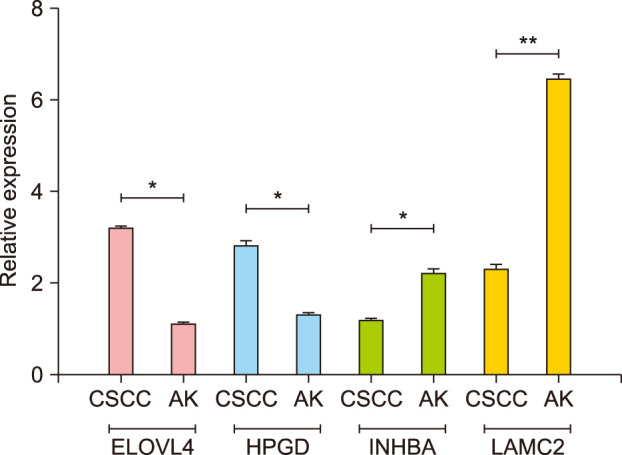
qRT-PCR
As shown in Fig. 3, the expression level of ELOVL4 and HPGD was significantly higher in CSCC samples than that in AK samples (p<0.05), while the expression level of INHBA and LAMC2 in CSCC samples was significantly lower than that in AK samples (p<0.05 and p<0.01, respectively).
Go to :
DISCUSSION
It is well known that AK was a precancerous lesion of CSCC6. Meanwhile, it may also occur in other precancerous lesions or benign conditions besides actinic keratosis18. Causes of Bowen's disease include solar damage, arsenic, immunosuppression, viral infection, chronic skin injury and other dermatoses19. In addition, human papillomavirus was causally related with benign and malignant tumors of oral squamous cell carcinomas. However, the molecular mechanism of transformation from AK to CSCC was the focus of research but rarely examined explicitly. Lambert et al. combined laser capture microdissection with the microarrays to profile 30 CSCC and 10 AKs, screened DEGs and processed gene set enrichment analysis. As the result, he concluded that the MAPK pathway might be pivotal to the transition from AK to CSCC15. In this study, gene co-expression network and pathway relationship network were constructed to research the important DEGs, relationships and related pathways. Especially, ELOVL4, HPGD, INHBA and LAMC2 were screened and might be the key biomarkers for transformation from AK to CSCC.
ELOVL4 encoded a membrane-bound protein which was a member of ELO family, and participated in the biosynthesis of fatty acid20. In this study, this gene was participated in small molecule metabolic process, fatty acid elongation, saturated fatty acid and fatty acid elongation. Fatty acid metabolic process always elicited inflammation response and promoted skin formation21. Moreover, cutaneous fatty acid-binding protein, which was an important protein in the metabolism and transport of fatty acids, might affect lipid metabolism and further induce proliferation and differentiation of keratinocyte22. In 1997, Jone et al.23 have found that E2F was an up-regulator of keratinocyte proliferation, which significantly affected the development of skin tumor. Thereby, we inferred that ELOVL4 might be a key gene in transformation from AK to CSCC by participating into processes related to fatty acids. It was worth mentioning that ELOVL4 and HPGD were in positive relationships and HPGD was screened with higher degree in this study. HPGD encoded a member of the short-chain nonmetalloenzyme alcohol dehydrogenase protein family which was responsible for the metabolism of prostaglandins24. Consistent with previous study, downregulation of HPGD could increase the expression level of PGF2α and PGE2 in AK and malignant epithelial skin cancer, and determine the progression of AK25. In this study, this gene was also found to be enriched in small molecule metabolic process, ductus arteriosus closure and transcriptional misregulation in cancer. In addition, The HPGD gene was in positive relationships with various genes, including PTGER3, ATP6V1C2, EGR3 and ACER1. These DEGs were commonly enriched into metabolic pathways. In addition, qRT-PCR results showed that the expression level of ELOVL4 and HPGD was significantly higher in CSCC samples than that in AK samples. Though few studies researched the role of HPGD in transformation from AK to CSCC, we inferred that HPGD participate in this process by interacting with ELOVL4 or other metabolic pathways related genes.
INHBA and LAMC2 were also screened with higher degree. The expression level of INHBA and LAMC2 in CSCC samples was significantly lower than that in AK samples. Thereinto, INHBA encoded a member of proteins in TGF-beta superfamily26. The encoded preproprotein was proteolytically processed to generate a subunit of the dimeric activin and inhibin protein complexes. Xu et al.27 confirmed that in AK models, TGF-beta 1 could regulate smads pathway and then participate in the expression level of p53 protein. Another study showed that UV radiation might suppress the TGF-beta 1/smads pathways in the process of transformation from AK to CSCC, but not significantly change the expression of p531. Thereby, INHBA might be a key gene in transformation from AK to CSCC by participating in smads pathway. Besides, LAMC2 encoded laminins, a family of extracellular matrix glycoproteins, which were the major noncollagenous constituent of basement membranes. Similarly with the study of Li et al.28, laminin 8 and 10 play important roles in angiogenesis and invasion of CSCC. Besides, expression of basement membrane and cytoplasmic laminins was closely related with invasive potential as well as pathogenesis of CSCC29. In this study, LAMC2 was found to enrich in different functions and pathways, including focal adhesion, PI3K-Akt signaling pathway and cell junction assembly. Consistent with previous studies, the expression level of PI3K and AKT was higher in cutaneous CSCC tissue than in normal, indicating positive correlation between them30. It was speculated that LAMC2 involved in transformation from AK to CSCC by participating in PI3K-Akt signaling pathway.
Through several key biomarkers and their related functions and pathways were analyzed, some limitations still need to be mentioned. Firstly, the mainly results were obtained by bioinformatics, and the key biomarkers were only verified by PCR. Secondly, the expression profile was downloaded from GEO database, only 30 cutaneous squamous cell carcinoma patients and 10 actinic keratosis patients were included. Thirdly, the molecular mechanism of disease is complicated, and the underlining mechanisms including mRNAs and lnRNAs also need to be researched. In the furture, more animal and clinical experiments, such as western blot and targeted therapy will be processed in the next study.
In conclusion, screened genes, including ELOVL4, HPGD, INHBA and LAMC2, played important roles in transformation from AK to CSCC. These genes might be biomarkers for diagnosis of cutaneous squamous cell carcinoma.
Go to :
 XML Download