

 PDF
PDF ePub
ePub Citation
 Print
Print


I. Introduction
The inferior alveolar nerve (IAN) is located within the mandibular canal, passes through the mandibular body, and migrates to the mental foramen. It has three branches, one of which is in the skin of the mental area, and the others are in the lower lip, mucous membrane, and gingiva1. Mandibular canals in the molar area are located close to the apex of the second molar2, bypassing the third molar34. Sagittal split ramus osteotomy (SSRO) was first introduced by Schuchardt in 1942, and is now widely used for orthognathic surgery to correct jaw deformity5. The mandibular canal is a very important structure in SSRO, as there is a high possibility of IAN damage after surgery. The incidence of postoperative neurosensory disturbance (NSD) in the lower lip and mental skin during SSRO is reported to be 30% to 40%6789. There are many reasons for IAN damage during SSRO, including nerve laceration during cortical bone dissection, tearing of the nerve during splitting, or interosseous fixation1011. Unfavorable fractures and contact of the mandibular canal with external cortical bone during SSRO can also cause IAN damage1213. There have been studies reporting the differences in the incidence of NSD according to the distance between the IAN and the buccal cortical bone. Since the location and course of the canal are related to NSD resulting from SSRO, measurement of canal position is very important. However, there is no standardized method for locating the mandibular canal14.
Tsuji et al.15 investigated the position and course of the canal using the computed tomography (CT) of 35 patients. They divided the canals into three groups according to contact with the buccal cortex. The group with bone marrow space was classified as separate. The group without bone marrow space was defined as the contact group, and the group with an indiscernible outer cortical plate was defined as the fusion group. Yamamoto et al.16 classified the contact group and the non-contact group according to contact with the buccal bone along the course of the canal.
Previous studies have classified the mandibular canal in relation to contact with the buccal cortex, and they investigated the degree of postoperative NSD according to this classification. However, there is still a lack of comparisons regarding the course of the canal based on contact with the buccal cortex. This current paper categorized canals according to contact with the buccal cortical bone during canal travel. Furthermore, this is a comparative study assessing the difference in the course of canals in the second and first molar positions according to canal classification.
II. Materials and Methods
Patients who visited Dankook University Dental Hospital (Cheonan, Korea) for jaw deformity correction from January 2016 to December 2016 were enrolled in this study. Skeletal class III patients with bilateral sagittal split ramus osteotomy were included in the study. Patients with the syndrome, previous surgery for facial fracture, surgical repair of cleft lip and palate, poor CT image quality, dentofacial deformity, or loss of the first or second molar were excluded. A total of 58 patients were included in the study. There were 34 males and 24 females with a mean age of 25.7 years.
The measurements were performed on the CT scans of 58 patients. CTs were taken with an Alphard VEGA scanner (Asahi Co., Tokyo, Japan). Prior to the measurements, the axial plane was set parallel to the occlusal plane, which was set as the horizontal reference plane. In the sagittal view, the center was set at the center of the two first molars.
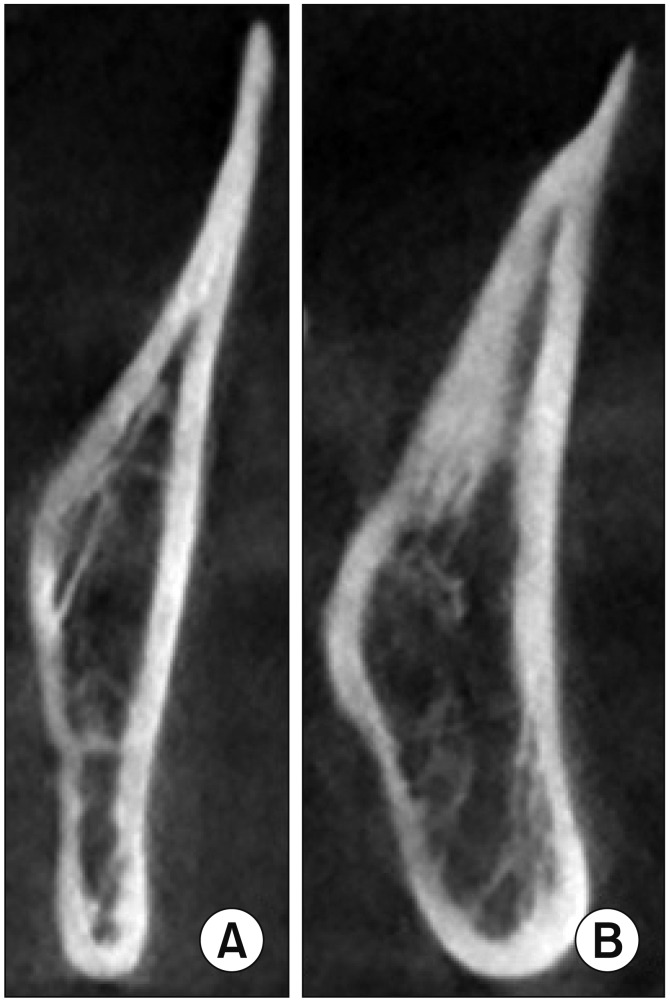
The mandibular canal was classified as the contact group when there was no marrow space between the external cortical bone from the mandibular foramen to the mental foramen in the axial view of the CT. In the separate group, there was no contact with the external cortical bone over the course of the canal, and marrow space was present between the canal and the bone. These groups were respectively defined as Group I or Group II; Group I, contact group: no marrow space between the canal and buccal cortical bone (Fig. 1. A); Group II, separate group: marrow space between the canal and buccal cortical bone.(Fig. 1. B)
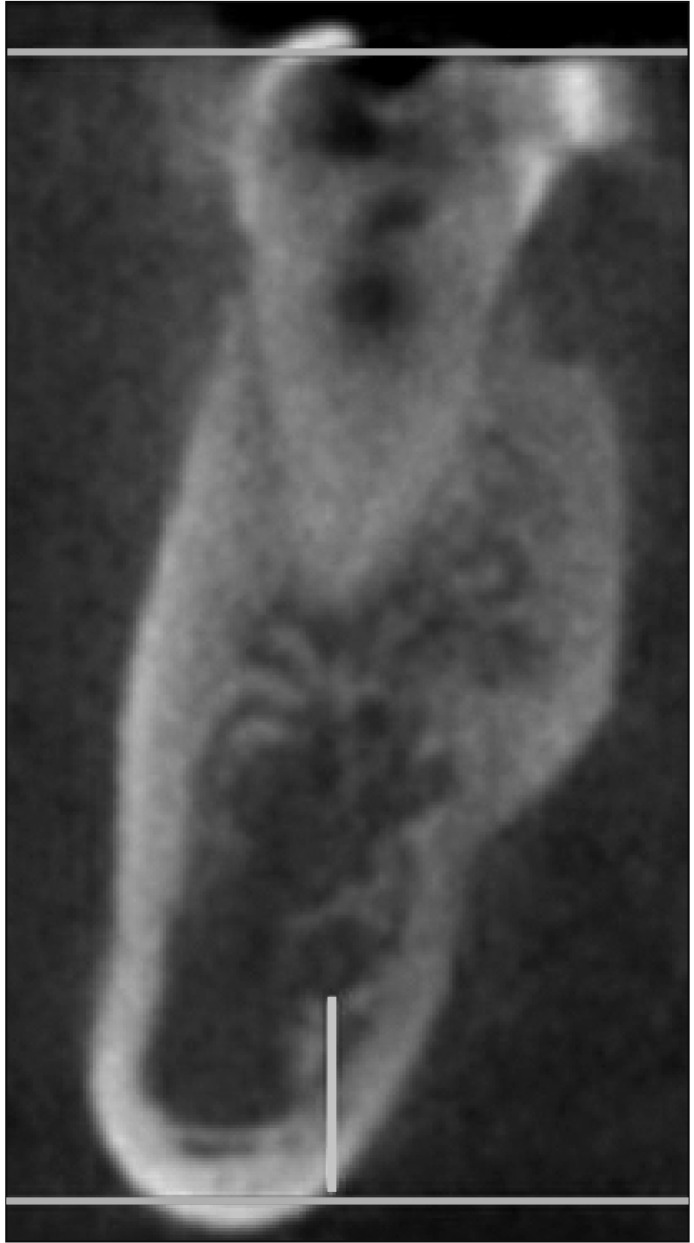
The distance between the buccal margin of the mandibular canal and the buccal cortical margin was measured using a line parallel to the occlusal plane in the distal root tip region of the first molar and second molar in each patient's coronal view. The mandibular thickness was also measured at that height. The distance between the lowest point of the canal and the inferior cortical margin was measured using a line perpendicular to the occlusal plane.
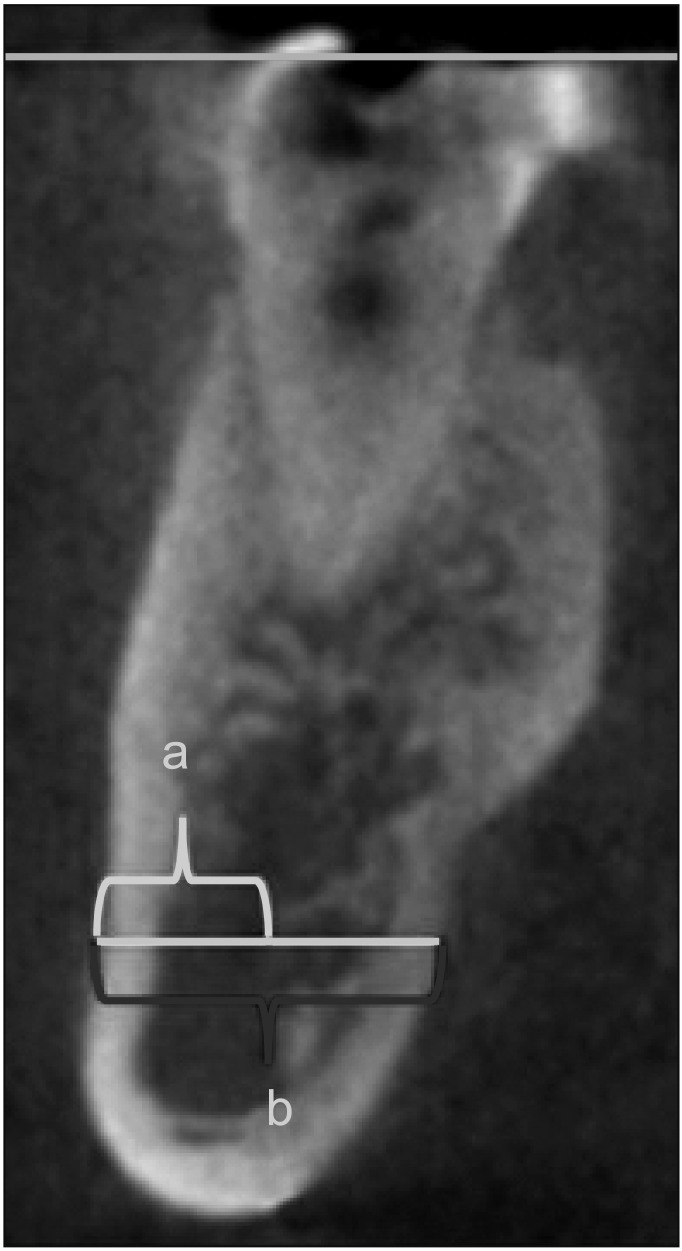
All measured values were compared between the contact group and the separate group at the positions of the second and first molars. The details are as follows (Fig. 2, 3): (1) Length between the outer margin of the mandibular canal and the buccal cortical margin (a); (2) Mandibular thickness at the same level (b); (3) Buccolingual ratio=(a)/(b)×100; and (4) Length between the inferior margin of the mandibular canal and the inferior cortical margin.
IBM SPSS Statistics ver. 21.0 (IBM Co., Armonk, NY, USA) was used for statistical analysis. First, a normality test was performed on the variables. For variables that followed a normal distribution, we compared the mean of each group using Student's t-test. If the variables did not follow a normal distribution, a comparison was made between the two groups using the Mann-Whitney test. A P-value less than 0.05 was considered statistically significant.
III. Results
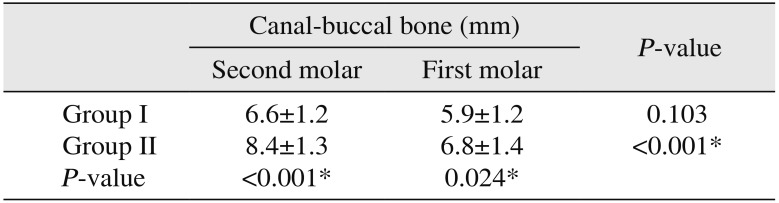
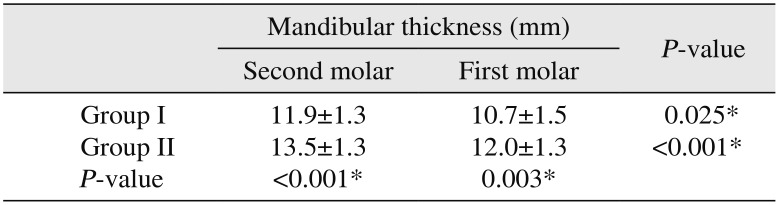
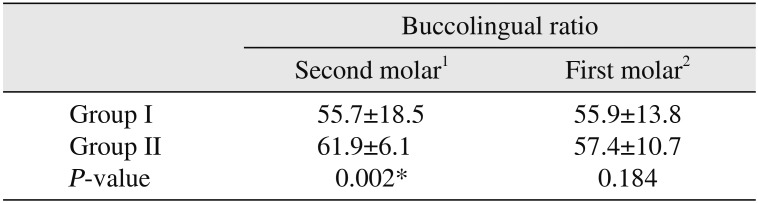
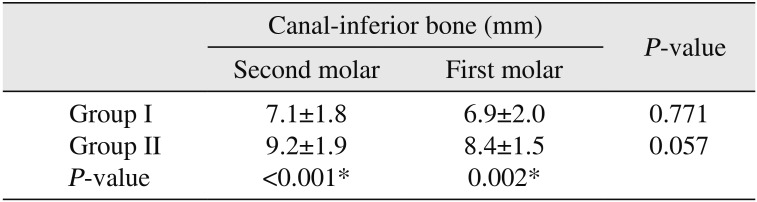
In this study, Group I included a total of 18 patients, and Group II included 40 patients. First, by comparing the values of the second molar, we compared the distance between the buccal margin of the canal and the buccal cortical margin between Groups I and II. The mean values in Group I and Group II were 0.66 cm and 0.84 cm, respectively, and there was a statistically significant difference (P<0.001).(Table 1) The mandibular thicknesses in Group I and Group II were 1.19 cm and 1.35 cm, respectively, and these values were also significantly different (P<0.001).(Table 2) Additionally, the buccolingual positions of the canals were compared based on the buccolingual ratio. The mean value was 55 in Group I and 61 in Group II. The Student's t-test showed a statistically significant difference with a P-value of 0.002.(Table 3) The distance between the inferior margin of the canal and the inferior cortical margin was also compared. In Group I, the mean was 0.71 cm, and in Group II, the mean was 0.92 cm. The P-value was less than 0.001.(Table 4)
Next, the values were compared at the first molar. First, the distance between the buccal margin of the canal and the buccal cortical margin was compared between both groups. The means were 0.59 cm in Group I and 0.68 cm in Group II. A statistically significant difference was seen with a P-value of 0.024.(Table 1) The mandibular thickness was 1.07 cm in Group I and 1.20 cm in Group II (P=0.003).(Table 2) Next, the buccolingual position of the buccal margin of the canal was compared between the two groups. In Group I and Group II, the mean values were 55 and 57, respectively. The P-value was 0.184 when Student's t-test was performed, and no statistically significant difference was noted.(Table 3) Next, the distance between the inferior margin of the canal and the inferior cortical margin was compared. In Group I, the mean was 0.69 cm, and it was 0.84 cm in Group II (P=0.002).(Table 4)
In each group, the differences between the measured values for each tooth were investigated. First, the distance between the buccal margin of the canal and the buccal cortical margin was compared according to tooth position. In Group I, the P-value was 0.103, which was not significant compared to the values of the first molar and the second molar. The P-value in Group II was less than 0.001. The distance between the buccal margin of the canal and buccal cortical bone was significantly longer at the second molar that at the first molar.(Table 1)
Next, mandibular thickness was compared based on the tooth position in each group. In Group I, the P-value was 0.025, and the mandible was significantly thicker in the second molar region. Also, in Group II, the mandible was significantly thicker at the second molar than the first molar, and the P-value was less than 0.001.(Table 2)
The distance between the canal and the inferior cortical bone was compared based on the tooth position in each group. In Group I, the P-value was 0.771, and in Group II, the P-value was 0.057. There was no significant difference based on tooth position in each group.(Table 4)
IV. Discussion
There is no standardized method to measure the mandibular canal's course or position14. Numerous recent studies on SSRO have relied on anatomical data and surgical landmarks obtained from dry human skulls17181920. The advantage of using dry human skulls in measuring the position of the canal and its relationship with the cortical bone is that it can be measured three-dimensionally and can be sectioned in a desired plane and position. However, the dry human skull does not provide information about age, race, or sex, and it shrinks with time, destroying minute structures5.
On the other hand, the advantage of measuring with CT is that it has less distortion, higher resolution, and is fast and simple212223. However, CT sometimes may not clearly depict fine structures, and it is difficult to set a reference point20.
This paper investigates the differences in mandibular canals according to contact with buccal cortical bone in the buccolingual position, the distance from the buccal cortical bone, and the distance from the inferior cortical bone to the canal. Eighteen patients were included in Group I, and 40 were included in Group II.
In this study, Group II exhibited a greater mandibular thickness than Group I in both the second and first molar positions. In addition, when the distance between the buccal margin of the canal and the buccal cortical margin was measured, the distance in Group II was longer in both locations. This indicates that, when the canal is in contact with the buccal cortical bone during its course, the mandible is thinner and the distance to the buccal cortical bone is shorter than in the group without contact.
With regard to the buccolingual ratio of the buccal side of the mandibular canal, Group II was closer to the lingual side than Group I in the second molar position, but there was no significant difference between the groups at the first molar. This indicates that, in the group with contact, the position of the canal up to the second molar area continues to run closer to the buccal bone than in the group without contact in terms of ratio. The difference in this ratio gradually decreases in the first molar region.
When comparing the distance between the canal and inferior cortical margin, the distance was longer in Group II than in Group I in both the second and first molar regions. This indicates that the difference between Group II and Group I is not only significant with regard to the distance to the buccal cortical margin, but also with regard to the distance from the inferior border. Yu and Wong5 reported that the distance between the canal and the buccal cortical bone was longest at the second molar, and that the distance to the inferior cortical margin was also the longest at the second molar, which is consistent with the results of this study.
Levine et al.24 measured the distance between the buccal margin of the canal and the buccal cortical bone and the distance from the canal to the alveolar crest at the location of the first molar. The mean distance to the buccal cortical margin was 4.9 mm, and the mean distance to the alveolar crest was 17.4 mm. They also reported that the distance from the canal to the buccal cortical margin at the first molar was related to race, age, and many other factors.
Promma et al.25 measured the distance from the canal to the buccal cortical margin and to the inferior cortical margin using a bone cutting technique for each tooth in a cadaveric mandible. The distance from the canal to the buccal bone at the second molar was 7.60 mm, and the distance to the inferior bone was 8.89 mm, which was larger than that at the first molar. Nagadia et al.26 studied the position of the canal via CT. In these studies, the second molar region exhibited the longest distance between the canal and the buccal bone, and the buccolingual width of the mandible was the largest in this region. Yoshioka et al.27 measured the distance between the canal and the buccal bone at the second molar area, which was 6.04 mm on average. According to Yu and Wong5, the mean distance between the canal and the buccal bone at the second molar position was 7.2 mm, and the distance to the lower border was 7.6 mm on average. In this study, the distance from the canal to the buccal bone was greater at the second molar than at the first molar, and the buccolingual width of the mandible was also largest at the second molar. Comparing the two groups, Group II showed larger values than Group I for both the distances between the canal and the buccal bone and buccolingual width. Regardless of contact with the canal, both values of the second molar area were larger compared to those of the first molar area.
Yamamoto et al.16 investigated the relationship between the canal and the buccal bone using CT. They categorized the canal into either a contact group when the canal was in contact with the external cortical bone in more than one plane of the CT with no visible marrow space or into a the non-contact group when the canal was not in contact with the external cortical bone and showed marrow space. There were 10 contacts of the 40 rami (25.0%). Yoshioka et al.27 investigated the position of the canal in the second molar region, suggesting that contact of the canal is not related to skeletal class. Huang and Liao28 also found that differences in the ratio of contact/fusion in separate groups were not significant according to the dentofacial relationship. They suggested the closest point between the canal and the buccal cortical bone to be the middle point of the lingula and the border of the anterior ramus. Tsuji et al.15 defined three groups based on canal contact with buccal bone. The separate group had marrow space between the canal and buccal bone, while the contact group had no marrow space. The third fusion group had an unclear outer cortical plate of the canal. They also examined the proportion of each group, with 91.1% for the separate group, 6.1% for the contact group and 2.9% for the fusion group. Although the above reports investigated the relationships between classifications and skeletal relationships according to the canal contact status, the difference in the course of the canal in each group was not investigated.
There have been many studies on the incidence of postoperative NSD according to the distance and relation between the canal and the buccal cortical bone. Yamamoto et al.16 reported that NSD occurred in all patients with contact between the canal and buccal bone when evaluated one year after surgery. Yoshioka et al.29 reported an increase in NSD with a shorter distance from the buccal aspect of the IAN to the outer buccal cortical margin at the second molar. The results of our study showed that Group I was closer to the buccal cortical margin than Group II in the overall course as well as with respect to the area of contact. Also, when comparing the buccolingual position of the buccal margin of the canal from the ramus to the second molar, it was found that the contact group was more biased toward the buccal side. Therefore, the reason for high NSD after SSRO in the contact group is its close proximity to the buccal side in the canal's course to the mental foramen, as well as on the contact site.
A few previous studies have presented guidelines that can be referred to for SSRO in relation to the results of the study on the position of the canal. According to Tsuji et al.15, a vertical cut at the buccal side of the mandible was recommended at the anterior portion of the mandibular angle. Nagadia et al.26 reported that a vertical cut should be performed at the second molar region during SSRO because the distance between the canal and the buccal bone is the largest at the second molar, and they also suggested a safe vertical cutting depth of 4.8 mm. Promma et al.25 conducted a cadaveric study to measure the canal's course and suggested that the vertical cut for SSRO should be performed at the site of the first molar where the canal is the lowest. They also suggested a cutting depth for each tooth location and revealed that, when performing sagittal cutting at the second molar site, the depth was 6.5 mm. Vertical cuts at the first molar region were at a depth of 5 mm on the buccal side and 7.5 mm on the inferior side. In addition, it was recommended that 1 mm of cortical bone be left around the canal during SSRO24.
In our study, there was no difference in the distance between the canal and the inferior cortical margin in the second molar or the first molar in both groups.(Table 4) The distance between the canal and the buccal bone was significantly larger in the second molar than in the first molar in Group II. Therefore, it is recommended that the vertical cut in the SSRO be performed at the second molar when the canal is not in contact with the buccal bone. In Group I, a specific position for the vertical cut was not recommended because the distance between the canal and the buccal bone was not significantly different between the first and second molar regions. According to the results of this study, in Group II, the recommended buccal and inferior vertical cutting depths at the second molar are 7 mm and 8 mm, respectively. In Group II, if performing a vertical cut at the first molar, the recommended buccal cutting depth is 5.5 mm, and the inferior cutting depth is 7.5 mm. In Group I, the recommended buccal cutting depth is 5.5 mm, and the inferior cutting depth is 6 mm for a vertical cut at the second molar. If a vertical cut is performed at the first molar in Group I, the recommended buccal cutting depth is 5 mm, and the inferior cutting depth is 6 mm. Since the contact group has a smaller cutting depth than the separate group, more attention should be paid during SSRO, as the likelihood of postoperative NSD becomes higher.
V. Conclusion
In this study, we compared the course of the mandibular canal according to contact with the buccal cortical bone using CT, and the following conclusions were obtained.
1. The distance between the canal and the buccal bone was significantly larger in Group II than in Group I at both the first and second molars.
2. The mandible was significantly thicker in Group II than in Group I at both the first and second molars.
3. The buccolingual ratio of the canal was larger in Group II at the second molar region but not at the first molar region.
4. The distance between the canal and the inferior cortical margin was significantly larger in Group II than in Group I at both the first and second molars.
5. Group I had no significant difference in distance between the canal and the buccal bone for each tooth; in Group II, the distance was larger at the second molar region.
6. The mandible was thicker at the second molar position in both groups.
7. The distance between the canal and the inferior cortical margin was not significantly different according to teeth in the two groups.
As a result, it is evident that, if the mandibular canal is in contact with the buccal cortical bone, the canal runs closer to the buccal bone and to the inferior border of the mandible at the first and second molars.
 XML Download