Journal List > J Adv Prosthodont > v.10(4) > 1099973

Bae, Jeong, Kim, and Kim: A study on the machining accuracy of dental digital method focusing on dental inlay

Abstract

PURPOSE

The purpose of this study was to compare the cutting method and the lamination method to investigate whether the CAD data of the proposed inlay shape are machined correctly.

MATERIALS AND METHODS

The Mesial-Occlusal shape of the inlay was modeled by changing the stereolithography (STL). Each group used SLS (metal powder) or SLA (photocurable resin) in the additive method, and wax or zirconia in the subtractive method (n=10 per group, total n=40). Three-dimensional (3D) analysis program (Geomagic Control X inspection software; 3D systems) was used for the alignment and analysis. The root mean square (RMS) in the 2D plane state was measured within 50 µm radius of eight comparison measuring points (CMP). Differences were analyzed using one-way analysis of variance and post-hoc Tukey's test were used (α=.05).

RESULTS

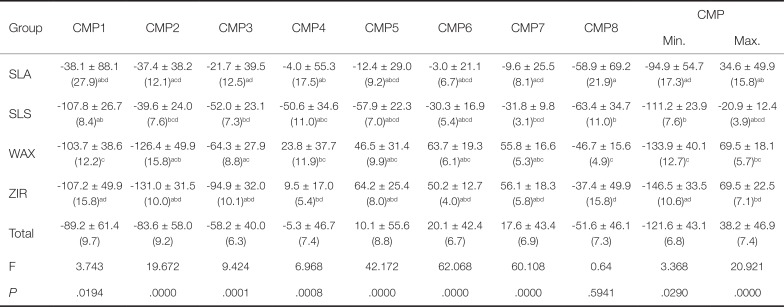
There was a significant difference in RMS only in SLA and SLS of 2D section (P<.05). In CMP mean, CMP 4 (−5.3±46.7 µm) had a value closest to 0, while CMP 6 (20.1±42.4 µm) and CMP 1 (−89.2±61.4 µm) had the greatest positive value and the greatest negative value, respectively.

CONCLUSION

Since the errors obtained from the study do not exceed the clinically acceptable values, the lamination method and the cutting method can be used clinically.

INTRODUCTION

Three-dimensional (3D) printing is known as additive manufacturing (AM) in accordance with ASTM F42 and the International Organization for Standardization (ISO) TC261 committees. It is a technology of great interest worldwide with the expectation of the fourth industrial revolution.123 As a method of stacking layers to form an object adding layer-upon-layer of material it has been widely used in the medical field for the purpose of customization. The use of this technique resulted in various changes especially in the dental field.45 In the past, molds were used to produce the prosthesis, which often resulted in errors due to materials or techniques through several work steps including investing and casting. In addition, upon failure in the oral cavity, the above-mentioned process should be repeated; from the fact that most of it is produced by human hands, an objective evaluation becomes difficult.6 On the other hand, AM can produce objective results using computer-aided-design (CAD) and output equipment. It is possible to produce the product without molds. The development of dental scanner and scanning technology is changing the dental prosthesis production in many ways.7
As a technology of stacking up from a mechanical point of view, AM is very suitable for making dental prostheses with curved shapes.8 Human teeth have few straight lines, and the dental arch is shaped like a curve.9 Therefore, there may be an undercut region depending on the insertion direction,10 which has limitations in being reproduced by the cutting method.
Dental prosthesis production is closely linked to the cutting method, which is known as ‘milling.’11 Although recent dental prosthesis manufacturing technologies have reproduced some complex shapes using a milling process of several shafts through the cutting method, it was difficult to machine an undercut area completely. In addition, when the material was milled, waste was produced.12
Although both methods have advantages and disadvantages, they are all commonly used in the current dental field and may be used further in the future. Even for a technology with many advantages, however, the most important thing is the accuracy of the production results.1314 It has been previously reported that the method of stacking up layers has a limitation in reproducing edges or sphere. Furthermore, it has been reported that a fine gap between the layers affects the fitness of the product.15 Since the errors of the outcome may cause secondary caries in the patient's mouth, efforts to make accurate prosthesis should be made. The accuracy of the outcome produced by the cutting method and 3D printing has been studied with a focus on marginal fitness1617 and biocompatibility,1819 but there are few studies on the machining precision of the edge.
Perfect reproduction with computer-aided-design data can be a way to judge the accuracy of digitally manufactured prostheses. Since the tooth has the shape of a curved surface, it is difficult to make a comparison between two technologies. It is also far-fetched to consider that both the cutting and stacking methods will completely reproduce CAD data. Therefore, it is imperative to understand the errors that occur in CAD data after machining. In order to evaluate this objectively, it is necessary to evaluate whether CAD data with reproduce a certain angle of corners perfectly. As the digital method is continuously expanding, we opt to check the applicability of the digital method by measuring the suitability of the prosthesis made with the digital method. Thus, the purpose of this study was to compare the cutting and the lamination methods to investigate whether or not the CAD data of the proposed inlay shape are machined correctly. We hypothesized that there will be no difference in the edges of the result between the two methods.

MATERIALS AND METHODS

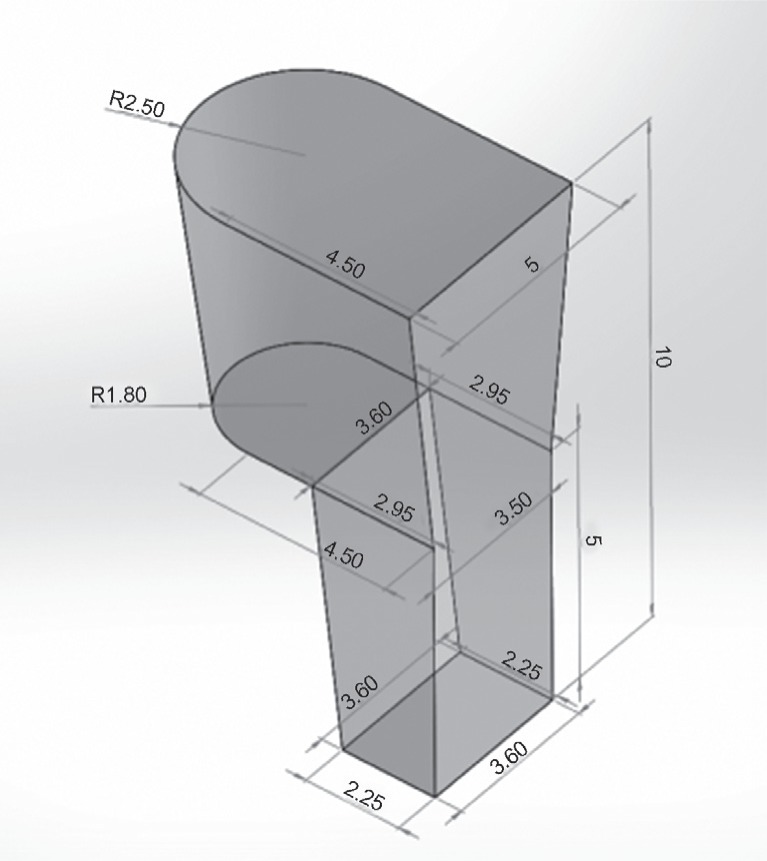
In order to make a specimen, we created the inlay shape of the mesial-occlusal cavity with the plane and the right angle as a 3D stereoscopic image with Solidworks software. The total height was 10 mm, and the shape dimension was 5 mm and 7 mm in width and in depth, respectively. One side of the vertical axis was made of a semicircle with a radius of 2.5 mm. The part of the half from the height was 3.6 mm in width and 6.75 mm in length, and one part of the vertical axis was made of a semicircle with a radius of 1.8 mm. Consisting of a rectangle with 3.6 mm in width and 2.25 in length, the bottom shape was made in a taper form from top to bottom.
At the point where the circle on the upper side meets with the circle in the center, we gave an angle of 8° to provide a retentive force to simulate clinical cases. The completed CAD file was converted into stereolithography (STL) (Fig. 1). The printing direction was from the bottom to the top.
The specimens were made with selective laser sintering (SLS) using metal powder and stereolithography apparatus (SLA) using photocurable resin in the lamination method, while they were made with wax and zirconia block in the cutting method (Table 1). A total of 40 specimens were prepared (10 per group), and the surface to which the support was attached was polished by one skilled dental technician. The manufactured specimens were scanned through a dental scanner (D800, 3Shape A/S, Copenhagen, Denmark).
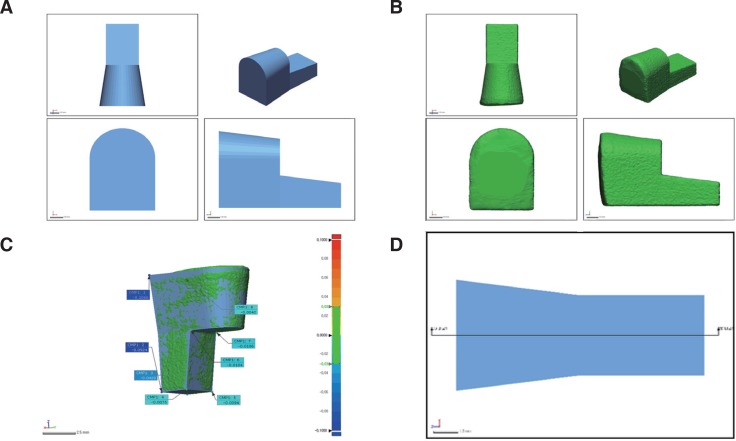
A 3D analysis program (Geomagic Control X inspection software, 3D systems Inc., Cary, NC, USA) was used to align the CAD data and the scanned data in the initial alignment and the best fit alignment (sampling rate of 25%, maximum number of iterations of 20). Subsequently, the root mean square (RMS) values around the tolerance range and the mean of values deviating from CAD data in the 2D plane state where the horizontal axis is bisected were measured.
RMS=1ni=1n(x1,ix2,i)2jap-10-321-e001.jpg
Where x1,i is measuring point I on the reference data, x2,i is on the scan data, and n is the total number of measuring points. According to International Organization for Standardization (ISO) 12836, it was determined that the lower the RMS value is, the better the accuracy.20 Finally, the values outside the CAD data were measured within 50 µm radius of eight comparison measuring points (CMP) where each side meets. The positions of the eight points were as follows: CMP1; top-right-back, CMP2; bottom-right-back, CMP3; bottom-left-back, CMP4; bottom-right-front, CMP5; bottom-left-front, CMP6; middle-right-front, CMP7; middle-left-front, CMP8; top-left-back.
The color of the data and the tolerance range were set at ± 100 µm (+: red, −: blue) and ± 30 µm, respectively.
In order to compare the RMS values by group, a statistical program (IBM SPSS statistics 23, IBM Corp., Chicago, IL, USA) was used to perform one-way analysis of variance (ANOVA) analysis. Levene Statistic was used to test for homogeneity of variance, and equal variance was subsequently assumed. Thus, Tukey's method (honestly significance difference, HSD) was used for the post hoc test and the significance level was set at 0.05.

RESULTS

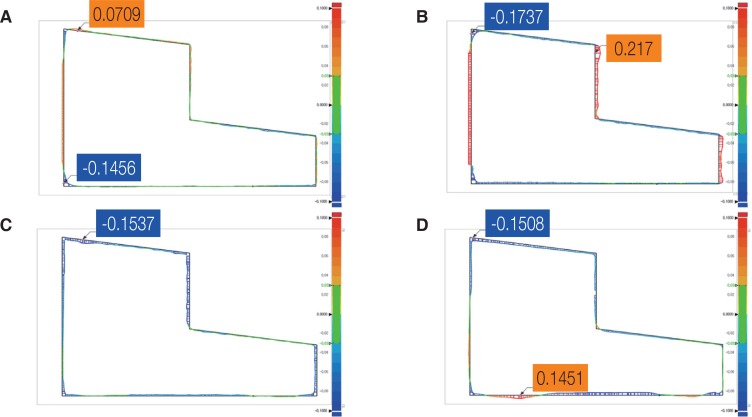
The horizontal axis of the specimen was divided into two equal parts, and the error value of the plane was measured in the 2D state (Fig. 2, Fig. 3). The results indicated that the mean RMS of SLA was the smallest, 35.4 ± 12.4 µm, followed by WAX 48.3 ± 12.6 µm, ZIR 47.6 ± 6.6 µm, and SLS 63.0 ± 21.3 µm. There was a significant difference only in the SLA and SLS groups (P < .05; Table 2).
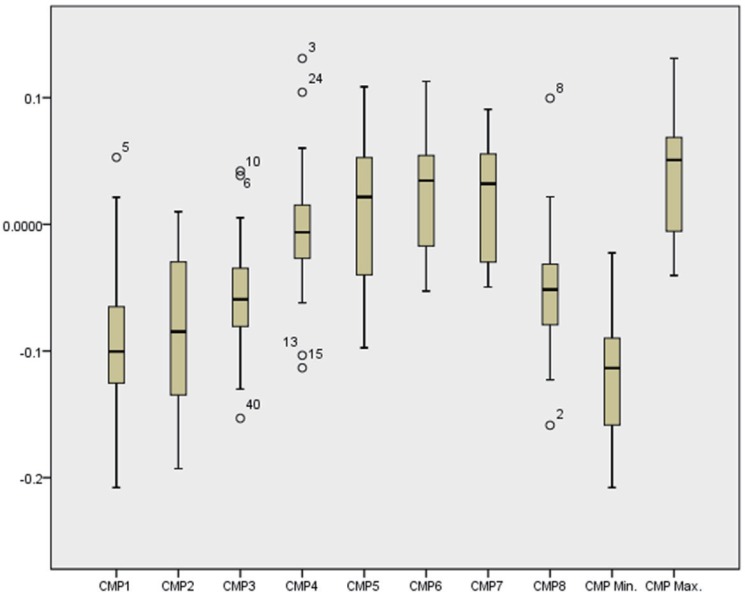
The mean value was less than 0 in CMP 1, 2, 3, 4, and 8, and more than 0 in CMP 5, 6, and 7 (Fig. 4). There was a statistically significant difference in all groups except CMP 8 (Table 3). Comparing by group, SLA and SLS showed negative values below 0 in all CMPs, but WAX and ZIR showed positive values at CMP 4, 5, 6, and 7. In the mean of the CMP values for each group, the value closest to zero was CMP 4 (−5.3 ± 46.7 µm). CMP 6 and CMP 1 had the largest positive value (20.1 ± 42.4 µm) and the largest negative value (−89.2 ± 61.4 µm), respectively.

DISCUSSION

This study compared the cutting method with the lamination method to clarify whether the CAD data of the proposed inlay shape is accurately machined. As a result, the hypothesis of this study was rejected because there was a significant difference in the edge part depending on the method.
As digital technology continues to spread to the dental field, it is anticipated that quicker and more accurate prosthesis creation and time reduction than the existing methods will be achieved.21 However, machined prosthesis can be completed only by the human hand, and semi-digital equipment regarded as expensive.22
Nevertheless, the use of machine is gradually increasing because the machine enables faster and more accurate performance to a certain level. Furthermore, it is necessary to check the amount of error generated in the machine and prepare it to obtain higher quality prosthesis. To this end, we identified the machining precision of the digitally fabricated prosthesis, which has been attracting attention in recent years.
Since the dental prosthesis is mostly curved, the end mill used in the cutting method is a ball-end mill with a spherical front end. As a machine with more than five axes has been used in recent years, there is no great difficulty in machining the outer surface of the curved prosthesis or the undercut with the weak inner surface. However, there is a cusp phenomenon in which the height varies depending on traces left by a ball-end mill or the spacing between hollows, and there may be a part not cut or cut more depending on the diameter of the ball. Moreover, the edge part created by the face and face meeting is hard to be machined with a ball-end mill, which affects the precision of the prosthesis.23
Lamination machining presents difficulties in reproducing corners or perfect spheres. Less stacking or more stacking may occur depending on the thickness of the layers to be stacked during the process of stacking materials one layer at a time.24 The deficient portion is filled or the over portion is removed through the post-processing step, but the number of working steps is increased, thus requiring a lot of time for complementary work. The significance of this study is considered high because it is necessary to know how much it misses in the process to find other ways to supplement it.
In the figure of bisecting the horizontal axis of the specimen and measuring the 2D plane, SLA showed a lot of green parts, which are data values within the tolerance range of 30 µm. The height axis of most SLS specimens was found to be longer than that of CAD data. WAX had a smaller overall dimension compared to the CAD data, showing a lot of blue. Unlike other groups, zirconia suddenly showed an irregular shape such as sudden grooves.
It is considered that the SLA entered the gap between the photocurable resin during lamination and had the least error. A study by McMains S notes that dipped coatings improve the surface finish.25 On the other hand, ZIR is thought to have caused irregular errors due to chipping during cutting. In the Mandal N study, chipping was observed at corners during cutting.26 In the case of WAX, it is thought that errors occurred due to device shaking during cutting, but related research in the future is needed.
The measurement results revealed an SLA of 35.4 ± 12.4 µm, indicating that the RMS mean was the smallest compared to the other groups, and that the error with CAD data was the smallest. However, significant differences were found only in the SLS with the largest RMS mean. SLA and SLS used different materials and methods, although they are themselves the same lamination methods. SLA uses photocurable resin, which is liquid, whereas SLS laminates by using metal powder. In this case, there is a difference from the CAD data due to the phenomenon in which a part of the powder particles that are attached as the metal powder of SLS is sintered. The study of Bae et al.15 and Gu and Shen27 reported that a balling phenomenon occurs in which a part of the metal powder sticks to the surface in the specimens made by the SLS method. Furthermore, Li et al.28 also indicated that this phenomenon typically occurs in the SLS system, thus degrading the quality. Therefore, additional research is still needed to understand why it is made long only in height.
This study compared the RMS values to evaluate the overall error trends in the 2D plane, and compared the mean values to determine the negative and positive values at each corner. The point-by-point analysis showed positive values in CMP 5, 6, and 7, while the other points corresponded to the external surface. In contrast, CMP 6 and 7 corresponded to the inner surface, which was cut less than the other points and stacked more in the lamination. Figure 2 showed that the vertices corresponding to the inner surface were more positive than the CAD data in all four groups. Although CMP 5 also showed a positive value, this tended to appear at the vertex corresponding to the inner surface when compared with other points; thus, further research on this part is also required.
This study used an inlay shape and compared the result to conventional crown prostheses. There are many edges caused by vortex on the inner surface and various vortices, but the inlay of negative geometry was selected for objective evaluation.29 Perfect reproduction of the edge region is very important in the inlay shape. Because the most important thing of the prosthesis is the internal fitness, the edge region of the inlay should be well reproduced for the internal fitness.
Kohorst et al.30 reported mean values for zirconia restorations ranging from 58 to 206 µm. Reich et al.31 reported FPDs marginal gaps of 54 µm. There was no definition of scientifically approved crown fit from several studies.32 However, most researchers agree that clinically acceptable gap size is 100 µm.33 Our present study showed no consistent results with CAD data in both cutting and lamination methods. However, the error value was found, and neither the positive value nor the negative value exceeded 100 µm. Furthermore, this present study is considered to help reduce the error values that are generated or to prepare countermeasures such as anticipating and compensating the values in advance.
It is clinically important to check the machining precision of the digitally manufactured prosthesis to obtain high quality prosthesis and reduce the error value generated at the edge area.

CONCLUSION

Among the four groups, the error of SLA was the least, followed by in order of WAX, ZIR and SLS. As a result of comparing eight vertices, the negative shape had a positive error, and the positive shape had a negative error except for one vertex. Because the errors obtained from the study did not exceed the clinically acceptable values, our results indicated that additive and subtractive methods can be used clinically.

Notes

This research was supported by the Basic Science Research Program through the National Research Foundation (NRF) of Korea, funded by the Ministry of Education (Grant No. 2017R1D1A1B03035688).

This work was supported by the National Research Foundation of Korea (NRF) grant funded by the Korea government (MSIT) (No. 2018R1A5A7023490).

References

1. ISO/ASTM F2915. 2013 Standard specification for additive manufacturing file format (AMF) Version 1.1. Available from: https://www.astm.org/Standards/F2915.htm.
2. ASTM. Additive Manufacturing File Format (AMF). 2017-07-25. Available from: http://amf.wikispaces.com/.
3. Wimpenny DI, Pandey PM, Kumar LJ, editors. Advances in 3D printing & additive manufacturing technologies. Singapore: Springer;2017.
4. Miyazaki T, Hotta Y. CAD/CAM systems available for the fabrication of crown and bridge restorations. Aust Dent J. 2011; 56(Suppl 1):97–106.
crossref
5. Traini T, Mangano C, Sammons RL, Mangano F, Macchi A, Piattelli A. Direct laser metal sintering as a new approach to fabrication of an isoelastic functionally graded material for manufacture of porous titanium dental implants. Dent Mater. 2008; 24:1525–1533. PMID: 18502498.
crossref
6. Venkatesh KV, Nandini VV. Direct metal laser sintering: a digitised metal casting technology. J Indian Prosthodont Soc. 2013; 13:389–392. PMID: 24431766.
crossref
7. Atieh MA, Ritter AV, Ko CC, Duqum I. Accuracy evaluation of intraoral optical impressions: A clinical study using a reference appliance. J Prosthet Dent. 2017; 118:400–405. PMID: 28222869.
crossref
8. Sykes LM, Parrott AM, Owen CP, Snaddon DR. Applications of rapid prototyping technology in maxillofacial prosthetics. Int J Prosthodont. 2004; 17:454–459. PMID: 15382782.
9. Currier JH. A computerized geometric analysis of human dental arch form. Am J Orthod. 1969; 56:164–179. PMID: 4896226.
crossref
10. Marghalani TY. Frequency of undercuts and favorable path of insertion in abutments prepared for fixed dental prostheses by preclinical dental students. J Prosthet Dent. 2016; 116:564–569. PMID: 27174407.
crossref
11. Dawood A, Marti Marti B, Sauret-Jackson V, Darwood A. 3D printing in dentistry. Br Dent J. 2015; 219:521–529. PMID: 26657435.
crossref
12. Witkowski S, Komine F, Gerds T. Marginal accuracy of titanium copings fabricated by casting and CAD/CAM techniques. J Prosthet Dent. 2006; 96:47–52. PMID: 16872930.
crossref
13. Castillo-de-Oyagüe R, Sánchez-Turrión A, López-Lozano JF, Albaladejo A, Torres-Lagares D, Montero J, Suárez-García MJ. Vertical misfit of laser-sintered and vacuum-cast implant-supported crown copings luted with definitive and temporary luting agents. Med Oral Patol Oral Cir Bucal. 2012; 17:e610–e617. PMID: 22322524.
14. Abou Tara M, Eschbach S, Bohlsen F, Kern M. Clinical outcome of metal-ceramic crowns fabricated with laser-sintering technology. Int J Prosthodont. 2011; 24:46–48. PMID: 21210003.
15. Bae EJ, Kim JH, Kim WC, Kim HY. Bond and fracture strength of metal-ceramic restorations formed by selective laser sintering. J Adv Prosthodont. 2014; 6:266–271. PMID: 25177469.
crossref
16. Kim KB, Kim WC, Kim HY, Kim JH. An evaluation of marginal fit of three-unit fixed dental prostheses fabricated by direct metal laser sintering system. Dent Mater. 2013; 29:e91–e96. PMID: 23680302.
crossref
17. Ucar Y, Akova T, Akyil MS, Brantley WA. Internal fit evaluation of crowns prepared using a new dental crown fabrication technique: laser-sintered Co-Cr crowns. J Prosthet Dent. 2009; 102:253–259. PMID: 19782828.
crossref
18. Xin XZ, Chen J, Xiang N, Wei B. Surface properties and corrosion behavior of Co-Cr alloy fabricated with selective laser melting technique. Cell Biochem Biophys. 2013; 67:983–990. PMID: 23553145.
crossref
19. He HY, Zhang JY, Mi X, Hu Y, Gu XY. Rapid prototyping for tissue-engineered bone scaffold by 3D printing and biocompatibility study. Int J Clin Exp Med. 2015; 8:11777–11785. PMID: 26380018.
20. ISO. 12836:2015 Dentistry - Digitizing devices for CAD/CAM systems for indirect dental restorations - Test methods for assessing accuracy. Geneva; Switzerland: International Organization for Standardization;2012.
21. Koch GK, Gallucci GO, Lee SJ. Accuracy in the digital workflow: From data acquisition to the digitally milled cast. J Prosthet Dent. 2016; 115:749–754. PMID: 26803173.
crossref
22. Brodkin D, Panzera C, Panzera P. U.S. Patent No. 6,322,728. Washington, DC: U.S. Patent and Trademark Office;2001.
23. Bosch G, Ender A, Mehl A. A 3-dimensional accuracy analysis of chairside CAD/CAM milling processes. J Prosthet Dent. 2014; 112:1425–1431. PMID: 24993373.
crossref
24. Bae EJ, Jeong ID, Kim WC, Kim JH. A comparative study of additive and subtractive manufacturing for dental restorations. J Prosthet Dent. 2017; 118:187–193. PMID: 28089336.
crossref
25. McMains S. Layered manufacturing technologies. Commun ACM. 2005; 48:50–56.
crossref
26. Mandal N, Doloi B, Mondal B. Development of flank wear prediction model of Zirconia Toughened Alumina (ZTA) cutting tool using response surface methodology. Int J Refract Metals Hard Mater. 2011; 29:273–280.
crossref
27. Gu D, Shen Y. Balling phenomena in direct laser sintering of stainless steel powder: Metallurgical mechanisms and control methods. Mater Des. 2009; 30:2903–2910.
crossref
28. Li R, Liu J, Shi Y, Wang L, Jiang W. Balling behavior of stainless steel and nickel powder during selective laser melting process. Int J Adv Manuf Technol. 2012; 59:1025–1035.
crossref
29. Abou Tara M, Eschbach S, Wolfart S, Kern M. Zirconia ceramic inlay-retained fixed dental prostheses - first clinical results with a new design. J Dent. 2011; 39:208–211. PMID: 21185905.
crossref
30. Kohorst P, Brinkmann H, Li J, Borchers L, Stiesch M. Marginal accuracy of four-unit zirconia fixed dental prostheses fabricated using different computer-aided design/computer-aided manufacturing systems. Eur J Oral Sci. 2009; 117:319–325. PMID: 19583762.
crossref
31. Reich S, Wichmann M, Nkenke E, Proeschel P. Clinical fit of all-ceramic three-unit fixed partial dentures, generated with three different CAD/CAM systems. Eur J Oral Sci. 2005; 113:174–179. PMID: 15819826.
crossref
32. Syrek A, Reich G, Ranftl D, Klein C, Cerny B, Brodesser J. Clinical evaluation of all-ceramic crowns fabricated from intraoral digital impressions based on the principle of active wavefront sampling. J Dent. 2010; 38:553–559. PMID: 20381576.
crossref
33. Stoll R, Fischer C, Springer M, Stachniss V. Marginal adaptation of partial crowns cast in pure titanium and in a gold alloy - an in vivo study. J Oral Rehabil. 2002; 29:1–6. PMID: 11844025.
crossref
Fig. 1

Schematic of the inlay geometry three-dimensional modeling.

jap-10-321-g001
Fig. 2

Experimental procedure for 3D accuracy analysis. (A) Virtual reference data. Inlay shape of the Mesial-Occlusal cavity using CAD software. (B) The manufactured specimens were scanned through a dental scanner. (C) Analyze of align the CAD data and the scanned data. And eight comparison measuring points positioning. (D) 2D plane for cross section analysis.

jap-10-321-g002
Fig. 3

Error values of virtual reference data and scan data measured in a two-dimensional cross section. Orange box; Maximum error value of scan data. Blue box; Minimum error value of scan data. (A) SLA (photocurable resin), (B) SLS (metal powder), (C) WAX (wax), (D) ZIR (zirconia).

jap-10-321-g003
Fig. 4

Box plot for mean values of comparison measuring points.

jap-10-321-g004
Table 1

Specifications of the used materials and equipment

jap-10-321-i001
Group (Technique) Materials; System (manufacturer) Process
SLA (AM) UV curable plastic_VisiJet FTX Green; ProJet 1200 (3D Systems, Rock Hill, SC, USA) UV (effective 585 dpia)
Vertical build speed 14 mm/hour
Native resolution (xy) 56 μm
Layer thickness 30 μm
SLS (AM) Cobalt-Chrome alloy_SP2; EOSINT M270 (EOS Gmbh, Krailling, Germany) Ytterbium fiber laser 200 W
Scan speed 7 m/s
Production speed 20 m3/s
Lamination thickness 100 μm
Particle size 20 μm
WAX (CNC) Wax block; DWX-50 (Roland DG Corp., Hamamatsu, Japan) Five axis
Disc external diameter 98 mm
ZIR (CNC Zirconia block_NaturaZ; DWX-50 (Roland DG Corp., Hamamatsu, Japan) Spindle speed 6,000 to 30,000 rpm

AM, Additive Manufacturing; CNC, Computer Numerical Control

Table 2

Descriptive statistics and variance analysis of RMS measured in a two-dimensional section (in µm)

jap-10-321-i002
Group Mean ± SD SE 95% CI Min. Max. F P value
Lower Upper
SLA 35.4 ± 12.4a 3.9 26.6 44.2 18.4 63.6 6.318 .001
SLS 63.0 ± 21.3a 6.7 47.8 78.2 24.4 83.5
WAX 48.3 ± 12.6 4.0 39.3 57.3 26.1 71.9
ZIR 47.6 ± 6.6 2.1 42.9 52.3 36.1 56.7
Total 48.6 ± 16.8 2.7 43.2 54.0 18.4 83.5

* Multiple Comparisons; Tukey's Honest Significant Difference

a ; Statistical significance between groups

CI, Confidence Interval; RMS, Root Mean Square; SD, Standard Deviation; SE, Standard Error; SLA, photocurable resin; SLS, metal powder; ZIR, zirconia

Table 3

Descriptive statistics and variance analysis of comparison measuring points (in µm)

jap-10-321-i003
Group CMP1 CMP2 CMP3 CMP4 CMP5 CMP6 CMP7 CMP8 CMP
Min. Max.
SLA −38.1 ± 88.1 (27.9)abd −37.4 ± 38.2 (12.1)acd −21.7 ± 39.5 (12.5)ad −4.0 ± 55.3 (17.5)ab −12.4 ± 29.0 (9.2)abcd −3.0 ± 21.1 (6.7)abcd −9.6 ± 25.5 (8.1)acd −58.9 ± 69.2 (21.9)a −94.9 ± 54.7 (17.3)ad 34.6 ± 49.9 (15.8)ab
SLS −107.8 ± 26.7 (8.4)ab −39.6 ± 24.0 (7.6)bcd −52.0 ± 23.1 (7.3)bd −50.6 ± 34.6 (11.0)abc −57.9 ± 22.3 (7.0)abcd −30.3 ± 16.9 (5.4)abcd −31.8 ± 9.8 (3.1)bcd −63.4 ± 34.7 (11.0)b −111.2 ± 23.9 (7.6)b −20.9 ± 12.4 (3.9)abcd
WAX −103.7 ± 38.6 (12.2)c −126.4 ± 49.9 (15.8)acb −64.3 ± 27.9 (8.8)ac 23.8 ± 37.7 (11.9)bc 46.5 ± 31.4 (9.9)abc 63.7 ± 19.3 (6.1)abc 55.8 ± 16.6 (5.3)abc −46.7 ± 15.6 (4.9)c −133.9 ± 40.1 (12.7)c 69.5 ± 18.1 (5.7)bc
ZIR −107.2 ± 49.9 (15.8)ad −131.0 ± 31.5 (10.0)abd −94.9 ± 32.0 (10.1)abd 9.5 ± 17.0 (5.4)bd 64.2 ± 25.4 (8.0)abd 50.2 ± 12.7 (4.0)abd 56.1 ± 18.3 (5.8)abd −37.4 ± 49.9 (15.8)d −146.5 ± 33.5 (10.6)ad 69.5 ± 22.5 (7.1)bd
Total −89.2 ± 61.4 (9.7) −83.6 ± 58.0 (9.2) −58.2 ± 40.0 (6.3) −5.3 ± 46.7 (7.4) 10.1 ± 55.6 (8.8) 20.1 ± 42.4 (6.7) 17.6 ± 43.4 (6.9) −51.6 ± 46.1 (7.3) −121.6 ± 43.1 (6.8) 38.2 ± 46.9 (7.4)
F 3.743 19.672 9.424 6.968 42.172 62.068 60.108 0.64 3.368 20.921
P .0194 .0000 .0001 .0008 .0000 .0000 .0000 .5941 .0290 .0000

* One-way analysis of variance (ANOVA)

a Groups with significant differences from SLA (photocurable resin); b Groups with significant differences from SLS (metal powder); c Groups with significant differences from WAX (wax); d Group with significant differences from ZIR (zirconia)

CMP, comparison measuring point; Max, maximum; Min, minimum.

TOOLS
Similar articles