

 PDF
PDF ePub
ePub Citation
 Print
Print


INTRODUCTION
The development of computer-assisted design and computer-assisted manufacturing (CAD/CAM) technology over the past thirty years has led to an unprecedented development of new materials, manufacturing techniques, and treatment alternatives that outperform their predecessors.123 Monolithic CAD/CAM block materials are preferred by the clinicians as they reduce the number of clinical appointments and manufacturing time needed to produce esthetic all-ceramic restorations.2 Traditional monolithic CAD/CAM block materials consist of composite resins or of dental ceramics.14 Composite resins generally have inferior mechanical properties when compared with traditional dental ceramics.5 However, dental ceramics are inherently brittle and their machinability is not ideal.267 In order to overcome these deficiencies, new ceramics with different new compositions such as resin nanoceramic and dual-network ceramic have been introduced to achieve mechanically stable and esthetically pleasing restorations. Resin nanoceramic (Lava Ultimate) contains nanoceramic particles bound in a cross-linked resin matrix, while dual-network ceramic (Vita Enamic) contains a feldspathic-based double penetrating polymer infiltrated ceramic network.4578 The manufacturing purpose of these new generation materials is to combine the advantages of ceramics and composites in the same material.4 Several advantages of the materials have been reported over dental ceramics, including polish retention, fracture resistance, milling damage tolerance, and reduced manufacturing time.2457
Superficial changes of dental materials may be related to the long-term clinical success of the restorations, which are partially associated to their chemical degradation that can make the restoration more vulnerable to mechanical degradation.910 Dental materials in the oral environment suffer an aging process provoked by diet, which could be simulated effectively by immersion in food-simulating liquids (FSLs).1112 Toothbrushing, which is an example of the body wear, constitutes another important factor on the surface properties of dental materials.13 There are several investigations showing the effects of toothbrushing on the surface deterioration of restorative materials in terms of brushing time, force, and relative dentin abrasivity (RDA) of toothpaste.1314151617 However, there is little information related to the association between FSLs and toothbrushing abrasion on the surface texture of monolithic CAD/CAM restorative materials. Therefore, the aim of this in vitro study was to investigate the effect of toothbrushing on the surface properties such as gloss, roughness, and hardness of monolithic CAD/CAM restorative materials after immersion in FSLs. The null hypothesis was that surface properties of tested materials were not affected by the immersion media or toothbrushing simulation.
MATERIALS AND METHODS
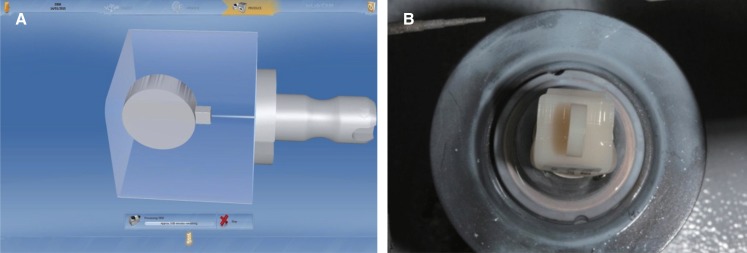
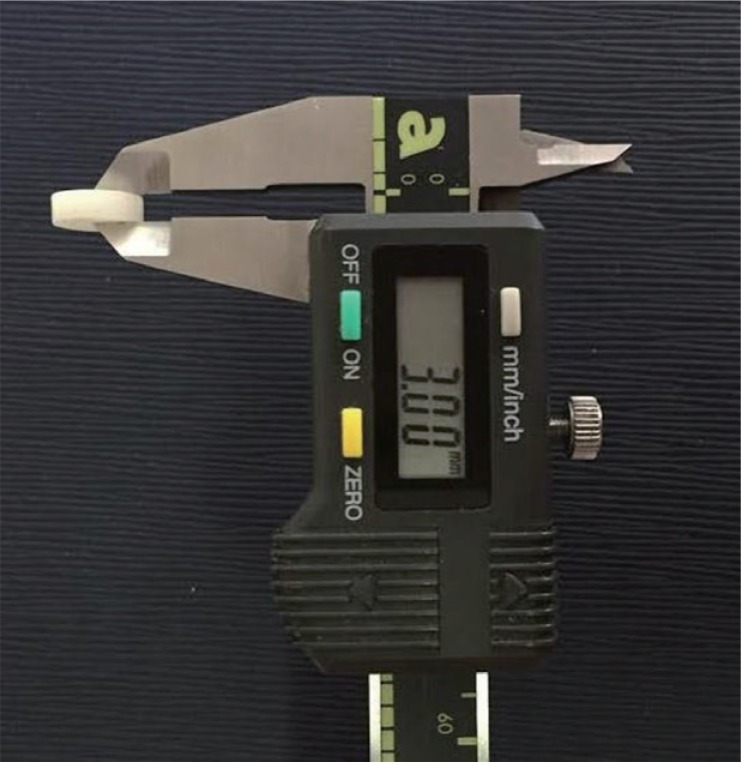
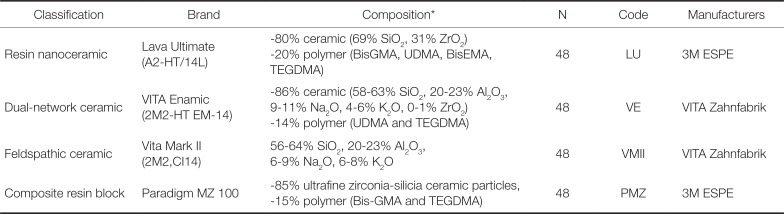
Monolithic CAD/CAM block materials such as two resin-based block composites [Lava Ultimate (3M-ESPE, St. Paul, MN, USA), and Paradigm MZ100 (3M-ESPE, St. Paul, MN, USA)], a hybrid ceramic [Vita Enamic (Vita Zahnfabrik, Bad Sackingen, Germany)] and a silicate ceramic [Vita Mark II (Vita Zahnfabrik, Bad Sackingen, Germany)], were tested in this study (Table 1). Fourty-eight disk-shaped test specimens of each CAD/CAM block with a diameter of 10.0 mm and a thickness of 3.0 mm were fabricated by using Cerec system (CEREC inLab MC XL, Dentsply Sirona, Bensheim, Germany) (Fig. 1). Specimen surfaces were polished under water-cooling in a polishing machine (LaboPol-25, Struers, Copenhagen, Denmark) with P800, P1000, P1200, P2400, and P4000 silicon carbide paper (Water Proof SiC Paper, Struers, Copenhagen, Denmark). Specimen dimensions were measured (IP54 Digital caliper, SHAN, Columbus, OH, USA) (Fig. 2). In total, 192 disk-shaped test specimens with a diameter of 10.0 mm and a thickness of 3.0 ± 0.05 mm were prepared and ultrasonically cleaned (Sonorex Digiplus; Bandelin GmbH, Berlin, Germany) in distilled water for 10 minutes. Then, the specimens were randomly allocated into 4 subgroups (n = 12) and stored in air, distilled water, 0.02M citric acid, or %75 ethanol/water solution for 7 days at 36.5℃. After the immersion period, surface quality was assessed with gloss, roughness, and hardness measurements.
Surface gloss was measured three times on the centre of each specimen by using a small-area glossmeter (Novo-Curve 60, Rhopoint Instruments, Istanbul, Turkey). The specimens were placed on the top plate of the glossmeter and covered with a black opaque film container to eliminate external light exposure and to maintain the exact position of the specimen during the measurement. The glossmeter was calibrated before each measurement. Gloss values were expressed as gloss units (GU) that can range from 0 (for a totally non-reflective surface) to 100 (obtained from a highly polished black glass with a refractive index of 1.567).
Initial surface roughness was measured with stylus profilometry (Dektak 8, Veeco Ins, Plainview, NY, USA) and expressed in Ra values. Three readings spaced at 120 degree, with a 0.8 mm cutoff and a speed of 0.1 mm/s, were taken and the average Ra was determined for each specimen.
Surface hardness was tested by using Vickers hardness test device (Leica VMHT, Leica Microsystems, Wetzlar, Germany). The diamond indenter of the device was used on the polished surface of the specimen with a load of 300 g for 12 s and the Vickers hardness number (VHN) was determined. The average VHN was obtained from the arithmetic mean of three VHN readings.
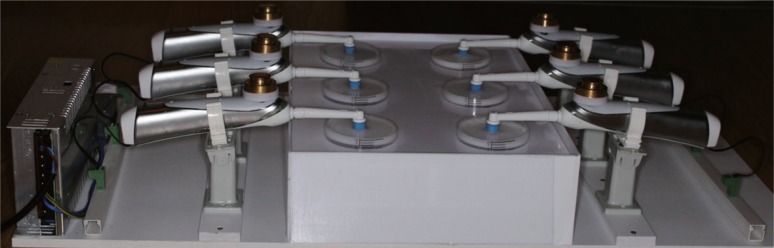
After the immersion period, the test specimens were ultrasonically cleaned and submitted to brushing test in a custom-made multi-station brushing machine that was prepared with 6 electrical toothbrushes (Braun Professional Care Triumph 5000, Braun, Frankfurt, Germany) fixed on a flat ground horizontally. To ensure unchanging conditions during the test period, electrical toothbrushes needed to be charged every thirty minutes transformed to ensure long-time brushing by a 12V/60W transformer (Fig. 3). Test specimens were brushed in ‘continuous mode’ with a standardized force of 2 N for 3 hours.18 Abrasive toothpaste slurry was prepared with a 1:1 ratio of distilled water and toothpaste (RDA-165, Colgate Tartar Control Toothpaste, Palmolive GmbH, New York, NY, USA).19 Toothpaste slurry was renewed 3 times during the test period. Gloss and roughness measurements were repeated after brushing.
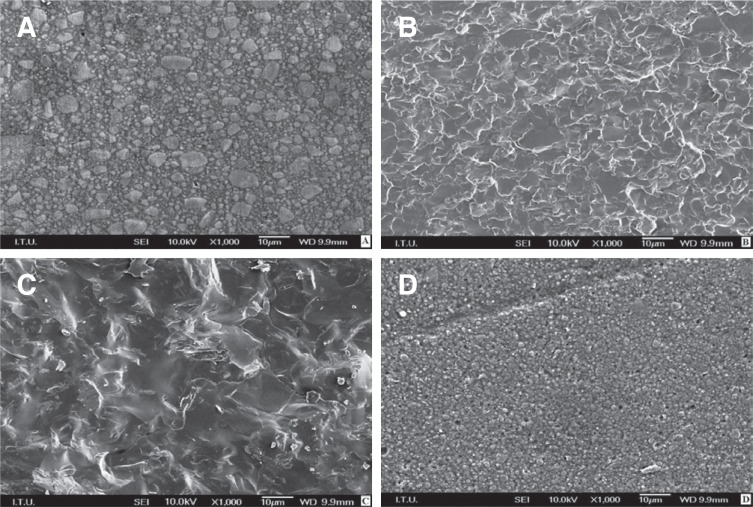
One random specimen from each group was selected for SEM examination (Jeol JSM-5600, Tokyo, Japan) and coated with gold and palladium using the sputtering device (Leica EM SCD 500, Leica Microsystems, Heerbrugg, Switzerland). SEM images were taken at a magnification of ×1000.
The data sets were analyzed with statistical software (IBM SPSS Version 20, IBM, New York, NY, USA). The whole deterioration process was separately analyzed by using repeated ANOVAs. Multiple pair wise comparisons were done with post-hoc paired t-tests. The significance level was determined at P < .05.
RESULTS
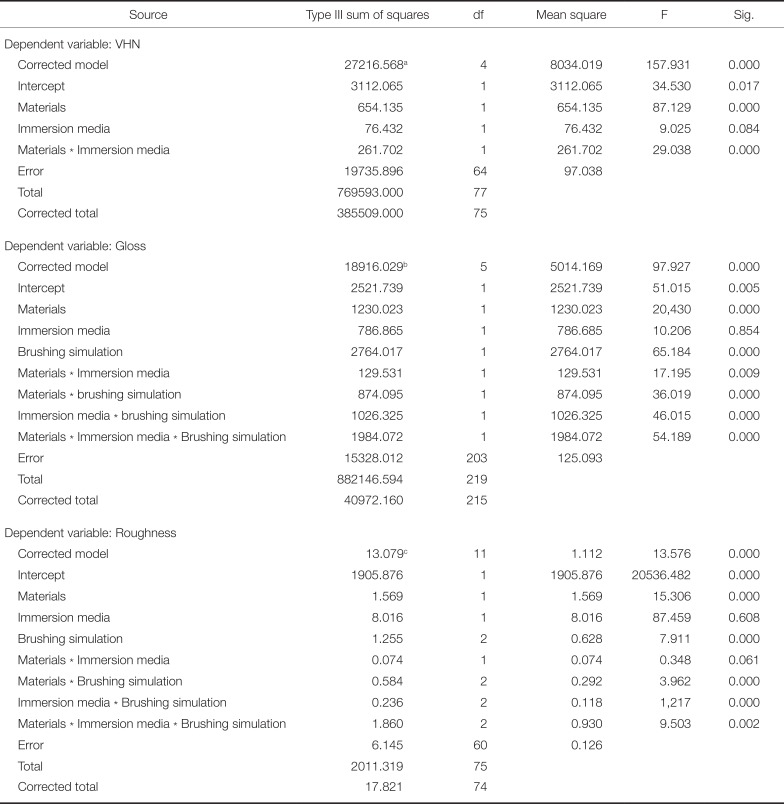
Statistically significant difference was found among the materials concerning the results of surface properties. 2 and 3-way ANOVAs were performed to investigate the effects of independent variables (materials, immersion media, and brushing simulation) on the dependent variables (gloss, hardness, and roughness) (Table 2). Tests of between-subjects effects showed that the dependent variables were significantly affected by the independent variables (P < .05) (Table 2).
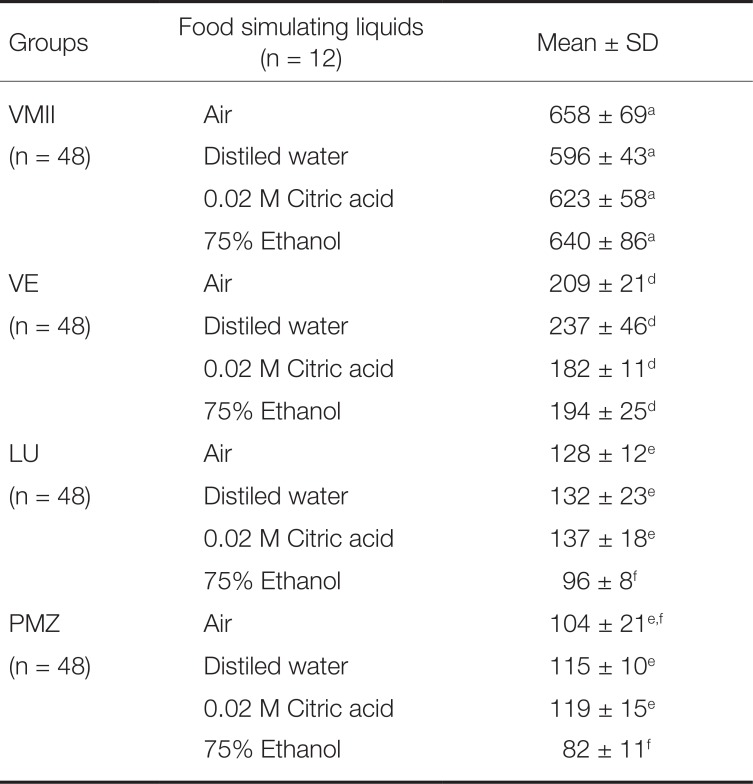
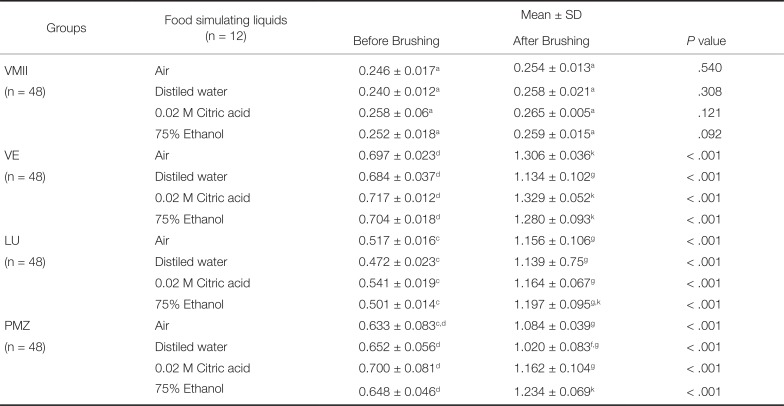
The results of Vickers hardness test measurements after the immersion period are presented in Table 3. The mean VHN value of the group VMII was significantly higher than the VHN of the groups VE, LU, and PMZ regardless of the FSLs, when they were immersed for one week (P < .05). Immersion in FSLs significantly affected the VHN of the groups LU and PMZ (P < .05) but produced no significant effect on the groups VMII and VE (P > .05). Immersion in 75% ethanol/water solution significantly reduced the mean VHN of LU and PMZ when compared with other immersion medias (air, distilled water, and 0.02 M citric acid) (P < .05).
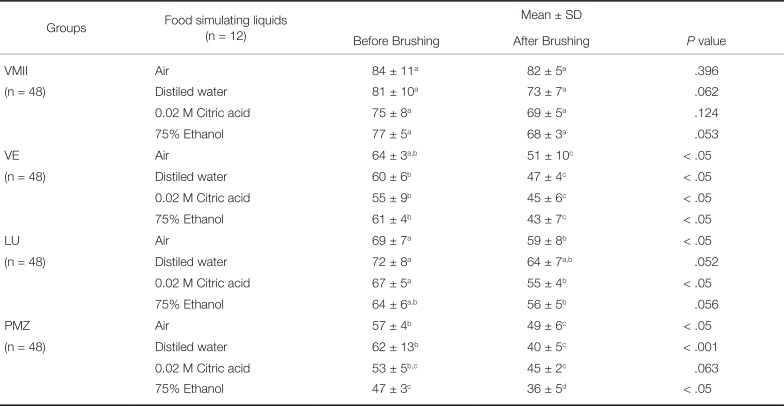
The results of gloss measurements are presented in Table 4. The highest mean GU was observed for the group VMII followed by the groups LU, VE, and PMZ. Immersion in FSLs did not significantly affect the GU of the groups VMII, VE, and LU. Immersion in 75 % ethanol/water solution significantly reduced the mean GU of the group PMZ when compared with other immersion medias (air, distiled water, and 0.02 M citric acid) (P < .05). Toothbrushing simulation significantly reduced the GU of VE, LU, and PMZ (P < .05) but produced no significant effect on VMII (P > .05).
The results of roughness measurements are presented in Table 5. The highest mean Ra was calculated for the group VE, which was followed by the groups PMZ, LU, and VMII. Immersion in FSLs produced no significant effect on the Ra values of the tested materials (VMII, VE, LU, and PMZ) (P > .05, Table 5). VE, LU, and PMZ produced significant increases in the mean value of Ra after toothbrushing (P < .001). SEM images of the materials showing the differences in morphology and grain size are presented in Fig. 4.
DISCUSSION
The null hypothesis was rejected as significant differences were found among the groups based on the results of surface properties.
In the oral cavity, dental materials are subjected to a variety of factors including thermal, chemical, and mechanical processes that may alter the quality of surface.111320 A continuous process of intraoral degradation caused by chemical agents found in saliva, food and beverages, or mechanical factors like toothbrushing affect the surface properties of dental materials, which results in lower durability of the restorations.21
Surface microhardness is a primary physical property which is defined as the resistance of a material to indentation or penetration.11 Hardness is generally associated with rigidity and mechanical strength of the material.5711 In the present study, statistically significant difference was found among the materials concerning the results of Vickers hardness. The highest mean VHN was obtained in the VMII group followed by VE, LU, and PMZ. The microhardness of CAD/CAM restorative materials has been investigated in several studies.572223 Results, obtained in the present study were in line with the results reported in the literature.2223 Immersion media produced no significant effect on the VHN of VMII and VE. However, immersion in 75% ethanol/water solution significantly reduced the VHN of LU and PMZ when compared with other immersion media (air, distilled water, and 0.02M citric acid). Surface microhardness of dental materials has been reported to be affected by their chemical composition and media exposure.111220 The most common monomers used in dental composites are triethylene glycol dimethacrylate (TEGDMA), urethane dimethacrylate (UDMA), bisphenol A glycol dimethacrylate (Bis-GMA), and 2-hydroxy ethyl methacrylate (HEMA).11 Dental composites also contain fillers such as quartz, colloidal silica, or ceramics.21 A strong covalent bond between organic matrix and inorganic fillers is esssential to obtain required physical properties in dental restorations.111221 Bonding of these two phases is achieved by coating the fillers with a silane coupling agent.21 Ferracane and Marker reported that the storage in 75% ethanol/water solution caused degradation of the resin matrix and matrix-filler interface.24 A decrease in surface hardness of resin composites after storage in ethanol has been reported in several previous studies.242526 Researchers explained the decrease in hardness after immersion in ethanol solution by referring to the solubility parameter. The solubility parameter of 75% ethanol/water solution was found to be closer to the solubility parameter of Bis-GMA/TEGDMA based composites.24 There are also studies that reported no significant effect of storage media on the hardness of resin composites, possibly due to the different testing conditions (exposure time, temperature, and chemical composition of the media) and filler content (filler type and loading percentage) of the resin composite used.2627 Materials used in the present sudy showed microstructural differences, confirmed by the SEM images made on the polished surfaces (Fig. 4).
The esthetical appearance of dental restorations are affected by the surface properties such as gloss and roughness of dental materials.182028 Furthermore, the surface texture of the restoration is reported to have an influence on the accumulation of plaque, wear, and the discoloration of restorations.912 In the present study, statistically significant differences were found among the groups concerning the results of gloss and roughness. The highest mean GU was observed in the WMII group, followed by LU, VE, and PMZ. The lowest Ra was obtained in the group VMII, followed by LU, PMZ, and VE. GU and Ra values were not significantly affected by the immersion media except the group PMZ that produced lower GU after immersion in 75% ethanol/water solution. Previous studies reported superficial changes of dental composites after immersion in FSLs, which they attributed to the degradation of the polymer matrix and resin-filler interface, and to the loss of inorganic filler particles.10122627
The materials were brushed for 3 h after immersion in FSLs, which may correspond with the amount of toothbrushing that is carried out over a period of 1 year, if it is assumed that a pair of premolar or molar teeth is, on average, brushed twice a day for 8 s.1829 Toothbrushing simulation significantly reduced the GU and augmented Ra values of VE, LU, and PMZ (P < .001) but produced no significant effect on the group VMII (P > .05). Few studies concerning the surface properties of monolithic CAD/CAM restorative materials after simulated toothbrushing are available in the existing literature, some of which are in accordance with the present study.223031 In a recent study, Mörmann et al.22 investigated the surface roughness and gloss of various CAD/CAM restorative materials and reported significant decrease in gloss with a significant increase in roughness after abrasive toothbrushing.
There are several studies investigating the separate effects of FSLs and toothbrushing on the surface texture of dental materials.10111213141523 In a clinical situation, toothbrushing generally comes after the exposure to FSLs.16 The effect of such association between chemical and mechanical processes might also be clinically relevant. In the present study, immersion in the 75% ethanol/water solution prior to toothbrushing significantly affected the VHN and GU values of the group PMZ. This finding might be explained with the chemical degradation caused by ethanol on the Bis-GMA molecules that are present in PMZ.26 Such an effect was not observed in the groups LU, VE, or VMII, possibly due to the different composition characteristics of the materials. Additioanally, reducing the filler size to nano-size might be effective on the better GU and Ra values that were observed in the group LU when compared with the groups VE or PMZ.21 Further studies are needed to quantify the long-term surface properties of monolithic CAD/CAM restorative materials by simulating the conditions of intraoral environment.
CONCLUSION
Within the limitations of the present study, it may be concluded that surface properties of monolithic CAD/CAM restorative materials are differently affected by the storage media and abrasive toothbrushing. Bis-GMA-containing CAD/CAM restorative materials showed higher surface deterioration than hybrid ceramic and silicate ceramic. Chemical compositions and microstructural differences of the materials seemed to influence the surface deterioration observed after immersion in 75% ethanol/water solution and abrasive toothbrushing.
 XML Download