

 PDF
PDF ePub
ePub Citation
 Print
Print


INTRODUCTION
Parallel magnetic resonance imaging (MRI) techniques have been widely utilized to shorten scan times or improve spatial resolution (12). Parallel imaging reduces the number of phase-encoding steps by a reduction (R) factor, which refers to the ratio of original phase-encoding steps to reduced phase-encoding steps. The R factor ranges from 1.5 to 4 in most commercially available applications (12). Although applications with much higher R factors are possible, they are currently limited by poor signal-to-noise ratio (SNR) and image reconstruction artifacts (123).
The use of diffusion tensor tractography (DTT) of the cerebral white matter has become widespread in research into a broad spectrum of diseases (456). DTT is an imaging method based on diffusion weighted imaging data, which is usually obtained by single-shot echo-planar imaging (EPI). Single-shot EPI has several inherent drawbacks, including low SNR and vulnerability to susceptibility artifacts (12). These drawbacks can be partially overcome by parallel imaging; the reduction in phase-encoding steps increases the SNR via a reduction in the echo time(TE) (78) and decreases the susceptibility artifact through a reduction in the phase error (39). Shortening of the TE by parallel imaging in EPI can increase the SNR, in contrast to spinecho or turbo spin-echo imaging, in which the SNR decreases proportionally to the square root of the R factor. In a previous study (7), the SNR of EPI increased with R up to the range of 2–3, and thereafter declined because the image reconstruction artifact of the parallel imaging process became dominant. On the other hand, susceptibility-induced geometric distortion in EPI decreased continuously with increasing R factor because the phase error of EPI is inversely proportional to the R factor (10).
The susceptibility artifact of EPI is pronounced at the ponssphenoid interface and causes severe geometric image distortion, particularly at 3 Tesla, although this artifact can be mitigated by the use of parallel imaging (1011). Recently, many studies have emphasized a diagnostic role for DTT in brainstem imaging, particularly in cases of tumorous disease (12131415). However, susceptibility-induced geometric distortion at the level of the pons may have a negative influence on DTT of the fibers passing through the brainstem. To our knowledge, no study has yet been performed based on the premise that DTT of the pons may require an optimized R factor, which is different from DTT in other brain regions with less geometric distortion, to not only increase the SNR but also decrease the extent of geometric distortion. In this study, DTT of the pyramidal tract passing through the pons was investigated with different R factors. We hypothesized that the calculated fiber number of the tract would be highest in the optimum range of R factors. The SNR, geometric distortion, and the number of fibers visible in the tract were measured to determine the optimal R factor.
MATERIALS AND METHODS
Subjects
This study was approved by the Institutional Review Board, and informed consent was obtained from all subjects. In June 2014, ten healthy volunteers (9 men and 1 woman; median age 30 years, range 27–43 years) were prospectively enrolled in this study. Volunteers had no history of neurologic disease, no current neurologic disease, and no contraindications for MRI scanning.
Imaging Protocol
Diffusion tensor imaging (DTI) was performed at 3 Tesla (Intera Achieva TX, Philips Healthcare, Best, the Netherlands) using a 32-channel sensitivity encoding (SENSE) head coil. DTI was based on single-shot EPI in the axial plane with the following parameters: b value, 0 and 1000 s/mm2; 15 different directions of diffusion gradients; repetition time (TR), 8888–15000 ms; TE, 118, 80, 67, 60, and 57 ms at R factors 1, 2, 3, 4, and 5; voxel size, 2 × 2 × 2 mm3; slice number, 74. DTI was repeated five times with a different R factor each time (1, 2, 3, 4, and 5). Acquisition times were 5:02, 3:12, 3:09, 3:18, and 3:19 (min:sec) at R factors 1, 2, 3, 4, and 5, respectively.
In order to measure the SNR of DTI with different R factors, a noise map was separately obtained for each subject by a method described in a previous study (16). To measure image distortion, axial T2-weighted turbo spin-echo images were obtained for comparison. The parameters were as follows: TR, 3000 ms; TE, 80 ms; voxel size, 2 × 2 × 2 mm3.
Image Analysis
SNR Measurement
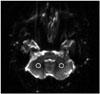
The SNR of EPI (b value, 0 s/mm2) was measured in the central portion of the cerebellum rather than in the pons to prevent inaccurate measurements resulting from image distortion of the pons (Fig. 1). First, signal intensities were measured in the right and left cerebellar hemispheres using two regions of interest (ROIs) (53 pixels, area 212 mm2) located just lateral to the dentate nuclei. Then, these two values were averaged to obtain "Signalavg". Next, the noise was measured on a separate noise map, using two ROIs with the same coordinates and areas as those used for the signal measurements in the cerebellum. The measured noise values were also averaged to obtain "Noiseavg". Lastly, the SNR was calculated using the equation below (16):
SNR = (Signalavg / Noiseavg) × (π / 2)1/2
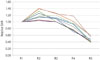
The SNR measurement described in the three steps above was repeated for R factors of 1, 2, 3, 4, and 5. The SNR at each R factor was then numbered from SNR1 to SNR5 and "relative SNR" was calculated for ease of comparison according to the following equation:
Relative SNRn = SNRn / SNR1 (n = 1, 2, 3, 4, 5)
Image Distortion Measurement
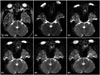
The degree of image distortion was measured at the level of the pons in the most severely distorted image among consecutive images of axial EPI (Fig. 2). First, the antero-posterior (AP) diameter of the pons was manually measured on T2-weighted turbo spin-echo images as a reference value. Second, the AP diameter of the pons at the same level was measured on each of five EPIs (b value, 0 s/mm2) at R factors of 1, 2, 3, 4, and 5.
For ease of comparison of image distortion, the "relative AP diameter" of the pons for each R factor was calculated as the ratio of the AP diameter on EPI to that on the T2-weighted turbo spin-echo image. Therefore, smaller values for the relative AP diameter of the pons indicated stronger image distortion.
Fiber Number Measurement
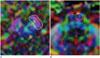
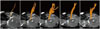
Fiber tracking was conducted using PRIDE software (Philips Healthcare, Best, the Netherlands) according to a method described in a previous study (17). For the pyramidal tract passing through the pons, two ROIs including the pyramidal tract were located manually on the axial color-coded fractional anisotropy map: the upper ROI was at the cerebral peduncle of the midbrain, and the lower ROI was at the anterior portion of the lower pons (Fig. 3). Fibers passing through both ROIs were then displayed as a final DTT of the pyramidal tract. Fiber tracking thresholds were set to 0.15 for fractional anisotropy and 27° for the angle between two contiguous eigenvectors. Fiber tracking was performed separately for the right and left pyramidal tracts for all 10 subjects. The fiber numbers of each of the 20 tracts which met the thresholds were then automatically calculated by PRIDE software for R factors of 1, 2, 3, 4, and 5 (Fig. 4).
Statistical Analysis
The Friedman test was used to compare the relative SNR, relative AP diameter of the pons, and pyramidal tract fiber number according to the five different R factors. p values less than 0.05 were considered statistically significant. Statistical analysis was performed with the SPSS software package (SPSS, version 18.0; SPSS Inc., Chicago, IL, USA).
RESULTS
Image Distortion
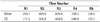
The AP diameters of the pons in all 10 subjects are given in Table 2. Relative AP diameter increased with increasing R factor, which represented monotonically decreasing image distortion with higher R factors. The relative AP diameter was highest at R factor 5 in 9 subjects and at R factor 4 in 1 subject. Relative AP diameters differed significantly among the five R factors (p < 0.001).
Fiber Number
The fiber numbers of the right and left pyramidal tracts are given in Table 3. Of 20 tracts from 10 subjects, 11 tracts displayed the largest fiber number at R factor 3, 6 tracts at R factor 4, 2 tracts at R factor 2, and 1 tract at R factor 5. The fiber numbers were significantly different among the five R factors (p < 0.001).
DISCUSSION
DTT has proven effective for evaluating several brainstem pathologies (1213141518). A previous study (13) reported the reliability of DTT in differentiating between diffuse pontine glioma and brainstem demyelinating disease, in which the fiber tracts of the brainstem are displaced by a tumor but are obscured or even transected by demyelinating disease. DTT has also been used to predict the degree of motor deficit associated with brainstem tumors (12), to assess treatment response in patients with pediatric diffuse brainstem glioma (1415), and to plan the surgical approach to brainstem cavernoma by providing information regarding motor and sensory fiber tracts (18). However, it should be noted that DTT is easily compromised by susceptibility-induced geometric distortion, which is an intrinsic shortcoming of EPI (19). The pons is particularly vulnerable to susceptibility artifacts, caused in this case by air in the adjacent sphenoid sinus. Recently, parallel imaging has been integrated into EPI, and has been shown to mitigate the geometric distortion problem (3920). The R factor of the parallel imaging process is an important parameter that affects not only the geometric distortion of EPI but also the SNR (78). However, no previous study determined the optimal R factor of parallel imaging for DTT used to visualize fiber tracts in the brainstem.
In this study, we investigated the optimal R factor of parallel imaging for DTT to visualize the pyramidal tract through the pons. Our findings were as follows: first, the SNR proved maximal at R factor 2 and thereafter declined in most of the subjects. This biphasic change of the SNR over the increase in R factor is supported by several previous studies (37821). The SNR increased with the use of higher R factors because of a shortening of the TE (78). However, reconstruction artifacts related to parallel imaging also inevitably increased with increasing R factor (3721). Therefore, the maximal SNR, obtained using R factors between 2 and 3 in our study, represents a compromise between the two effects of the R factor (7). Second, the use of a higher R factor reduced image distortion of the pons, resulting in the smallest distortion at R factor 5 in almost all subjects. An increase in the R factor reduces the number of phase-encoding steps per radio frequency shot in EPI (i.e., the EPI factor), which produces a smaller amount of phase error across the phase-encoding direction (3). Therefore, the degree of geometric distortion is less at higher R factors because of mitigation of susceptibility artifacts (910), which was the case in our study. Lastly, the number of fibers in the pyramidal tract was maximal at R factor 3 in the majority of the subjects. An R factor of approximately 3 may therefore provide an optimal balance between SNR and image distortion effects, thereby allowing for visualization of the maximum number of fibers using brainstem DTT. Optimal R factors for DTT at the pons level and for DTT in other brain regions have not been compared. However, we speculate that SNR is a more important factor for DTT in other brain regions where geometric distortion is less than it is in the pons. In our experience, not included in this study, the number of fibers seen in DTT of the pyramidal tract above the pons was maximal at R factor 2, rather than R factor 3, in the majority of subjects.
Our study had some limitations. First, fractional anisotropy and the angle between two contiguous eigenvectors were adopted for thresholding in DTT, following the methods used in many previous studies (121314151822). The fiber number of the pyramidal tract could be affected by the particular thresholds used. However, in this study we aimed to compare the relative fiber numbers measured at different R factors, not to determine their absolute values. Thus, our results may not be sensitive to the choice of threshold values. Second, only the fiber number of the pyramidal tract was utilized to assess the outcome of DTT, and other DTI domains such as fractional anisotropy and mean diffusivity were not evaluated. However, we speculate that fractional anisotropy and mean diffusivity must also be affected by the SNR and image distortion. Therefore, our results can likely be expanded to the investigation of other DTI domains in the brainstem in future studies. Third, the presence of individual variation in fiber number, as reported by Reich et al. (23), was not considered in our study. However, the purpose of our study was to evaluate intrasubject differences in fiber number using different R factors, not to assess intersubject differences. Therefore, individual variation will have had little impact on the results of our study. Lastly, our study was conducted using a certain type of MRI system among the many commercially available; therefore, practical application of our methods may not be generalizable to all clinical MRI systems. According to our results, however, the balance between the SNR and image distortion effects should be considered for any type of MRI system used for EPI-based DTT in the brainstem.
In conclusion, R factor 3 is optimal for DTT of the pyramidal tract through the pons. The number of visible fibers in the pyramidal tract was influenced by the combined effect of the SNR and image distortion, which depended on the R factor. A balanced consideration of the SNR and image distortion is necessary for DTT in the pons.


 XML Download