Abstract
Purpose
We aimed to investigate the prevalence and allergen sensitization of allergic rhinitis (AR) in preschool children. We assessed the relationship of AR, allergen sensitization, and air pollutants.
Methods
Between 2012 and 2016 in Jincheon, skin prick testing and questionnaire survey were performed on 2,958 children. AR have diagnosed on the basis of current symptoms and sign of AR on the Korean International Study of Asthma and Allergies in Childhood questionnaire and 1 or more proven allergen sensitization.
Results
A total of 2,052 children completed survey and skin prick testing, and were included in the analysis. The prevalence of AR symptom within last 12 months and AR were 27.0% and 10.9%, respectively. During study, both prevalences were increased from 20.1% and 8.6%, respectively in 2012 to 29.1% and 12.8%, respectively in 2016. The total inhalant allergen sensitization rate was 32.6%. The most common inhalant allergen was Dermatophagoides farinae (23.1%), followed by Dermatophagoides pteronyssinus (22.5%), tree pollens (5.3%), weed pollens (5.2%), fungi (4.7%), dog hair (4.5%) cat fur (3.6%), grass pollens (1.1%), and cockroach (0.8%). Although there was no difference tree or weed pollen sensitization, pollen seasonal prevalence of current AR symptoms is highest in spring (80%) versus autumn (52.3%). Seasonal PM10 (particulate matter with a median aerodynamic diameter less than or equal to 10 µm in diameter) and SO2 (sulfur dioxide) levels were correlated with the prevalence of seasonal AR symptoms. Pollen seasonal current AR symptoms were significantly related to seasonal pollen sensitization, but not inhalant allergens including dust mites.
Go to : 
REFERENCES
2. Lee SI, Shin MH, Lee HB, Lee JS, Son BK, Koh YY, et al. Prevalences of symptoms of asthma and other allergic diseases in korean children: a nationwide questionnaire survey. J Korean Med Sci. 2001; 16:155–64.

3. Beasley R, Crane J, Lai CK, Pearce N. Prevalence and etiology of asthma. J Allergy Clin Immunol. 2000; 105(2 Pt 2):S466–72.

4. Lee HB, Shin SA, Oh JW. New patterns of childhood asthma pevalence in six Asian countries: comparison of ISAAC phases I and III. Pediatr Allergy Respir Dis. 2008; 18:70–7.
5. Prevalence of allergic diseases in Korean children, 2010 [Internet]. Osong (Korea): Korean Center for Disease Control and Prevention;c2017. [cited 2017 Aug 18]. Available from. http://cdc.go.kr/CDC/cms/content/mobile/33/12633_view.html.
6. Ahn K, Kim J, Kwon HJ, Chae Y, Hahm MI, Lee KJ, et al. The prevalence of symptoms of asthma, allergic rhinoconjunctivitis, and eczema in Korean children: nationwide cross-sectional survey using complex sampling design. J Korean Med Assoc. 2011; 54:769–78.

7. Kwon SE, Lim DH, Kim JH, Son BK, Park YS, Jang HJ, et al. Prevalence and allergens of allergic rhinitis in children and adolescents in Gwangju. Allergy Asthma Respir Dis. 2015; 3:54–61.

8. Lim DH. Epidemiology of allergic rhinitis in Korean children. World Allergy Organ J. 2015; 8(Suppl 1):A41.

9. Morgenstern V, Zutavern A, Cyrys J, Brockow I, Koletzko S, Krämer U, et al. Atopic diseases, allergic sensitization, and exposure to traffic-related air pollution in children. Am J Respir Crit Care Med. 2008; 177:1331–7.

10. Jung DY, Leem JH, Kim HC, Kim JH, Hwang SS, Lee JY, et al. Effect of traffic-related air pollution on allergic disease: results of the children's health and environmental research. Allergy Asthma Immunol Res. 2015; 7:359–66.

11. Gehring U, Wijga AH, Brauer M, Fischer P, de Jongste JC, Kerkhof M, et al. Traffic-related air pollution and the development of asthma and allergies during the first 8 years of life. Am J Respir Crit Care Med. 2010; 181:596–603.

12. Korean Ministry of Environment, Air Korea [Internet]. Incheon (Korea): AirKorea;c2017. [cited 2017 Aug 18]. Available from. http://www.airkorea.or.kr/pastSearch.
13. Keil T, Bockelbrink A, Reich A, Hoffmann U, Kamin W, Forster J, et al. The natural history of allergic rhinitis in childhood. Pediatr Allergy Immunol. 2010; 21:962–9.

14. Kurukulaaratchy RJ, Karmaus W, Raza A, Matthews S, Roberts G, Arshad SH. The influence of gender and atopy on the natural history of rhinitis in the first 18 years of life. Clin Exp Allergy. 2011; 41:851–9.

15. Marinho S, Simpson A, Lowe L, Kissen P, Murray C, Custovic A. Rhino-conjunctivitis in 5-year-old children: a population-based birth cohort study. Allergy. 2007; 62:385–93.
16. Mai XM, Almqvist C, Nilsson L, Wickman M. Birth anthropometric measures, body mass index and allergic diseases in a birth cohort study (BAMSE). Arch Dis Child. 2007; 92:881–6.

17. Tan TN, Shek LP, Goh DY, Chew FT, Lee BW. Prevalence of asthma and comorbid allergy symptoms in Singaporean preschoolers. Asian Pac J Allergy Immunol. 2006; 24:175–82.
18. Wang XS, Tan TN, Shek LP, Chng SY, Hia CP, Ong NB, et al. The prevalence of asthma and allergies in Singapore; data from two ISAAC surveys seven years apart. Arch Dis Child. 2004; 89:423–6.

19. OECD Environmental Performance Reviews: Korea 2017 [Internet]. Pari: OECD iLibrary;c2017. [cited 2017 Sep 17]. Available from. http://www.oecd-ilibrary.org/environment/oecd-environmental-performance-reviews-korea-2017_9789264268265-en.
20. Chiu CY, Huang YL, Tsai MH, Tu YL, Hua MC, Yao TC, et al. Sensitization to food and inhalant allergens in relation to atopic diseases in early childhood: a birth cohort study. PLoS One. 2014; 9:e102809.

21. Schoos AM, Chawes BL, F⊘lsgaard NV, Samandari N, B⊘nnelykke K, Bisgaard H. Disagreement between skin prick test and specific IgE in young children. Allergy. 2015; 70:41–8.
22. Rhodes HL, Thomas P, Sporik R, Holgate ST, Cogswell JJ. A birth cohort study of subjects at risk of atopy: twenty-two-year follow-up of wheeze and atopic status. Am J Respir Crit Care Med. 2002; 165:176–80.
23. Lee YL, Shaw CK, Su HJ, Lai JS, Ko YC, Huang SL, et al. Climate, traffic-related air pollutants and allergic rhinitis prevalence in middle-school children in Taiwan. Eur Respir J. 2003; 21:964–70.

24. Kim BK, Kim JY, Kang MK, Yang MS, Park HW, Min KU, et al. Allergies are still on the rise? A 6-year nationwide population-based study in Korea. Allergol Int. 2016; 65:186–91.

Go to : 
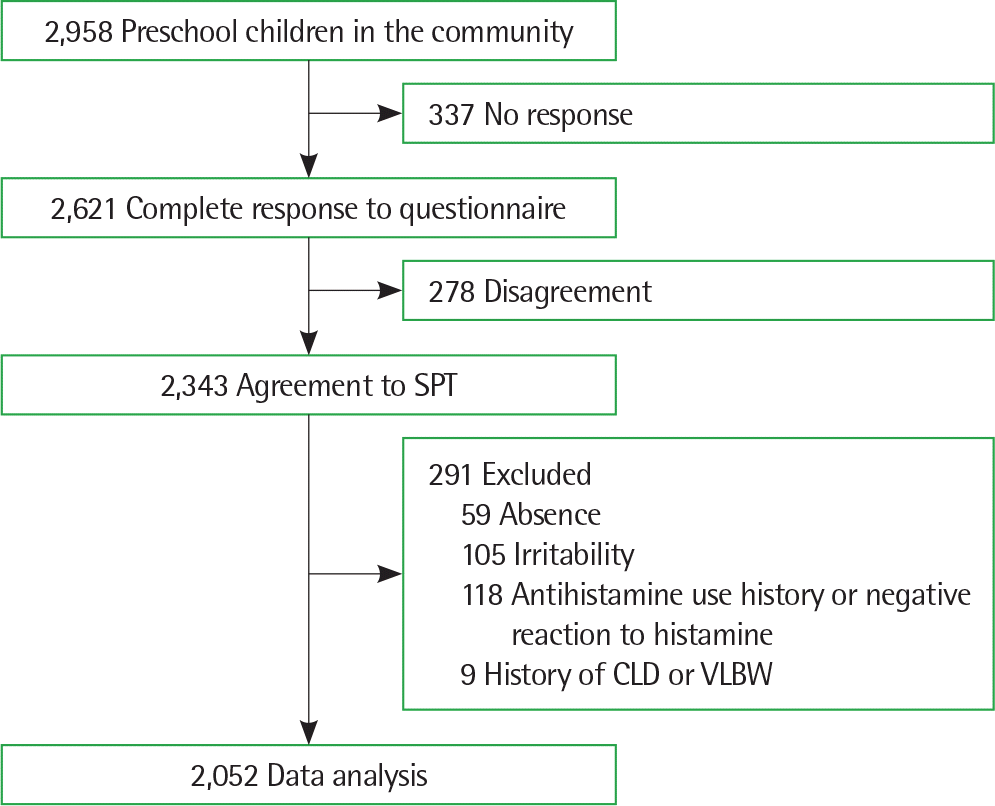 | Fig. 1.Trial profile. SPT, skin prick test; CLD, chronic lung disease; VLVW, very low birth weight. |
 | Fig. 2.Prevalence of allergic rhinitis (AR) symptom within 12 months (A) and AR with based on questionnaire and inhalant allergen sensitization (B). Error bars repre-sents 95% confidence interval. The solid line shows trend of prevalence. ∗ P<0.05. ∗∗ P<0.01. |
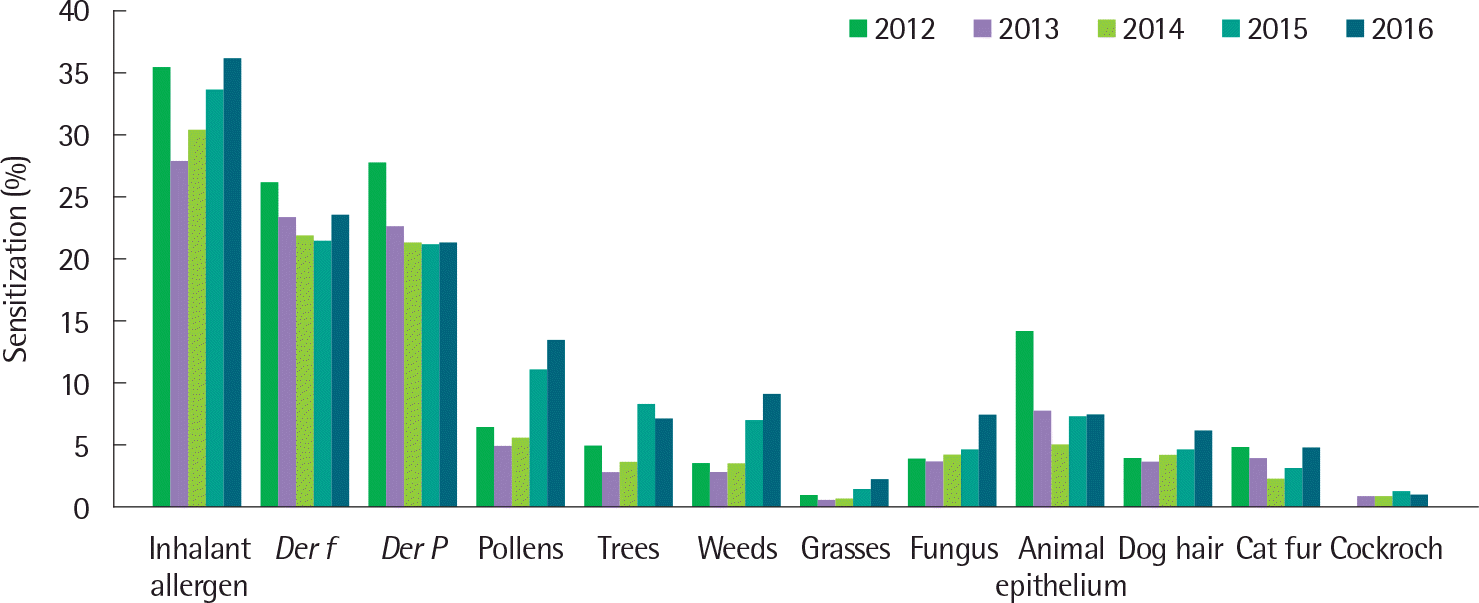 | Fig. 3.Sensitization rate of allergen types in preschool children according to year. Der f, Dermatophagoides farinae; Der p, Dermatophagoides pteronyssinus. |
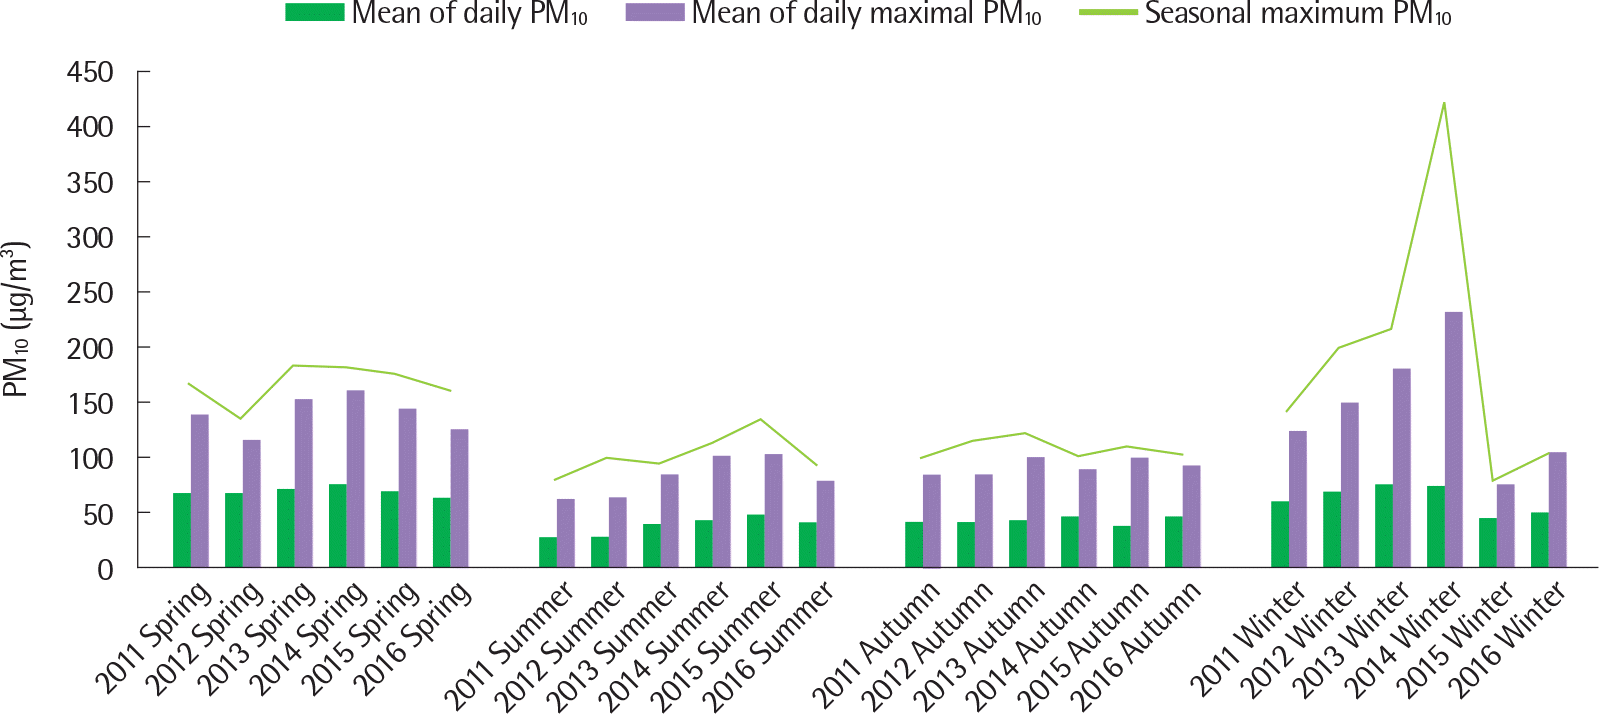 | Fig. 4.Seasonal trend of coarse particulate matter (PM10) in study area. PM10, particulate matter with a median aerodynamic diameter less than or equal to 10 µm in diameter. |
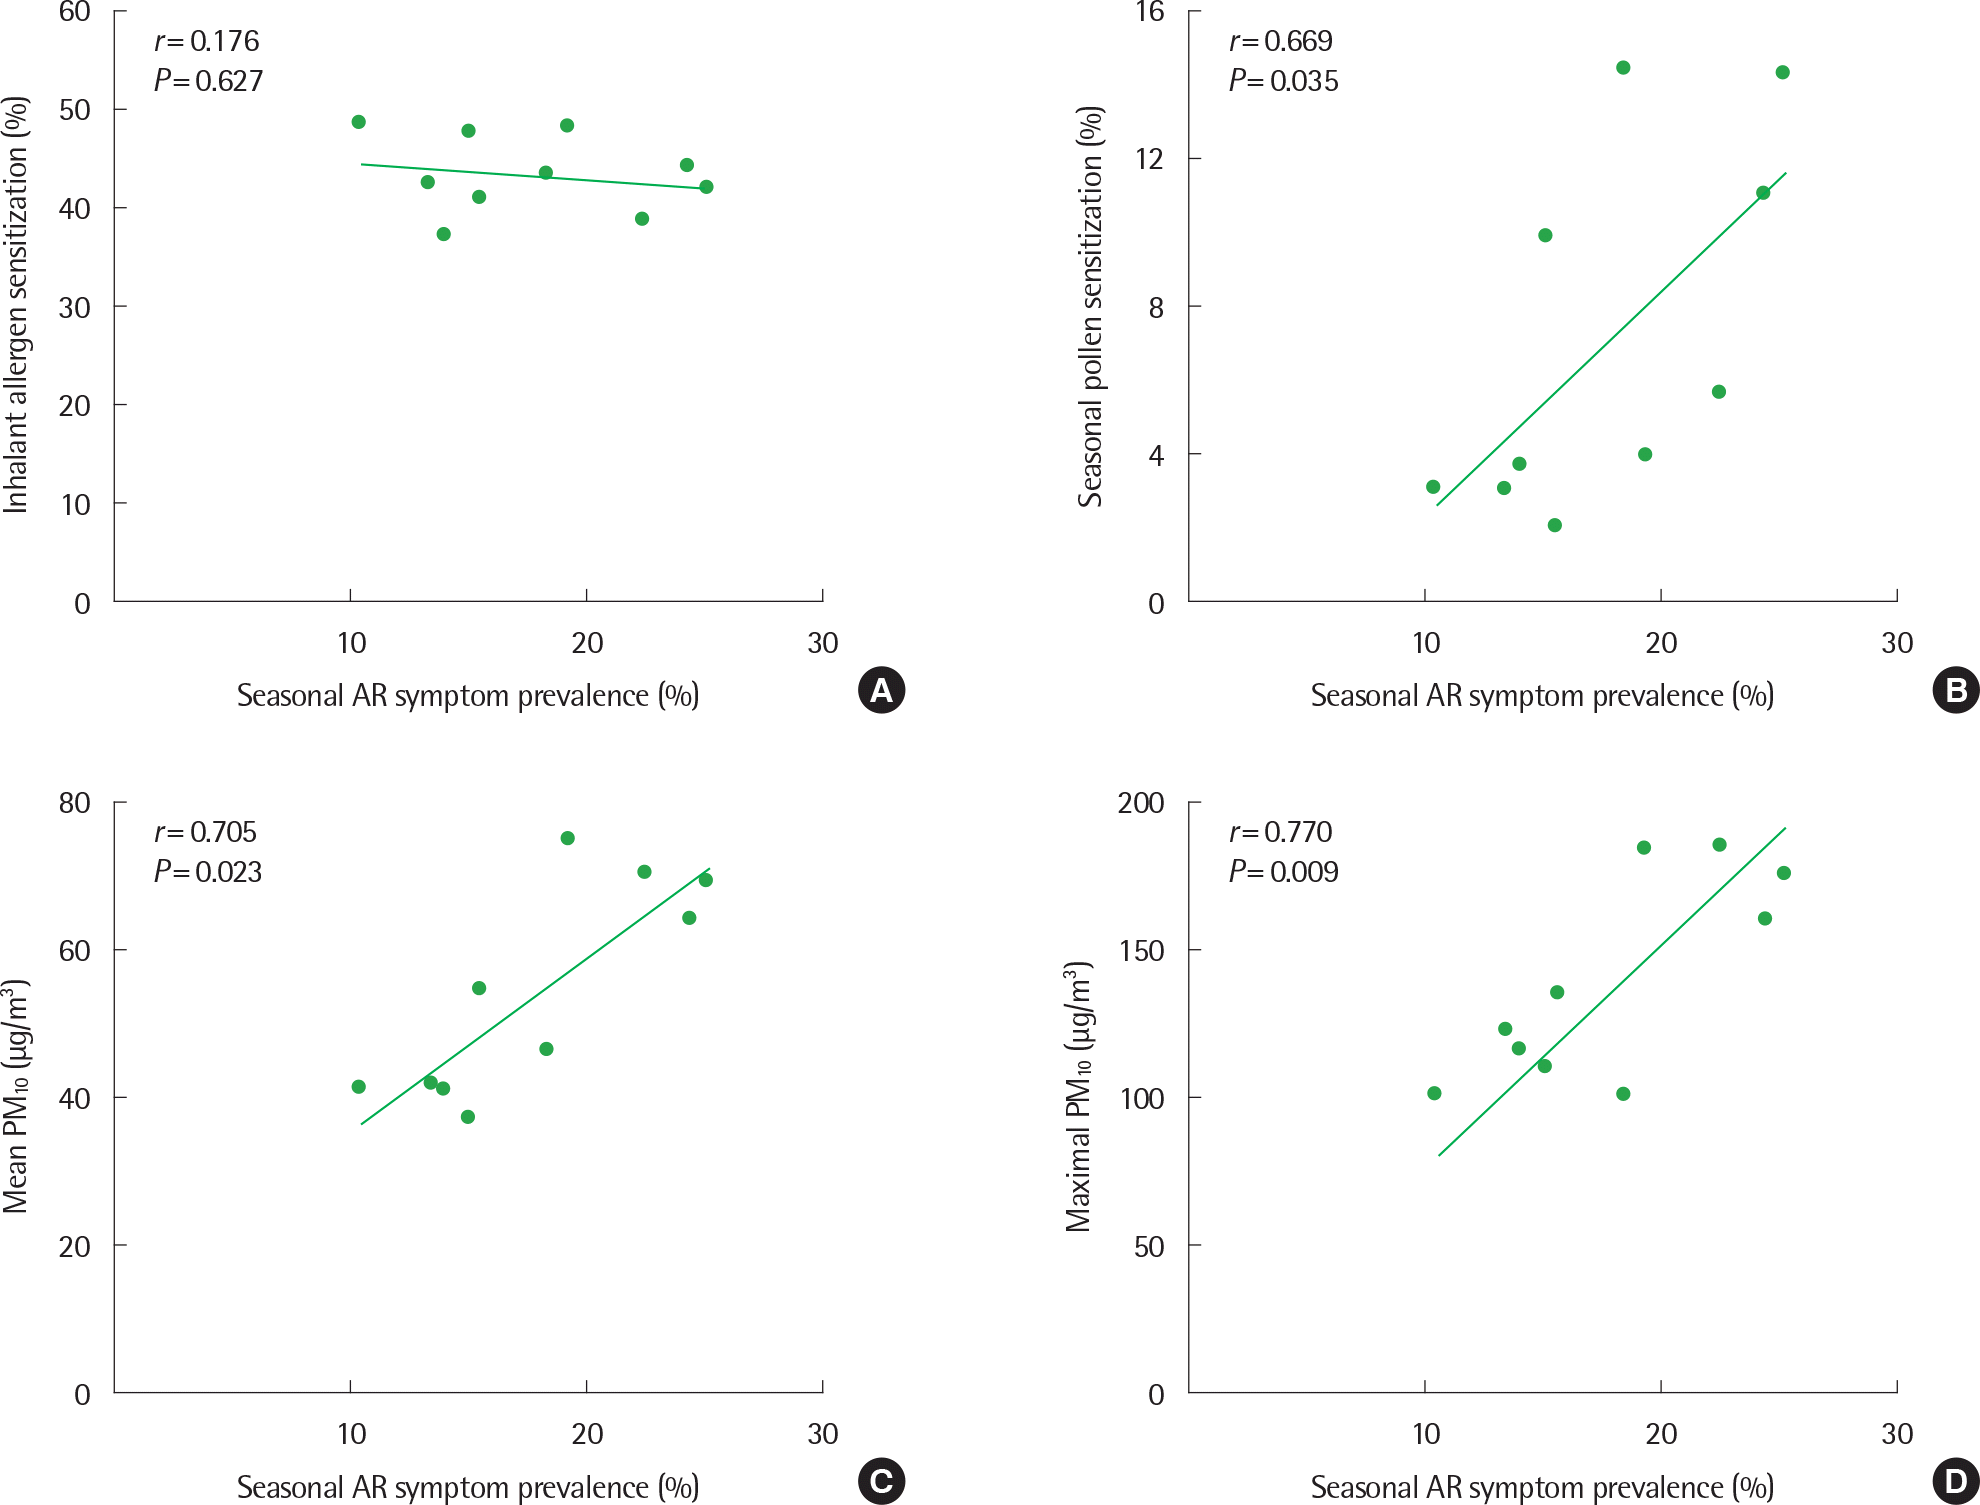 | Fig. 5.The correlation between prevalence of current spring and autumn seasonal symptoms of allergic rhinitis (AR) with aeroallergen sensitization (A), seasonal pollen sensitization (B), seasonal mean of daily PM10 (C), seasonal maximum PM10 (D). PM10, particulate matter with a median aerodynamic diameter less than or equal to 10 µm in diameter. |
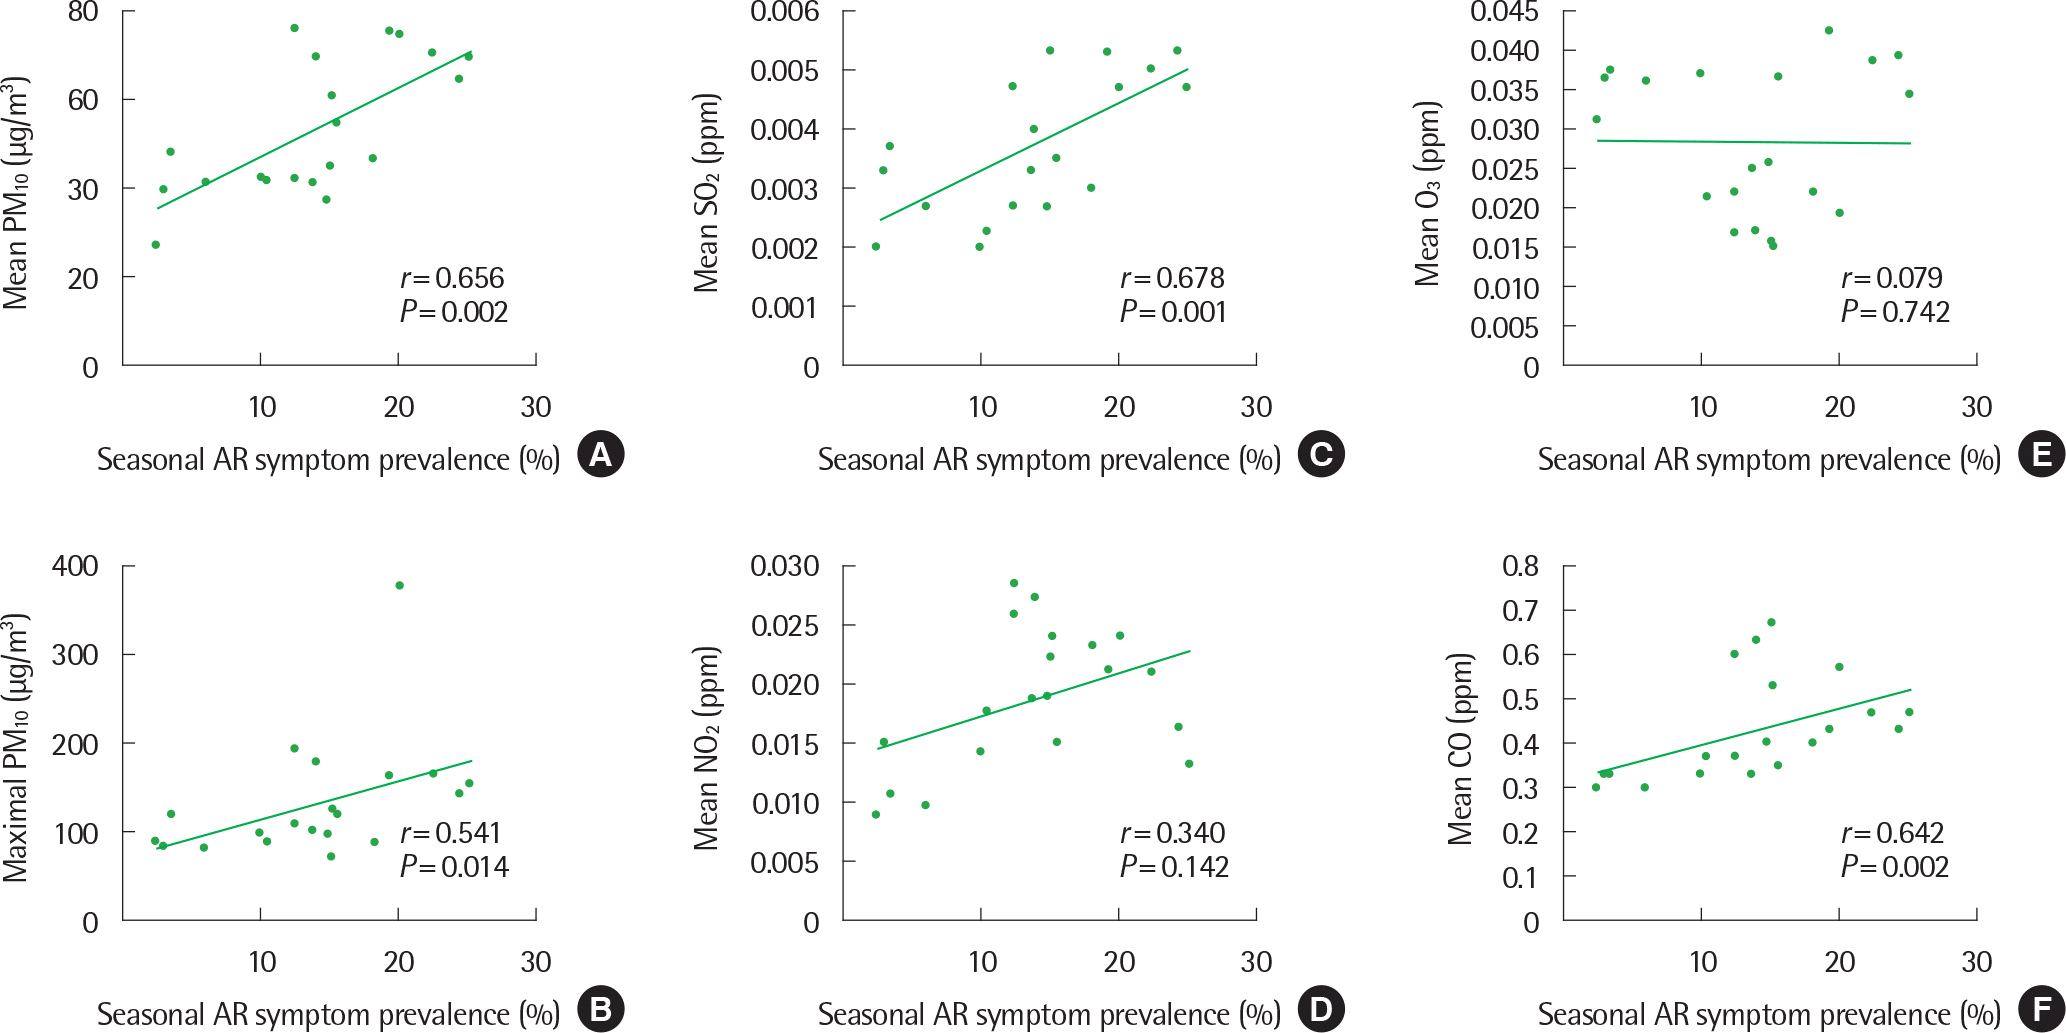 | Fig. 6.(A-F) The correlation between seasonal air pollutant levels and prevalence of each seasonal symptoms of children with allergic rhinitis (AR) symptoms within 12 months. |
Table 1.
Characteristics and allergic rhinitis symptoms of subjects
| Characteristic | 2012 (n=313) | 2013 (n=390) | 2014 (n=525) | 2015 (n=416) | 2016 (n=408) |
|---|---|---|---|---|---|
| Sex, male:female | 160:153 | 201:189 | 270:255 | 196:220 | 204:204 |
| Age (yr) | 5.3 (5.2–5.4) | 5.3 (5.2–5.4) | 4.9 (4.8–5.0) | 5.1 (5.0–5.2) | 5.1 (5.0–5.2) |
| AR-symptom ever (%) | 24.6 (19.8–29.4)∗ | 39.2 (34.4–44.1) | 37.5 (33.4–41.7) | 37.3 (32.6–41.9) | 38.0 (33.3–42.7) |
| AR-symptom within 12 months (%) | 20.1 (15.7–24.6)∗ | 27.9 (23.5–32.4) | 26.5 (22.7–30.3) | 30.0 (25.6–34.5) | 29.2 (24.7–33.6) |
| Seasonal symptom, spring (%) | 15.7 (11.6–19.7)†,‡ | 22.6 (18.4–26.7) | 19.4 (16.0–22.8) | 25.2 (21.0–29.4)† | 24.5 (20.3–28.7)‡ |
| Seasonal symptom, summer (%) | 2.6 (0.8–4.3) | 3.1 (1.4–4.8) | 10.1 (7.5–12.7) | 3.6 (1.8–5.4) | 6.1 (3.8–8.5) |
| Seasonal symptom, autumn (%) | 10.5 (7.1–14.0)§ | 13.8 (10.4–17.3) | 12.6 (9.7–15.4) | 18.3 (14.5–22.0)§ | 15.0 (11.5–18.4) |
| Seasonal symptom, winter (%) | 15.3 (11.3–19.3) | 14.1 (10.6–17.6) | 12.6 (9.7–15.4) | 20.2 (16.3–24.1) | 15.2 (11.7–18.7) |
Table 2.
Annual changes in air pollution of study area
Table 3.
Prevalence of allergic rhinitis (AR, defined as AR symptom within 12 months and aeroallergen sensitization)
| Year | 2012 | 2013 | 2014 | 2015 | 2016 |
|---|---|---|---|---|---|
| AR-symptom ever (%) | 24.6 (19.8–29.4)∗ | 39.2 (34.4–44.1) | 37.5 (33.4–41.7) | 37.3 (32.6–41.9) | 38.0 (33.3–42.7) |
| AR-symptom ever with AAS (%) | 10.9 (7.4–14.3)∗ | 13.9 (10.4–17.3) | 14.3 (11.3–17.3) | 14.4 (11.0–17.8) | 17.9 (14.1–21.6) |
| AR-symptom within 12 months (%) | 20.1 (15.6–24.6)∗ | 27.9 (23.5–32.4) | 26.5 (22.7–30.2) | 30.0 (25.6–34.5) | 29.1 (24.7–33.6) |
| AR diagnosis (%) | 8.6 (5.5–11.8) | 10.0 (7.0–13.0) | 10.7 (8.0–13.3) | 12.3 (9.0–15.4) | 12.8 (9.5–16.0) |
| With seasonal symptom in spring (%) | 6.4 (3.7–9.1) | 8.7 (5.9–11.5) | 9.3 (6.8–11.8) | 10.6 (7.6–13.5) | 10.8 (7.8–13.8) |
| With seasonal symptom in autumn (%) | 5.1 (2.6–7.6) | 5.1 (2.9–7.3) | 5.3 (3.4–7.3) | 7.9 (5.3–10.5) | 7.1 (4.6–9.8) |


 PDF
PDF ePub
ePub Citation
 Print
Print


 XML Download