

 PDF
PDF ePub
ePub Citation
 Print
Print


INTRODUCTION
Multiple sclerosis (MS) is a chronic demyelinating and inflammatory disease of the the central nervous system (CNS).12 Genetic factors contribute markedly to the susceptibility to MS, since the children of affected parents have a tenfold higher risk of developing the condition than the general population.3
It has been demonstrated that the human leukocyte antigen (HLA) gene is closely related to MS susceptibility. The HLA gene contains a great many genes (HLA class I, II, and III) residing on chromosome 6, which is related to immune system function in humans. The proteins encoded by the HLA class I and II regions are involved in antigen processing and presentation, and play a major role in autoimmune events. MS is believed to be an immune-mediated disorder that leads to recurrent immune attacks on the CNS.4
Recent genome-wide association studies (GWASs) have identified many loci with modest effects.567 However, previous GWASs used single-nucleotide polymorphisms (SNPs) as a basic analysis unit,5689 and adopted stringent thresholds of significance to control for the false-positive rate. This approach resulted in a large number of SNPs with potential effects being filtered out and ignored.
The gene-based GWAS study strategy, involving analyzing all variants within a putative gene, has proved to be more powerful than regular single-SNP-based GWASs for detecting disease susceptibility genes.101112 To detect "novel" genes associated with MS, we performed a gene-based GWAS using the Knowledge-based mining system for Genome-wide Genetic studies (KGG; http://statgenpro.psychiatry.hku.hk/limx/kgg/index.html)10 in an initial study sample containing 931 family trios.8 We also performed other functional analyses to supplement the evidence regarding the relevance of the novel genes to MS.
METHODS
Samples
The initial GWAS sample included a total of 931 family trios, each of which consisted of an affected MS child and both parents. The replication sample contained 978 cases and 883 controls. The MS patient was diagnosed according to the McDonald criteria.13 Both the initial and replication study samples included all clinical subtypes and partial clinically isolated syndromes. However, the replication study had the priority to include patients with the relapsing onset form of MS. Institutional Review Board was exempted because this study used public available database of Genotypes and Phenotypes (dbGaP) which dose not involve any personal information. The study samples, genotyping, quality control, and SNP exclusion criteria have been described previously.89
Gene-based GWAS
The gene-based GWAS and replication analysis were based on the probability values generated in previous genome-wide SNP-based association studies and downloaded from the dbGaP (http://www.ncbi.nlm.nih.gov/gap/?term=multiple+sclerosis, accession number: phs000139 and phs000171). We used the Gene-Based Association Test Using Extended Simes Procedure analysis method modeled in KGG 2.5 (http://statgenpro.psychiatry.hku.hk/limx/kgg/index.html).10 The SNPs, ranging from the upstream 5 kb at the 5' end to the downstream 5 kb at the 3' end, were assigned to one gene. In total, 48% of SNPs across the whole genome were assigned to genes.
Differential expression analysis for MS-associated genes
We downloaded four gene-expression data sets from the Gene Expression Omnibus (GEO) of the National Center for Biotechnology Information (http://www.ncbi.nlm.nih.gov/geo; GSE21942, GSE27694, GSE16461, and GSE52139). A case-control study design was used to investigate all four data sets, and multiple cell types were investigated, including peripheral blood mononuclear cells (PBMCs), CD34+ hematopoietic progenitor cells (HPCs), CD8+ T lymphocytes, and spinal cord. The study design data analysis are described in detail elsewhere.14151617 Differentially expressed genes between MS cases and controls were identified by comparing mean gene-expression signals in MS cases versus controls and analyzing the findings using t-tests.
Protein-protein interaction network
MS-associated gene interactions and associations were detected by protein-protein interaction analysis, conducted by searching the Search Tool for the Retrieval of Interacting Genes/Proteins (STRING) database (http://string-db.org/). The STRING database integrates known and predicted associations derived from a genomic context, high-throughput experiments, coexpression, and previous knowledge (text mining).18
Functional annotation clustering analysis
The probability of the identified MS-associated genes clustering in a Gene Ontology (GO) term or a particular biological pathway as defined by the GO project and Kyoto Encyclopedia of Genes and Genomes database was tested by performing a functional annotation clustering analysis using the Database for Annotation, Visualization and Integrated Discovery integrated database query tools (http://david.abcc.ncifcrf.gov/).1920 The enrichment was measured quantitatively using Fisher's exact test, and the Bonferroni method21 was adopted to correct for multiple testing.
RESULTS
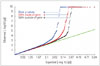
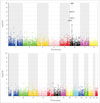
Quantile-quantile plots of the association results for the original genome scan and the present gene-based GWAS are shown in Fig. 1, in which probability values (shown as -log10 values) for all 20,761 genes and all SNPs are plotted against the expected null distribution. The tail of the distribution of gene-based probability values deviated more significantly than those of SNPs inside or outside of the gene. The distribution of the probability values for the present gene-based GWAS is shown in Fig. 2.
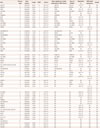
Based on a false discovery rate threshold of 1.40×10⁻⁴, 58 genes were found to be significantly associated with MS in the initial gene-based GWAS (Supplementary Table 1 in the online-only Data Supplement). Among those 58 genes, 53 were located in the HLA region on chromosome 6. In contrast, according to the raw SNP-based probability values, 75 SNPs in 31 genes were found to be significantly associated with MS (threshold of p<1.49×10⁻⁷). Therefore, the present gene-based GWAS detected 27 novel genes that had not previously been detected in the original SNP-based GWAS. After searching the Phenotype-Genotype Integrator (www.ncbi.nlm.nih.gov/gap/phegeni/), a database that archives previous association results, we found that 7 of the 27 genes had already been reported for significant associations (threshold of p<5.0×10⁻⁵). Therefore, among the 58 MS-associated genes that we identified, 20 were considered as novel MS candidate genes. Of note, five of these novel genes were located outside the HLA region.
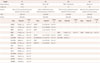
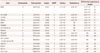
Among the total 58 identified MS-associated genes, 44 genes with genotype data in the replication sample were subjected to further association tests, which revealed that 35 of them (80%) were still significantly associated with MS (p<0.05). Furthermore, 21 of these 58 genes, including 8 novel genes, exhibited differential expression in the differential expression analysis (Table 1). Most interestingly, the genes encoding histone-lysine N-methyltransferase, H3 lysine-9 specific 3 (EHMT2), major histocompatibility complex, Class I, A (HLA-C), and negative elongation factor E (RDBP) exhibited significantly differential expressions between cases and controls in both PBMCs and CD34+ HPCs, and the gene encoding myelin oligodendrocyte glycoprotein (MOG) in PBMCs, CD8+ T lymphocytes, and spinal cord, simultaneously (Table 1).
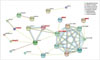
The 58 identified MS-associated genes were retrieved from the STRING database. Only 36 genes, including 10 novel genes, were annotated in this database. The genes at the HLA regions were clearly enriched into two clusters: HLA class I and II clusters (Fig. 3). Two novel genes, those encoding major histocompatibility complex, class, I, A (HLA-A) and major histocompatibility complex, class II, DM alpha (HLA-DMA), were involved in HLA-class I and II clusters, respectively. Another four novel genes, MOG, and those encoding coiled-coil alpha-helical rod protein 1 (CCHCR1), bromodomain-containing protein 2 (BRD2), and chromosome 6 open reading frame 15 (C6orf15), were directly connected with the HLA clusters (Fig. 3).
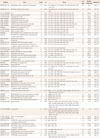
Taking both the replication data and gene-expression data together, we found that 15 novel genes were supported by replicated association and/or differential expression (Table 2). Most interestingly, the significance of four genes—HLA-DMA, CCHCR1, MOG, and the gene encoding HLA complex group 22 (HCG22)—in MS was supported by both the replication and gene-expression studies. In addition, the significance of two non-HLA genes—those encoding family with sequence similarity 69, member A (FAM69A) and POU domain class 2 transcription factor 3 (POU2F3)—in MS was supported by evidence of differential expressions in PBMCs and CD8+ T lymphocytes, respectively.
The identified 58 MS-associated genes were found enriched in 54 GO terms, even after Bonferroni correction (p<0.05) (Supplementary Table 2 in the online-only Data Supplement). Most significantly, 12 genes were enriched in "antigen processing and presentation" (GO: 0019882; p=271.09×10⁻¹⁶), and 11 genes were enriched in "MHC protein complex" (GO: 0012611; p=1.06×10⁻¹⁶).
DISCUSSION
Gene-based association analysis is an efficient method for detecting associations between candidate genes and complex diseases, as it combines signals for all variants within a putative gene. By using this method, several studies have identified new associations between genes and diseases.2223 The present study again highlights the superior power of gene-based association analysis for detecting associations for MS. Specifically, we detected 58 genes significantly associated with MS, including 20 novel genes that were undetected in previous single SNP-based GWASs. Furthermore, associations for 80% of the identified MS-associated genes were replicated.
Most previous association studies have identified only the statistical relevance of genes to MS (at the DNA level), without dissecting the functional mechanisms underlying those associations. In contrast, in the present study we not only established statistical associations between genetic markers and MS at the DNA level, but also performed follow-up differential gene expression analyses and functional annotation clustering analyses as important supplementary methods to analyze the function of causal variants. This supplementary evidence strengthens the likelihood that the eight novel genes identified in this study with significantly differential expressions are directly involved in the pathogenesis of MS.
Recent GWASs have identified a great number of MS-associated genetic loci,59242526 most of which have been mapped to the HLA region. Most of the loci identified in the present study were also located in this region. As we know, the major HLAs are essential elements for immune function. Therefore, our findings also highlight the importance of the autoimmune system in the etiology of MS.
Most interestingly, evidence from association, replication, and differential expression studies strongly supports the significance of the following four genes to MS: MOG, HLA-DMA, CCHCR1, and HCG22. Up to now, the biological function of HCG22 in MS or immunity is unknown. HLA-DMA and CCHCR1 exhibit suggestive associations with rheumatoid arthritis (RA) and psoriasis,272829 respectively, suggesting that both genes are involved in the immune response. The protein encoded by MOG, myelin oligodendrocyte glycoprotein (MOG) is a membrane protein expressed on the surface of oligodendrocyte cells and myelin sheaths.30 MOG is an important candidate target antigen in MS.313233 Monoclonal antibodies against MOG were used to develop an animal model of MS.34 The functions of these genes in MS need further investigation.
In addition, three genes (POU2F3, BRD2, and FAM69A) were expressed differentially in MS-related cells. POU2F3, a non-HLA gene (chromosome 11), is associated with melanoma and cervical cancer.3536 BRD2 is associated with cancer, obesity, type 2 diabetes, RA, and inflammation,373839 and was differentially expressed in the PBMCs of patients with RA (p=2.31×10⁻³, data sets from GEO; www.ncbi.nlm.nih.gov/geo, GSE#: GSE15573). The associations with other autoimmune diseases suggested the possible relevance of BRD2 and POU2F3 to MS. The specific functions of FAM69A in MS are unknown. A previous study found that 21 SNPs located at the GFI-EVI5-RPL5-FAM69A locus were positively associated with MS.40 In-depth studies are needed to disclose the functional mechanism of these genes in MS.
It should be noted that since there is strong linkage disequilibrium (LD) at the HLA region, it is reasonable to infer that the significant signals for some of the genetic markers are partially due to their strong LD with true functional variants within the HLA region. Although the supplementary analysis could play a part in analyzing the function of causal variants, it is also necessary to research the functional mechanisms underlying the associations further, especially those between the HLAs and MS.
In conclusion, this gene-based GWAS has identified 20 novel MS-associated genes. The results highlight the advantages of gene-based association analysis over single SNP-based GWASs for detecting susceptibility genes for MS. The new findings may provide novel insights into the molecular mechanisms underlying MS.
 XML Download