

 PDF
PDF ePub
ePub Citation
 Print
Print


INTRODUCTION
With an increase in the demand for adult orthodontics, the demand for esthetic orthodontic appliances that can replace the commonly used metal brackets is also increasing.1 Conventional orthodontic brackets frequently increase the risk of carious lesions and cause gingivitis and periodontitis because of surrounding plaque accumulation.2 This results in impaired oral health in addition to poor esthetics during orthodontic treatment.3 To remedy this problem, transparent orthodontic aligners (TOAs) have been introduced as alternatives for fixed brackets and wires. TOAs can be easily inserted and removed and do not affect the chewing ability of the patient.4 Therefore, they are widely used in adult orthodontic treatment.5
Tooth movement without the use of bands, brackets, or wires was described as early as 1945 by Kesling,6 who reported the use of a flexible tooth positioning appliance. Subsequently, Sheridan7 and other researchers,89 developed various types of invisible retainers. Align Technology, Inc. (Santa Clara, CA, USA) introduced the Invisalign system two decades ago, which further developed the principles of Kesling, Nahoum, and other researchers using computer-aided design (CAD)/computer-aided manufacturing (CAM) technology combined with laboratory techniques that facilitated the fabrication of a series of customized esthetic dental devices that were removable and could move teeth from the beginning to the end.10 Furthermore, Cassetta et al.11 developed a new orthodontic treatment technique in combination with computer-guided, minimally-invasive flapless corticotomy.
The effectiveness of TOAs for orthodontic treatment has been widely reported. These aligners have been used in clinical applications where stepped teeth have been moved by approximately 0.25 to 0.33 mm. Here, it was shown that activation of the device every 2 weeks was effective for orthodontic tooth movement.1213 TOAs have also been studied using simulation systems and sensors. The force applied on teeth in the x, y, and z directions was measured in patients who received TOAs made from thermoplastic materials based on a three-dimensional (3D)-printed design crafted using CAD/CAM technology.1415 In another study, the force and torque on the teeth were measured using a force-torque sensor after the insertion of TOAs.16 Simon et al.17 quantified the forces and moments delivered on incisors, premolars, and molars by a single aligner and a series of aligners. In addition, Li et al.18 reported that the amount of activation affected the orthodontic force imparted by aligners, and that the amount of lingual bodily movement of the maxillary central incisor for the initial 4 or 5 days is an important aspect of orthodontic treatment incorporating an aligner. However, one study reported that orthodontic treatment with TOAs was not effective because the delivered force was only 60% to 70% of the required force.19
The majority of current aligner manufacturers use modified polyethylene terephthalate glycol (PETG), although polypropylene, polycarbonate, thermoplastic polyurethanes, copolyester, and many other materials are also used.202122
In the present study, we focused on thermoplastic materials used for the fabrication of TOAs, which have been evaluated for their physical and mechanical properties according to the material type and thickness. Ryokawa et al.23 studied the mechanical properties of thermoplastic materials in a simulated oral environment and evaluated thickness changes after thermoforming. Min et al.24 considered the level of forces delivered by thermoplastic TOAs for inducing physiological tooth movement and reported that the thickness of the thermoplastic material affected the amount of deflection after repeated loading and stress. Moreover, the material thickness and amount of deflection showed the largest effect on force and stress. Kwon et al.25 assessed the force delivery properties of thermoplastic orthodontic materials and found that the forces delivered by thin materials were greater than those delivered by thick materials of the same brand. Another study developed a new type of transparent orthodontic appliance using hybrid thermoplastic materials with a multilayered structure and evaluated the mechanical properties using tensile testing.26 However, there are no standard methods for evaluating the mechanical and physical properties of thermoplastic materials used for the fabrication of TOAs.
The purpose of the present study was to address this gap by systematically evaluating the physical and mechanical properties of TOAs in consideration of the clinical environment in which they would be applied. A multiscale evaluation was performed after the thermoforming of various thermoplastic materials with different thicknesses in order to test the null hypothesis that the mechanical and physical properties of all materials would remain unchanged after thermoforming.
MATERIALS AND METHODS
Specimen preparation
The following thermoplastic materials used for the fabrication of TOAs were evaluated in this study: Duran (Scheu Dental, Iserlohn, Germany), eCligner (eCligner, Seoul, Korea), Essix A+ (Dentsply Raintree Essix, Sarasota, FL, USA), and Essix ACE (Dentsply Raintree Essix). The properties of each material and the thermoforming conditions (thicknesses, temperatures, heating times, and cooling times) are shown in Table 1. Specifically, 0.5-mm-thick Duran, Essix A+, and eCligner; 0.75-mm-thick Duran, Essix A+, Essix ACE, and eCligner; and 1.0-mm-thick Duran, Essix A+, and Essix ACE were used.
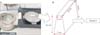
Models were constructed to mimic the average length (2 mm), clinical crown height (8.5 mm), and width (7 mm) of the maxillary central incisor in Korean adults.24 A fabricated mold was placed in a thermoforming caster (Biostar®; Scheu Dental). Heat and vacuum were applied during thermoforming as recommended by the manufacturer. The models generated from the deformed thermoplastic materials were removed, and surface X was cut out from each model and used as a specimen for analysis (Figure 1).
Measurement of transparency using spectrophotometry
The transparency was measured for five specimens of each material and thickness before and after thermoforming. For measurement of the transparency of each specimen, visible light (400–700 nm) was used in the transmittance mode of a spectrophotometer (CM-3500D; Konica Minolta, Tokyo, Japan). The transparency T was calculated using the following formula:

where ls is the energy reflected by the white calibration plate on the light source and l0 is the energy transmittance through the specimen from the light source reflected on the white calibration plate.
Water absorption and water solubility
For all four materials, tests for water absorption and solubility were performed according to International Organization for Standardization (ISO) 20795-2 (2013). Five specimens of the thickest material from each brand (1.0 mm for all except eCligner, which was 0.75 mm) were prepared and stored at 37℃ ± 1℃ for 14 days. Then, water absorption (Wsp) was calculated using the following formula:

where m2 is the mass of the specimen in mg after immersion in water, m3 is the reconditioned mass of the specimen in mg, and V is the specimen volume in mm3. In addition, the water solubility (Wsl) was calculated using the following formula:

where m1 is the mass of the specimen in µg before immersion in water.
Surface hardness test
Five specimens of the thickest material from each brand were prepared (1.0 mm for all except eCligner, which was 0.75 mm), and their surface hardness was measured using the Knoop hardness tester (DMH-2; Mastsuzawa Siki Co. Ltd., Akita, Japan). An indentation was created by application of a load of 9.8 N for 10 seconds, and the size of the indentation was measured to calculate the Knoop hardness using the following formula:

where HK is the Knoop hardness, P = 9.8 N, and l is the length of the indentation along the long axis of the specimen.
Three-point bending test
For all four materials, a three-point bending test was performed according to ISO 20795-2 (2013).32 Five specimens for each material and thickness were prepared with a length of 24 mm in order to take into account the actual clinical situation. The flexure modulus of each specimen was measured using a universal testing machine (Model 3366; Instron®, Norwood, MA, USA). A strain interval of 0.5 mm was set from 0.5 to 1.0 mm at a crosshead speed of 5 mm/min. The 0.5- to 1.0-mm range was selected on the basis of a previous clinical finding that TOAs could induce the movement of stepped teeth by approximately 0.25 to 0.33 mm.1213
The flexure modulus was calculated using the following formula:

Where F1 is the maximum force at 0.5 mm of deflection, F2 is the maximum force at 1.0 mm of deflection, d1 is 0.5 mm of deflection, d2 is 1.0 mm of deflection, l is the distance, b is the width, h is the height, and E is the flexure modulus.
Tensile test
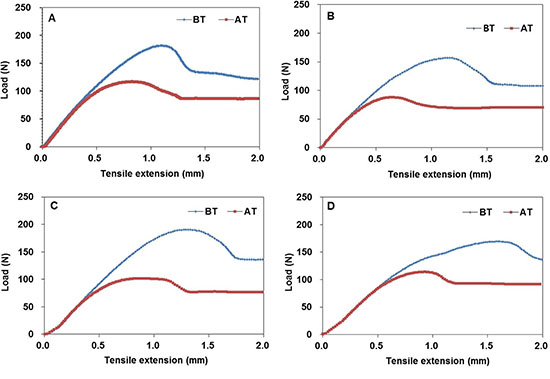
Six rectangular specimens for each material and thickness were prepared with a breadth of 5 mm and length of 40 mm. A tensile test was performed using a universal testing machine (Model 5942; Instron®). The distance between the points supporting the specimen was 20 mm. The elastic modulus was determined by setting the crosshead speed at 12 mm/min.
Statistical analysis
All data are expressed as means ± standard deviations. Data for each material and thickness were analyzed using one-way analysis of variance (ANOVA) with post-hoc analysis using Tukey's test. Student's t-test was used to compare the values before and after thermoforming among each material and thickness (p < 0.01). All statistical analyses were performed using statistical software (IBM SPSS Statistics for Windows, version 23.0; IBM Co., Armonk, NY, USA).
RESULTS
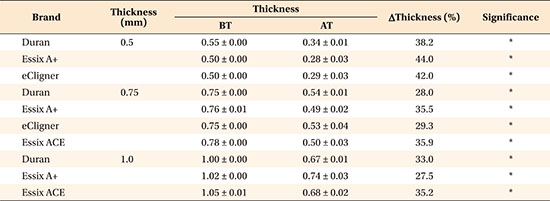
After thermoforming, the transparency of 0.5- and 0.75-mm-thick eCligner exhibited a greater decrease than that of Duran and Essix A+ of the same thicknesses, while the transparency of 0.75-mm-thick Essix ACE exhibited a greater decrease than that of 0.75-mm-thick eCligner. Moreover, the transparency of the 0.5-, 0.75-, and 1.0-mm-thick Duran and Essix A+ specimens was significantly lower after thermoforming than before thermoforming, whereas there were no significant differences for the eCligner and Essix ACE specimens of all thicknesses before and after thermoforming (Table 2).
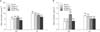
The water absorption ability was the highest for eCligner before thermoforming and Duran after thermoforming. Before thermoforming, the water solubility of eCligner was higher than that of Duran, Essix A+, and Essix ACE. After thermoforming, the water solubility of Duran was higher than that of eCligner and Essix ACE. For all four materials, the water absorption ability increased after thermoforming. The water solubility of Duran, Essix A+, and Essix ACE was significantly higher after thermoforming than before thermoforming; the opposite was true for eCligner (Figure 2).
The surface hardness of all four materials showed no significant difference before thermoforming. However, the hardness of the eCligner specimens was greater than that of the Essix A+ and Essix ACE specimens after thermoforming. The Essix A+ and Essix ACE specimens exhibited greater surface hardness after thermoforming than before thermoforming. However, the Duran and eCligner specimens showed no significant difference before and after thermoforming (Figure 3).
Table 3 shows the flexural forces and flexure moduli for the test materials with different thicknesses. At the 0.5-mm thickness, there were no significant differences in flexural forces among eCligner, Duran, and Essix A+, both before and after thermoforming (p > 0.01). At the 0.75-mm thickness, eCligner and Essix A+ showed significantly higher flexural forces than did Duran and Essix ACE (p < 0.01) before thermoforming, while there were no significant differences among materials after thermoforming (p > 0.01). At the 1.0-mm thickness, Essix ACE showed a significantly smaller flexural force than did Duran and Essix A+ before thermoforming (p < 0.01); there were no significant differences after thermoforming (p > 0.01). For all materials and thicknesses, flexural forces were significantly lowered after thermoforming (p < 0.01).
With regard to the flexure modulus for 0.5-mm-thick materials, there were no significant differences between Duran, Essix A+, and eCligner before thermoforming (p > 0.01). However, the flexure modulus for the Duran specimens was significantly lower than that for the Essix A+ and eCligner specimens after thermoforming (p < 0.01). Also, the flexure modulus for all three materials significantly increased after thermoforming (p < 0.01).
At the 0.75-mm thickness, the flexural modulus was significantly higher for Essix A+ and eCligner than for Duran and Essix ACE before thermoforming (p < 0.01). After thermoforming, the modulus for Duran was significantly higher than that for the other materials (p < 0.01). Also, the flexure modulus for the Duran and eCligner specimens significantly increased after thermoforming (p < 0.01), whereas no significant changes were observed for the Essix A+ and Essix ACE specimens.
Finally, at the 1.0-mm thickness, the flexure modulus before thermoforming was the highest for Duran, followed by Essix A+ and Essix ACE (p < 0.01). However, the three materials showed no significant differences in the flexure modulus after thermoforming (p > 0.01). The modulus for all three materials significantly decreased after thermoforming (p < 0.01).
Table 4 shows the tensile forces and elastic moduli for the different materials with different thicknesses (Appendixes 1 and 2). At the 0.5-mm thickness, there were no significant differences among materials, both before and after thermoforming (p > 0.01).
At the 0.75-mm thickness, Essix ACE showed a significantly smaller tensile force than did Duran, Essix A+, and eCligner (p < 0.01) before thermoforming. There were no significant differences among materials after thermoforming (p > 0.01).
At the 1.0-mm thickness, Essix ACE showed a significantly smaller tensile force than did Duran and Essix A+ before thermoforming (p < 0.01). There were no significant differences among materials after thermoforming (p > 0.01). For all materials and thicknesses, tensile forces significantly decreased after thermoforming (p < 0.01).
At the 0.5-mm thickness, the elastic modulus for Duran was significantly higher than that for Essix A+ and eCligner before thermoforming (p < 0.01). However, there was no significant difference among materials after thermoforming. In addition, the elastic modulus for Duran significantly decreased after thermoforming (p < 0.01).
At the 0.75-mm thickness, there were no significant differences in the elastic modulus among the four materials, both before and after thermoforming (p > 0.01). The modulus for Duran and Essix ACE significantly decreased after thermoforming (p < 0.01), whereas there were no significant changes in the modulus for Essix A+ and eCligner.
Finally, at the 1.0-mm thickness, there were no significant differences in the elastic modulus among materials before thermoforming (p > 0.01). After thermoforming, Essix ACE showed a significantly lower elastic modulus than did Duran and Essix A+ (p < 0.01). The modulus for the Essix ACE specimens was significantly lower after thermoforming than before thermoforming (p < 0.01).
DISCUSSION
We performed a multiscale evaluation after the thermoforming of various thermoplastic materials (Duran, Essix A+, Essix ACE, and eCligner) with different thicknesses in order to test the null hypothesis that the mechanical and physical properties of all materials would remain unchanged after thermoforming. For different materials and thicknesses, the results revealed significant changes in different evaluated parameters, including the transparency, water absorption and solubility, surface hardness, flexure and elastic moduli, and tensile and flexural forces, after thermoforming. Thus, the null hypothesis was rejected.
Thermoplastic materials used for TOAs are structurally composed of amorphous or partially crystalline polymers, which allow visible light to pass through and give a transparent appearance. In clinical applications, TOAs are fabricated from thermoplastic materials using 3D-printed models of teeth, in accordance with the temperature, pressure, and time specifications provided by manufacturers. However, there are no standard methods for evaluating the mechanical and physical properties of thermoplastic materials used for the fabrication of TOAs. The present study aims to establish a standard method for these evaluations.
In the present study, transparency was evaluated to investigate the esthetic aspect of the materials, while water absorption and solubility were evaluated to understand how the thermoplastic materials absorb and dissolve saliva when placed in the oral cavity for some duration. The surface hardness determined the rigidity of the materials, while the three-point bending and tensile tests assessed their effectiveness for tooth movement and their durability.
We found that the transparency of materials decreased with an increase in their thickness. In addition, with a decrease in thickness after thermoforming, the transparency also decreased. This finding is inconsistent with that in a previous study showing an increase in transparency with a decrease in thickness.28 In another study, however, the transparency of thermoplastic plates that deformed from amorphous to crystalline structures decreased according to the temperature, pressure, and working time, while light was scattered by the thermoplastic materials after thermoforming.29 Therefore, structural deformation of thermoplastic materials results in decreased transparency. Nevertheless, this transparency change did not compromise the esthetic appearance of TOAs.
TOAs affect orthodontic forces through moisture absorption and expansion in the oral environment. Ryokawa et al.23 reported that water absorption by both PETG and copolyester increased to 0.8 wt% in their 2-week experiment. In addition, water absorption by PETG differed depending on the type of thermoplastic material.23 Zhang et al.30 reported that water absorption increased when polyurethane was added to PETG during the development of a new thermoplastic material for TOAs.
In the present study, all thermoplastic materials showed increased water absorption abilities after thermoforming. In addition, the water solubility of all materials except eCligner increased after thermoforming. If we were to propose an evaluation standard for thermoplastic materials used for the fabrication of TOAs, we would recommend following the water absorption and solubility evaluation methods specified in ISO 20795-2: Orthodontic base polymer.27
The hardness of the thermoplastic materials tested in this study changed after thermoforming. Generally, external forces affect TOAs used for orthodontic treatment. Previous studies compared the surface hardness values for various thermoplastic materials before thermoforming.3132 Vickers hardness was also measured to compare the transfer of force and energy according to the type and thickness of the thermoplastic material, and it was found that the hardness affected the orthodontics force.2533 In the present study, the surface hardness of Essix A+ and Essix ACE increased after thermoforming, whereas that of Duran and eCligner showed no significant changes. Previously, it has been shown that thermoplastic materials crystallize from the amorphous state because of the high temperature and pressure applied to the material, with the regular polymer chains closely arranged over a relatively long distance. Accumulation of the secondary bonding force that holds the polymer chains together results in a binding force larger than that in the amorphous region.34 Thus, the surface hardness may increase with transformation of the amorphous regions into crystalline regions.
To determine the feasibility for using the thermoplastic materials as TOAs in clinical applications, we performed the three-point bending test. The study by Kwon et al.25 showed that changes in the force and resilience of such materials can affect their orthodontic use. Moreover, Min et al.24 showed that thermoplastic materials can be affected by the deflection of load and stress according to their thickness and resilience induced by the thermoforming conditions proposed by the manufacturer. However, these researchers did not evaluate the material properties before and after thermoforming. In the present study, with an increase in the thickness of the thermoplastic materials, the force increased but the flexure modulus decreased (Table 3). The flexure modulus was directly proportional to the force of the thermoplastic materials and inversely proportional to their thickness. Thus, the flexure modulus was higher for thinner materials and lower for thicker materials. Therefore, it is reasonable to use thinner thermoplastic materials for the fabrication of TOAs for orthodontic treatment, considering they align the dentition in a step-by-step manner.35
We performed a tensile test after thermoforming in order to evaluate the durability of the tested thermoplastic materials. Ryokawa et al.23 reported that the force and elastic modulus of some thermoplastic materials used for TOAs decreased in a simulated intraoral environment. In the present study, the force and elastic modulus of all materials decreased after thermoforming. With an increase in the thickness of the materials, the force increased while the elastic modulus decreased (Table 4). If the thermoplastic materials were subjected to a temperature higher than the glass transition temperature, they can easily deform and decrease in thickness. Moreover, they change from the amorphous to the crystalline form with a decrease in temperature, with the crystalline phase affecting the mechanical properties.34 Therefore, the durability of thermoplastic materials used for the fabrication of TOAs should be evaluated before and after thermoforming.
Generally, it is difficult to evaluate thermoplastic materials used for the fabrication of TOAs. However, we applied the recommendations specified in ISO 20795-2: Orthodontic base polymer, using models that reflected the arrangement of the maxillary central incisors in clinical conditions.
This study also has some limitations. First, it did not fully consider intraoral conditions such as salivation and the temperature/humidity. This should be addressed in future studies. In fact, we are currently considering the effects of intraoral conditions and the actual clinical situations in orthodontic patients for the evaluation of TOAs. Moreover, studies considering the mechanical strength under repetitive application of TOAs to assess the fatigability of the device may provide useful information in the future.
CONCLUSION
In conclusion, our findings suggest that the physical and mechanical properties of thermoplastic materials used for the fabrication of TOAs should be evaluated after thermoforming in order to characterize their properties for clinical application. From the clinical perspective, our results imply that TOAs should be carefully selected depending on the treatment required, because some may exhibit a significant decrease in flexural forces after thermoforming and exhibit permanent deformation during treatment. On the other hand, the application of large forces to teeth may result in apical root absorption.
 XML Download