

 PDF
PDF ePub
ePub Citation
 Print
Print


INTRODUCTION
Cephalometry has become a fundamental part of orthodontic practice since its introduction in the field of dentistry, with applications ranging from diagnosis and treatment planning to the evaluation of treatment outcomes. However, conventional cephalograms only provide a two-dimensional (2D) view of three-dimensional (3D) objects, which is a major limitation of this imaging modality. Possible differences in magnifying scales, geometric distortions, superimposition of structures, and potential errors associated with the projecting radiation beam are other problems associated with cephalometry.123 Therefore, clinical efforts to achieve 3D information for orthodontic purposes have been made. More recently, the introduction of cone-beam computed tomography (CBCT) in the field of dentistry has provided clinicians with a tool for obtaining a 3D view of objects. Despite the various advantages of CBCT, the increased exposure to ionizing radiation and relatively high costs are disadvantages for both patients (particularly young patients) and clinicians.4567
For these reasons, several attempts to generate 3D coordinates by reconstructing 2D radiographs such as lateral and frontal cephalograms have been made.8910111213 Currently, two methods for the generation of 3D cephalograms are available, namely the biplanar method, which is based on biplanar geometry (film cassettes are oriented at 90° to each other at the time of exposure),1415 and the coplanar method, which is based on convergent geometry.1617 When the coplanar method is used, the subject is placed in the same physical location and exposed at different time points, with the film cassettes shifted using an automatic cassette changer. However, a dedicated craniofacial stereometric system is required for the coplanar method. The biplanar method, on the other hand, uses lateral and frontal cephalograms that are routinely obtained for orthodontic diagnosis; therefore, it is the preferred method for the construction of 3D cephalograms.8910111218
Kusnoto et al.12 demonstrated the clinical validity of a 3D Ceph™ (Department of Orthodontics, University of Chicago, IL, USA) program for the measurement of 3D distances by combining lateral, frontal, and submentovertex cephalograms. In routine practice, the practitioner can obtain frontal and lateral cephalograms by using a single X-ray beam and a rotational radiographic cassette. However, this requires the patient to change the head posture, which results in the acquisition of images of two different head positions.
The biplanar imaging system enables the simultaneous acquisition of frontal and lateral cephalograms at a 90° angle.15161719 The lateral and frontal images are obtained at a precise angle of 90°, with the patient's head maintained in the same position. Thus, 3D images are reproduced from two X-ray beams emitted from different angles, resulting in increased accuracy.
In the present study, we generated 3D cephalograms from lateral and frontal images obtained using the biplanar imaging system with the 3D Ceph™ program. Our objective was to evaluate the accuracy of 3D cephalograms constructed using the biplanar imaging system by comparing the obtained measurements with those obtained from 3D cephalograms constructed using conventional radiography and CBCT.
MATERIALS AND METHODS
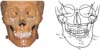
Fifteen dry human skulls with a good dentition and intact skeletal structures were obtained from the Department of Oral Anatomy at the School of Dentistry of Chonnam National University. The study was exempted from approval by the Chonnam National University Dental Hospital Institutional Review Board. To minimize the risk of error during the process of 3D cephalogram construction, two different fiducial markers (“ο” represented the right side and “-” represented the left side) were attached to anatomical landmarks marked on the dry skulls prior to the acquisition of radiographs (Figure 1). The diameter of the “ο” marker was 1 mm, while the length of the “-” marker was 1 mm.
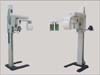
Using conventional radiography and biplanar radiography, lateral and frontal cephalograms were obtained for each skull. For image acquisition, the Frankfort horizontal plane was set parallel to the floor. The distance between the radiation source and the skull was set at 150 cm, while that from the skull to the film was 15 cm. Electric currents were set at 7 to 8 mA, with a voltage of 75 to 85 kVp and an exposure time of 1.6 seconds. Instrumentarium (OrthoCeph® OC100; Instrumentarium Imaging Ind. Co. Ltd., Tuusula, Finland) was used to obtain the conventional lateral and frontal cephalograms. For the acquisition of frontal cephalograms, the skulls were repositioned at a 90° angle because the X-ray beams during conventional radiography were projected from a single point. For biplanar radiography, two instrumentariums were used. Two arrays of X-ray beams were simultaneously projected toward the skulls, with the head posture remaining identical for both lateral and frontal cephalogram acquisition (Figure 2). The magnification of conventional and biplanar images was 110%.
For the purpose of comparison, CBCT-generated cephalograms were also included. A CBCT scanner (Alphard Vega; Asahi Roentgen Co., Kyoto, Japan) was used to generate 3D frontal and lateral images, which were saved using InVivo software (version 5.3; Anatomage, San Jose, CA, USA) for the construction of 3D cephalograms using the “capture to file” function. The frontal and lateral images were colored to enable clearer visualization and easier identification of fiducial markers.
Construction of 3D cephalograms
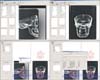
Three types of 3D cephalograms were generated from the images obtained using conventional radiography (3D cephconv), the biplanar imaging system (3D cephbiplanar), and CBCT (3D cephcbct). The 3D Ceph™ program was used to construct 3D cephalograms from the frontal and lateral images generated using the conventional and biplanar imaging methods. When radiographs from different machines were imported into the program, each image size was standardized according to the program settings. Using the program's calibration tool, two points were identified on the image to represent a distance of 10 mm. Each frontal and lateral cephalogram obtained using each of the three techniques were imported into the 3D Ceph™ program. After 25 landmarks were identified, 3D images were generated by connecting the landmarks marked on the frontal and lateral images. Using the 3D log function of the 3D Aligner program (Department of Orthodontics, University of Illinois at Chicago, Chicago, IL, USA), the 3D images were transformed and distances between landmarks were calculated (Figure 3). The definitions of the landmarks used in this study are provided in Table 1. For evaluation of the accuracy of 3D cephalograms constructed from 2D images (conventional and biplanar radiographs) by using CBCT-generated cephalograms as a reference, a total of 25 landmarks were decided. Then, 34 measurements, including oblique (n = 15) measurements and measurements for width (n = 7), depth (n = 7), and height (n = 5), were obtained for each skull.
For statistical analysis, paired t-tests and Bland–Altman plotting were used. The Shapiro–Wilk test showed normal data distribution. Paired t-tests were conducted at a 5% significance level using SPSS software (version 20; IBM Co., Armonk, NY, USA), while Bland–Altman plotting was performed using MedCalc statistical software (Ostend, Belgium).
RESULTS
The mean and standard deviation values for each measurement recorded on 3D cephalograms generated from conventional radiographs and CBCT images are shown in Table 2. Differences in measurements for width, height, and depth ranged from 0.1 to 2.6 mm, while differences in oblique measurements ranged from 0.2 to 2.8 mm. Overall, differences in oblique measurements were greater than those in measurements for width, height, and depth. Paired t-tests were used to compare measurements between the two image sets; the results revealed no significant differences (Table 2).
Table 3 lists the measurements recorded on biplanar 3D cephalograms and CBCT-generated cephalograms. Differences in measurements for height and width ranged from 0.1 to 0.6 mm and from 0.1 to 1.2 mm, respectively. With regard to oblique measurements, differences ranged from 0.0 to 1.4 mm. The results of paired t-tests revealed no significant differences between the two image sets (Table 3). The findings of Bland–Altman plotting showed no systematic differences in measurements between the biplanar 3D cephalograms and CBCT-generated cephalograms (Tables 4 and 5). The magnitude of differences was not large and mostly within a 95% confidence interval (Figure 4).
DISCUSSION
In the present study, we evaluated the accuracy of 3D cephalograms generated using a biplanar imaging system by comparing obtained measurements with those recorded on 3D cephalograms constructed from conventional radiographs and CBCT images. The results revealed no significant differences in measurements among the three image sets, although the cephalograms constructed from conventional radiographs showed larger deviations than those constructed using the biplanar imaging system when CBCT measurements were used as a reference.
Kusnoto et al.12 found that different head orientations and tracing errors could affect the accuracy of 3D cephalograms. In the present study, we used 25 fiducial markers as right, left, and midline anatomical landmarks on the skull in order to minimize landmark identification errors. The use of radiopaque titanium markers enables the accurate digitization of landmarks in both lateral and frontal projections.
During the process of 3D cephalogram construction, obtained coordinates of projected object points are matched using one of two algorithms: vector intercept with averaging algorithm812 or vector intercept with manual adjustment algorithm.9 Both algorithms use the vector principle for the location of landmarks in space. These two algorithms have been shown to have the same degree of accuracy for linear measurements under minimal head rotation and landmark identification errors.8 The only difference between the two algorithms is the involvement of the operator for landmark identification. In the vector intercept with manual adjustment algorithm, the operator can manually correct misidentified landmarks during the process. Although such manual adjustment allows the operator to adjust misidentified landmarks, it is time consuming and inconvenient for quick analysis. The vector intercept with averaging algorithm automatically takes the midpoint of landmarks on two planes (frontal and lateral). Therefore, it is easier to use and less time consuming. In the present study, landmarks were identified with the vector intercept with averaging algorithm.820
For the acquisition of lateral and frontal cephalograms, a single X-ray beam and rotational radiographic cassettes are normally used. However, the patient's head position needs to be changed for this conventional approach, which results in images of different head positions. The biplanar imaging system allows the simultaneous acquisition of frontal and lateral images at a precise angle of 90° angle, without requiring a change in the patient's head position. Thus, 3D images reproduced from two X-ray beams emitted from different angles could have the same geometry. By comparing 3D measurements obtained using conventional and biplanar radiography with those obtained using CBCT, we aimed to prove the accuracy and clinical validity of the biplanar imaging system. Biplanar radiography used an anteroposterior (AP) projection instead of a posteroanterior (PA) projection, because the former is required for composite imaging with clinical facial photographs for further study. According to Na's study,21 differences in identification errors between the AP and PA projections were not statistically significant for any landmark. The magnification of images obtained from conventional and biplanar radiography is 110%. In the present study, we compared 3D cephalograms generated using conventional and biplanar radiography with CBCT-generated cephalograms. While the conventional and biplanar cephalograms were perspective view images with a 150/15-cm setting, the CBCT-generated cephalograms were orthogonal view images which could be used as a reference with direct measurements on the skull.
In the present study, all measurements obtained from biplanar cephalograms showed no statistically significant differences when compared with measurements obtained from conventional radiograph- and CBCT-generated cephalograms. These results indicated that biplanar radiography enables the acquisition of lateral and frontal projections with the same geometry, which results in accurate orthogonal projections. Therefore, clinicians can utilize these 3D cephalograms for various analyses, without the requirement for CBCT. Paired t-tests and Bland–Altman analysis revealed that plots were distributed over a wide area, which meant that there were no consistent patterns. Thus, the results were not significantly different.2223 Most data, with the exception of one or two measurements, were within 95% confidence intervals and distributed within the limits of agreement.
While the 3D cephalograms constructed from conventional radiographs showed larger deviations than did the 3D cephalograms constructed from biplanar images, both image sets were comparable with CBCT-generated cephalograms with regard to all parameters except one. These findings suggest that conventional radiography can be used as an alternative to biplanar radiography. However, in the present study, the subjects were skulls and not living patients. Moreover, the skulls were fixed in a cephalostat, with the Frankfort plane parallel to the floor. Therefore, errors in the head position or head movement were minimized. In the clinical setting, different head orientations and tracing errors could affect the accuracy of 3D cephalograms constructed from conventional radiographs.12
CONCLUSION
Although measurements recorded on 3D cephalograms constructed from conventional radiographs showed no significant differences from those recorded on CBCT-generated cephalograms, they showed larger deviations than measurements recorded on biplanar 3D cephalograms. Thus, more accurate 3D cephalograms can be constructed from biplanar radiographs than from conventional radiographs. Moreover, the biplanar imaging technique may be a useful alternative to CBCT for clinical procedures such as 3D analysis of facial asymmetry. In conclusion, the findings of this study suggest that 3D reconstruction of 2D biplanar radiographs is a useful clinical technique to obtain 3D information without the use of CBCT.


 XML Download