

 PDF
PDF ePub
ePub Citation
 Print
Print


INTRODUCTION
MATERIALS AND METHODS
Subjects
Thickness measurements using optical coherence tomography
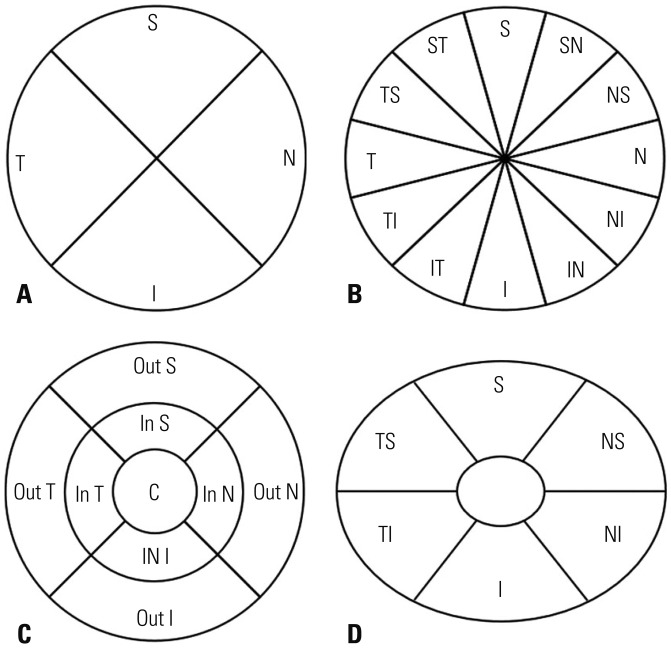 | Fig. 1Sectors used for optical coherence tomography (OCT) thickness measurements of peripapillary retinal nerve fiber layer thickness in both OCT systems (A: 4 sectors, B: 12 sectors). Sectors used for macular thickness (C) and ganglion cell inner plexiform layer thickness (D) measurements are also shown. All sectors shown are those used for right eye analyses. S, superior; N, nasal; I, inferior; T, temporal; SN, superonasal; NS, nasosuperior; NI, nasoinferior; IN, inferonasal; IT, inferotemporal; TI, temporoinferior; TS, temporosuperior; ST, superotemporal; Out S, outer superior; Out N, outer nasal; Out I, outer inferior; Out T, outer temporal; In S, inner superior; In N, inner nasal; In I, inner inferior; In T, inner temporal.
|
Statistical analyses
RESULTS
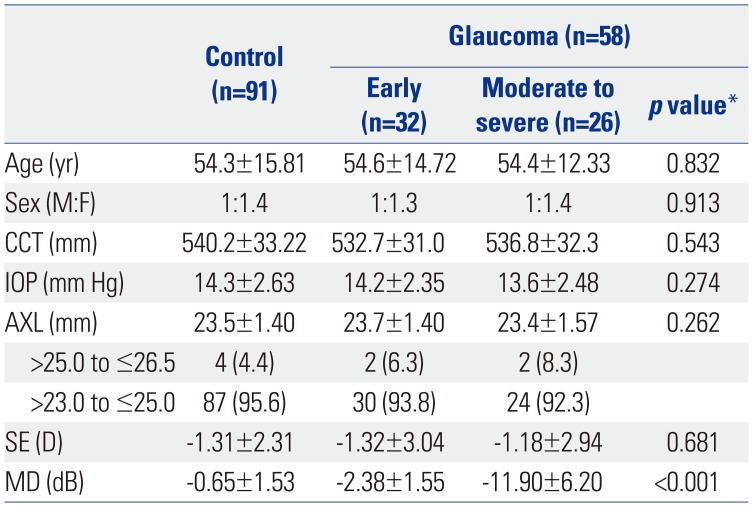
Table 1
Subjects and Ocular Characteristics
![]()
Thickness comparison among control and study groups in each OCT system
Table 2
Average Retinal Layer Thickness in Normal and Glaucomatous Eyes
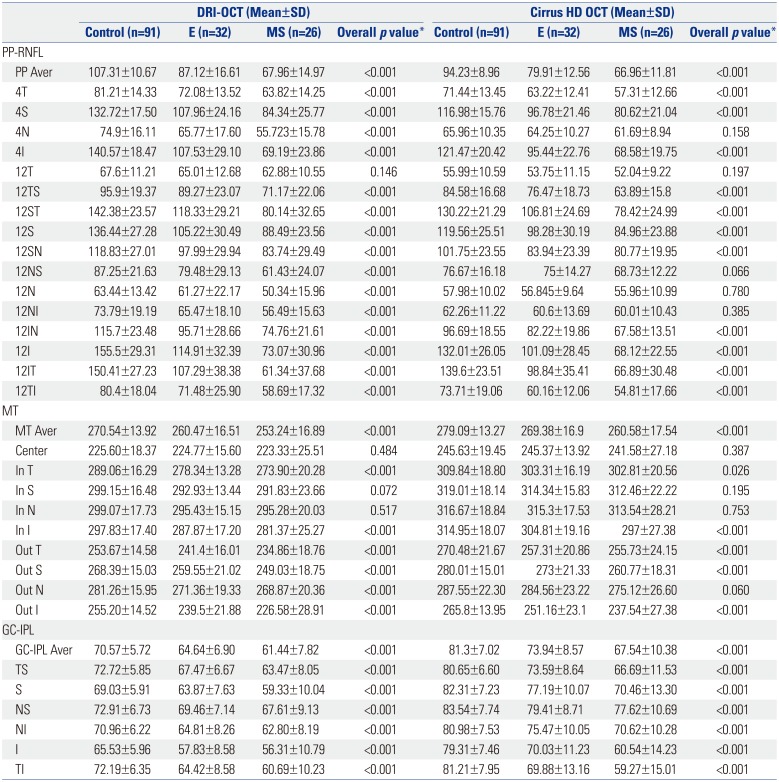
SD, standard deviation; E, early glaucoma; MS, moderate to severe glaucoma; PP-RNFL, peripapillary retinal nerve fiber layer thickness; PP Aver, average PP-RNFL; MT, macular thickness; MT Aver, average MT; GC-IPL, ganglion cell-inner plexiform layer thickness; GC-IPL Aver, average GC-IPL; S, superior; N, nasal; I, inferior; T, temporal; SN, superonasal; NS, nasosuperior; N, nasoinferior; IN, inferonasal; IT, inferotemporal; TI, temporoinferior; TS, temporosuperior; ST, superotemporal; Out S, outer superior; Out N; outer nasal; Out I, outer inferior; Out T, outer temporal; In S, inner superior; In N, inner nasal; In I, inner inferior; In T, inner temporal; TS, temporosuperior; NI, nasoinferior.
*ANOVA test was used for statistical analyses.
![]()
Comparison of glaucoma discrimination ability
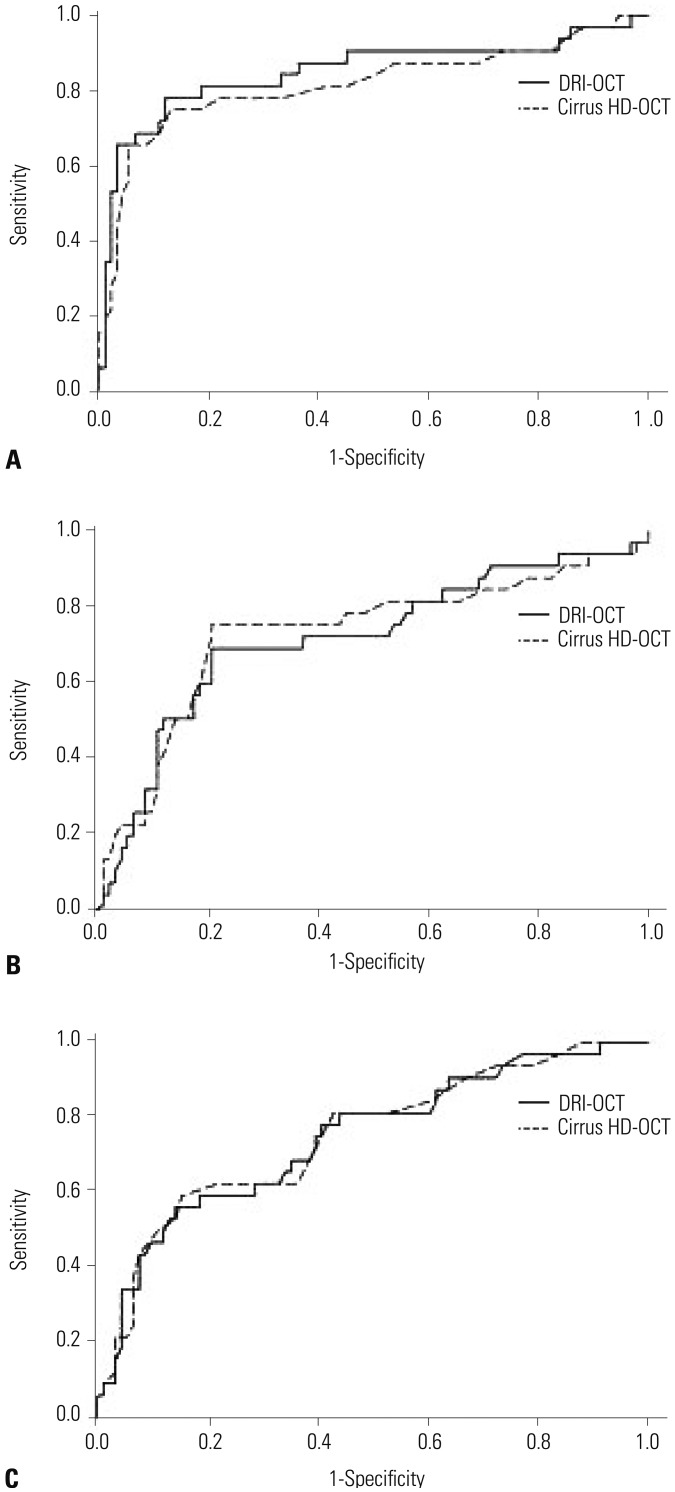 | Fig. 2Receiver operating characteristics curve of average peripapillary retinal nerve fiber layer thickness (A), macular thickness (B), and ganglion cell-inner plexiform layer thickness (C) measurements made with two optical coherence tomography (OCT) modalities (DRI-OCT and Cirrus HD-OCT) between control and early glaucoma.
|
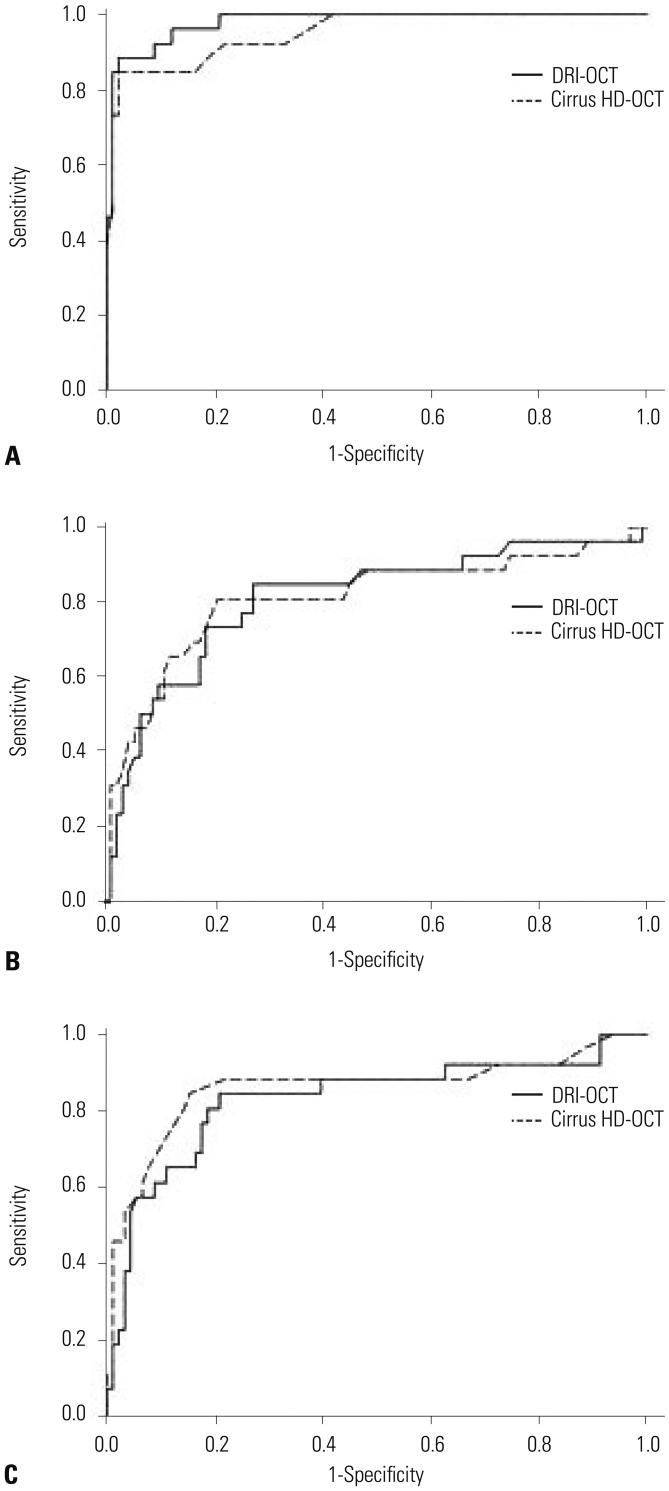 | Fig. 3Receiver operating characteristics curve of average peripapillary retinal nerve fiber layer thickness (A), macular thickness (B), and ganglion cell-inner plexiform layer thickness (C) measurements made with two optical coherence tomography (OCT) modalities (DRI-OCT and Cirrus HD-OCT) between control and moderate to severe glaucoma.
|
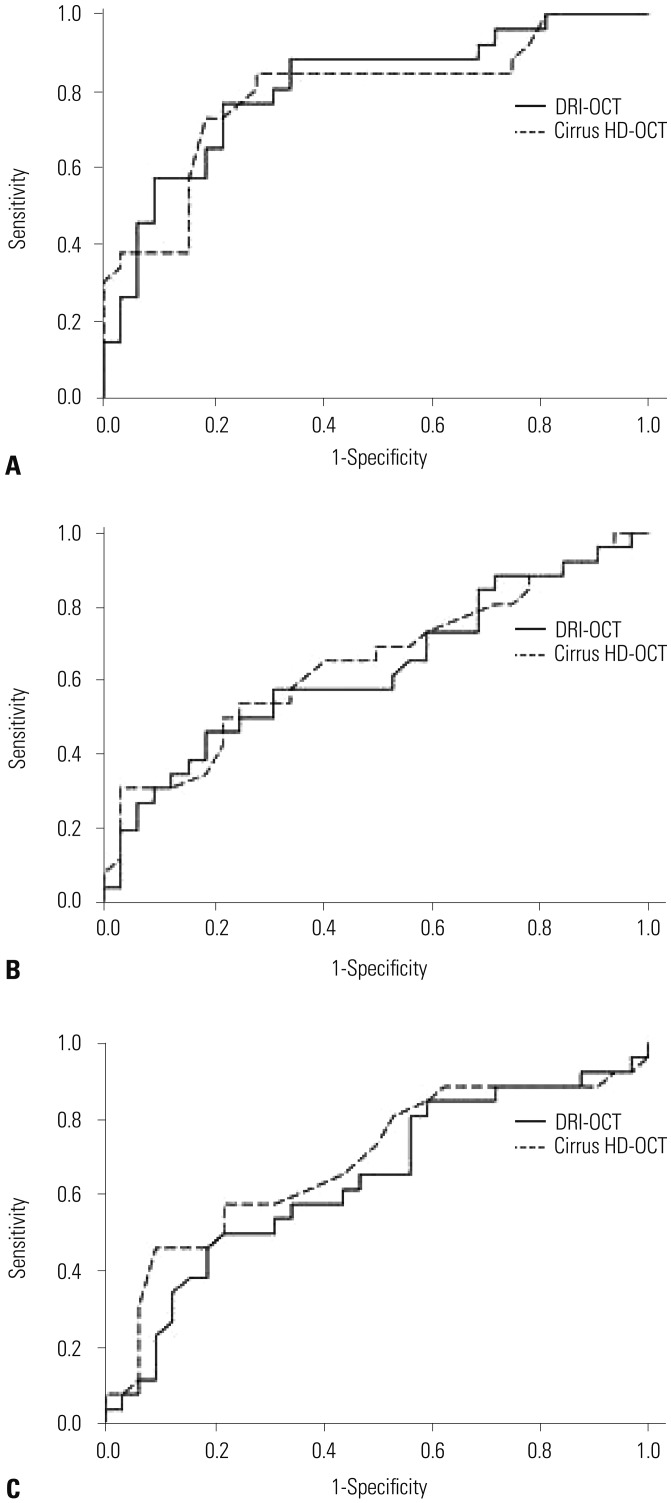 | Fig. 4Receiver operating characteristics curve of average peripapillary retinal nerve fiber layer thickness (A), macular thickness (B), and ganglion cell-inner plexiform layer thickness (C) measurements made with two optical coherence tomography (OCT) modalities (DRI-OCT and Cirrus HD-OCT) between early and moderate to severe glaucoma.
|
Table 3
Receiver Operating Characteristic Curve Comparison for Glaucoma Discrimination Ability between Control Group and Glaucoma Group
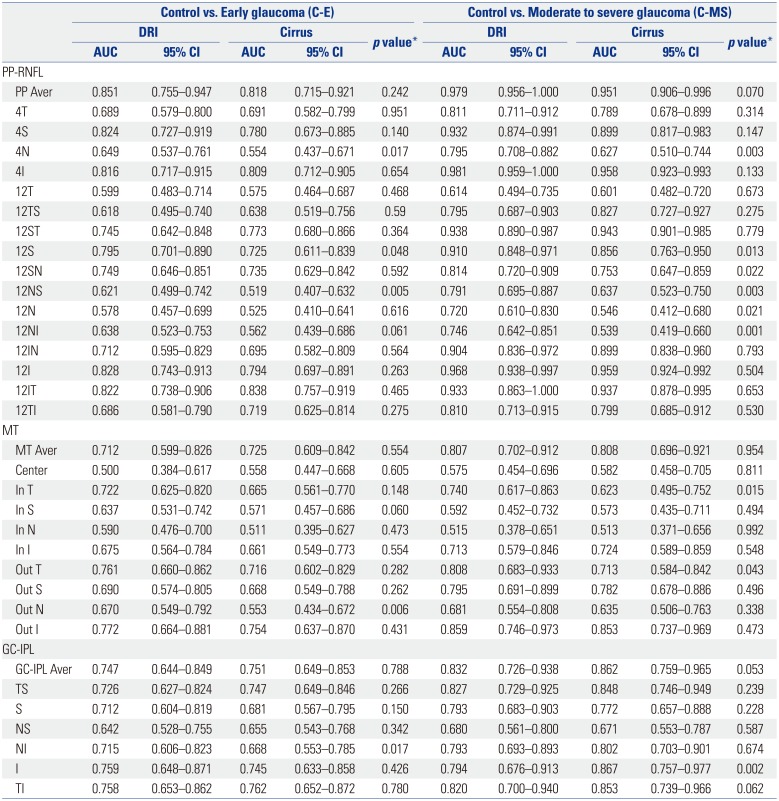
AUC, area of under the receiver operating characteristic curve; PP-RNFL, peripapillary retinal nerve fiber layer thickness; PP Aver, average PP-RNFL; MT, macular thickness; MT Aver, average MT; GC-IPL, ganglion cell-inner plexiform layer thickness; GC-IPL Aver, average GC-IPL; S, superior; N, nasal; I, inferior; T, temporal; SN, superonasal; NS, nasosuperior; N, nasoinferior; IN, inferonasal; IT, inferotemporal; TI, temporoinferior; TS, temporosuperior; ST, superotemporal; Out S, outer superior; Out N, outer nasal; Out I, outer inferior; Out T, outer temporal; In S, inner superior; In N, inner nasal; In I, inner inferior; In T, inner temporal; TS, temporosuperior; NI, nasoinferior.
*Delong method was used for statistical analyses.
![]()
Table 4
Receiver Operating Characteristic Curve Comparison for Glaucoma Discrimination Ability between Early and Moderate to Severe Glaucoma
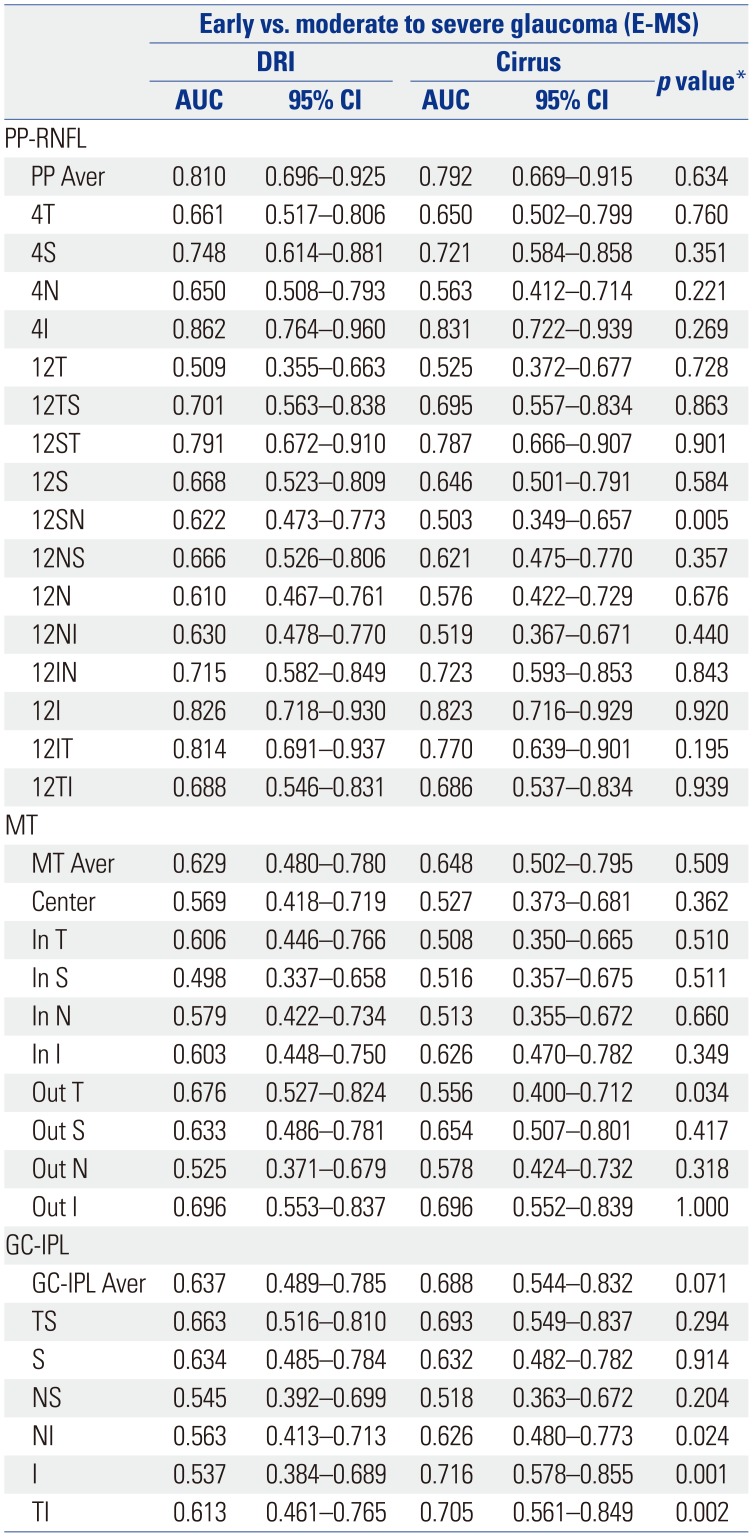
AUC, area of under the receiver operating characteristic curve; PP-RNFL, peripapillary retinal nerve fiber layer thickness; PP Aver, average PP-RNFL; MT, macular thickness; MT Aver, average MT; GC-IPL, ganglion cell-inner plexiform layer thickness; GC-IPL Aver, average GC-IPL; S, superior; N, nasal; I, inferior; T, temporal; SN, superonasal; NS, nasosuperior; N, nasoinferior; IN, inferonasal; IT, inferotemporal; TI, temporoinferior; TS, temporosuperior; ST, superotemporal; Out S, outer superior; Out N, outer nasal; Out I, outer inferior; Out T, outer temporal; In S, inner superior; In N, inner nasal; In I, inner inferior; In T, inner temporal; TS, temporosuperior; NI, nasoinferior.
*Delong method was used for statistical analyses.
![]()
 XML Download