Journal List > Yonsei Med J > v.59(7) > 1099745

Lee, Song, and Song: High-Carbohydrate Diets and Food Patterns and Their Associations with Metabolic Disease in the Korean Population

Abstract

Purpose

Although an Asian diet is typically high in carbohydrate and low in fat, there has been a steady increase in the rate of cardiometabolic disease in Asian countries over the past decade. We evaluated food patterns of a high-carbohydrate diet and examined their associations with metabolic disease.

Materials and Methods

Using data from the 2013–2015 Korean National Health and Nutrition Examination Survey, we included a total of 13106 subjects aged 20 years or older in this study. Diet was divided into seven groups according to the percentage of energy from carbohydrates. Food patterns were evaluated as individual servings per food group. Multivariate logistic regression was conducted to estimate odds ratios (OR) for metabolic disease.

Results

The proportions of men and women exceeding the recommended range of carbohydrate intake were 58.0% and 60.0%, respectively. A higher carbohydrate diet was associated with intake of low energy and saturated fats, with more grains and fruit, but less meat, fish, egg, bean (MFEB), and dairy consumption. Carbohydrate intake decreased by 3.0–3.4% per serving of MFEB and milk. In men, the highest carbohydrate group showed an OR of 1.35 [95% confidence interval (CI), 0.91 to 1.99] for metabolic syndrome, although this failed to show statistical significance. In women, the highest carbohydrate group had an OR of 1.38 (95% CI, 1.06 to 1.80) for a reduced level of high-density lipoprotein cholesterol.

Conclusion

This study suggests that a very-high-carbohydrate diet for the Korean population is attributable to lower consumption of MFEB and dairy products and is associated with several metabolic risk factors. The appropriate distribution of macronutrients for the prevention and management of metabolic disease should be explored.

INTRODUCTION

The role of dietary carbohydrate in metabolic disease has been reevaluated recently. According to Accurso, et al.,1 carbohydrate restriction improves glycemic control and reduces insulin fluctuations, which improves all of the symptoms of metabolic syndrome. A national U.S. survey reported that high carbohydrate intake was associated with an increased risk of metabolic syndrom.2 Indeed, high carbohydrate intake is associated with increased risks of metabolic syndrom in Korean adults3 and type 2 diabetes and coronary heart disease in Chinese adults.45
As dietary carbohydrate contributes more than 50% of daily energy intake, several aspects of carbohydrate nutrition, such as quality and food source, influence the risk of metabolic disease. Intake of refined grains, including rice, is associated with increased risks of metabolic disease,67 whereas intake of whole grains is associated with a reduced risk of metabolic disease in the United States8 and in other populations.91011 Dietary glycemic index, an indicator of carbohydrate quality, has also been explored in relation to metabolic disease. A meta-analysis of cohort studies reported that a higher dietary glycemic index or load was associated with increased risks of type 2 diabetes12 or other diseases.13 The beneficial effects of low-glycemic index diets are comparable to those of high intake of whole grains and fiber.14
East Asian diets are typically rice based and comprise abundant plant-based foods, particularly white rice; consumption of whole grains is relatively low, and the dietary glycemic load is relatively high. Among Americans, the recommended proportion of carbohydrates in the diet is 45–65%; the average carbohydrate intake is around 49.5% for adults aged 20–74 years according to the National Health and Nutrition Examination Survey (NHANES) 2009–2010.15 By contrast, among Koreans the recommended proportion of carbohydrate in the diet is 55–65%; the average intake is 64.1% for men and 66.8% for women.16 Therefore, more than half of the Korean population obtains more than 65% of its energy requirement from carbohydrates. Although Asian diets have considerably higher carbohydrate levels than Western diets, the term high carbohydrate diet tends to be used without definition.
As carbohydrates are the foundation of the Korean daily diet, high-carbohydrate diets should be characterized in terms of component food groups and associations with metabolic disease, which we aimed to do in the present study.

MATERIALS AND METHODS

Data source and participants

This study was based on data from the sixth (2013–2015) Korea National Health and Nutrition Examination Survey (KNHANES). The KNHANES is a cross-sectional nationwide survey conducted by the Korea Centers for Disease Control and Prevention that uses a stratified, multistage probability sampling method. This survey comprised three parts: a health-related questionnaire, clinical examinations, and nutrition surveys. A detailed description is provided elsewhere.17
Of the 22948 subjects who participated in the sixth KNHANES, we excluded those who were under 20 years of age (n=5168), and sequentially had incomplete data on 24-h recall (n=1920), had anthropometric data (n=942), reported extreme energy intake (<500 kcal/d or >5000 kcal/d; n=264), and were pregnant or breastfeeding (n=1548). A total of 13106 subjects were included in the data analyses. This study was approved by the Korea Centers for Disease Control and Prevention Institutional Review Board, and written informed consent was obtained from all participants.

Dietary intake

Dietary intake for each subject was assessed by 1-day 24-h recall. These data were collected by trained interviewers during the nutrition survey focusing on meals on weekends and weekdays. Energy intake was evaluated as total energy intake (kcal) and percentage of estimated energy requirements (EER). Intakes of macronutrient and fatty acids were assessed as proportions of energy intake. Subjects were divided into seven groups (in increments of 5%) from <55% to >80% of energy from carbohydrate.
Using 18 common food groups in the Korean nutrient database, we classified food items into the following five food groups based on the Korean Food Guidance System:18 grains (300 kcal/serving for staples or 100 kcal/serving for side dishes); meat, fish, eggs, and beans (MFEB; 100 kcal/serving); vegetables (15 kcal/serving); fruit (50 kcal/serving); and milk and dairy products (125 kcal/serving). The Korean Food Guidance System recommends specific numbers of servings for the five major food groups according to sex and age. We calculated energy intakes for the five food groups for each subject and converted them into numbers of servings by dividing by the calorie equivalent of one serving. For grains, 100 kcal was used for one serving to enable comparison with other food guidance systems. Compliance with the recommended number of servings was evaluated as the number of servings consumed divided by the recommended number of servings multiplied by 100.

Sociodemographic, health behavior, anthropometric, and biochemical variables

Sociodemographic characteristics and health behaviors were evaluated using a structured questionnaire. Education level was categorized as elementary or less, junior high school, high school, and college or more. Household income was classified into quartiles based on monthly family income, and residence was divided into urban or rural area. Alcohol drinking was evaluated by inquiring how frequently the subject had drunk in the past 12 months and how many drinks had been consumed. Any participant who responded that he or she had consumed more than one drink per month at least once during the past year was defined as a current drinker. Smoking status was determined by inquiring whether the participant had smoked more than 100 cigarettes in his or her lifetime and currently smoked daily or occasionally. Respondents who reported “yes” were categorized as current smokers. Physical activity was defined as walking at least 30 min a day more than 5 days per week.
During the KNHANES clinical examination, weight, height, waist circumference, and blood pressure were measured in a standardized fashion by trained technicians. Blood pressure was measured three times, and the mean of the latter two values was used. Body mass index (BMI) was calculated as the ratio of weight in kilograms and height in meters squared (kg/m2). Blood samples were collected from participants who had fasted for at least 8 hours to determine triglyceride (TG), high-density lipoprotein (HDL) cholesterol, glucose, and total cholesterol levels. Lipid parameters were evaluated using a Hitachi Automatic Analyzer (Hitachi, Japan). The blood collection and laboratory processing procedure has been described elsewhere.19

Definition of metabolic disease

The metabolic diseases evaluated in this study included obesity, metabolic syndrom and its components, type 2 diabetes, hypercholesterolemia, hypertriglyceridemia, and atherogenic dyslipidemia. Obesity was defined as a BMI ≥25 kg/m2 according to the World Health Organization (WHO) Western Pacific region classification. Metabolic syndrom was defined as having three or more of the following abnormalities based on the National Cholesterol Education Program Adult Treatment Panel III (NCEP-ATP III)20 with a modified waist circumference cutoff for Korean adults:21 1) abdominal adiposity (≥90 cm for men, ≥85 cm for women), 2) elevated TG level (150 mg/dL) or current use of anti-dyslipidemia medication, 3) reduced HDL cholesterol (<40 mg/dL in men, <50 mg/dL in women), 4) elevated blood pressure (systolic blood pressure ≥130 mm Hg or diastolic blood pressure ≥85 mm Hg) or current use of antihypertensive medication, or 5) elevated fasting glucose (≥100 mg/dL) or current use of anti-diabetic medication. Type 2 diabetes was defined as a fasting glucose level ≥126 mg/dL, a history of physician diagnosis, or use of oral hypoglycemic agents or insulin. Hypercholesterolemia was diagnosed as a cholesterol level ≥240 mg/dL or use of cholesterol-lowering medication, and hypertriglyceridemia was defined as a TG level ≥200 mg/dL. Atherogenic dyslipidemia was defined as a reduced HDL cholesterol level (<40 mg/dL for men, <50 mg/dL for women) and elevated TG level (≥150 mg/dL) or current use of anti-dyslipidemia medication.22

Statistical analysis

All statistical analyses were performed using SAS version 9.4 (SAS Institute Inc., Cary, NC, USA). To account for the complex sampling design, we applied appropriate sampling weights to all analyses using survey procedures in SAS. General characteristics, such as age, education, household income, residence, drinking, smoking, and walking, are expressed as frequencies and percentages, and the significance of differences between the sexes was evaluated by the chi-square test. Energy and macronutrient intakes are expressed as means with their standard errors, and the significance of differences between the sexes was evaluated by t test. Dietary variables, such as percentages of energy from macronutrients and fatty acids and consumption of food groups (number of servings and compliance with the recommended number of servings), are expressed as means and standard errors.
To investigate the associations between intake of macronutrients and consumption of the five food groups, we constructed multiple linear regression models. Beta (standardized regression coefficient) and R2 (coefficient of multiple determinations) were used as the statistical parameters. Multivariate logistic regression models were used to evaluate the overall trends in the odds ratios (ORs) and 95% confidence intervals (95% CI) for metabolic diseases according to dietary carbohydrate intake after adjustment for covariates. The covariates were age, education, household income, residence, smoking, drinking, walking, BMI (except for the model with obesity and increased waist circumference), and energy intake; covariates were controlled for in all models. Tests for linear trends for metabolic disease by carbohydrate group were conducted using the median values of carbohydrate intake in each group as a continuous variable. A p value <0.05 was considered to indicate statistical significance.

RESULTS

Characteristics of the study population

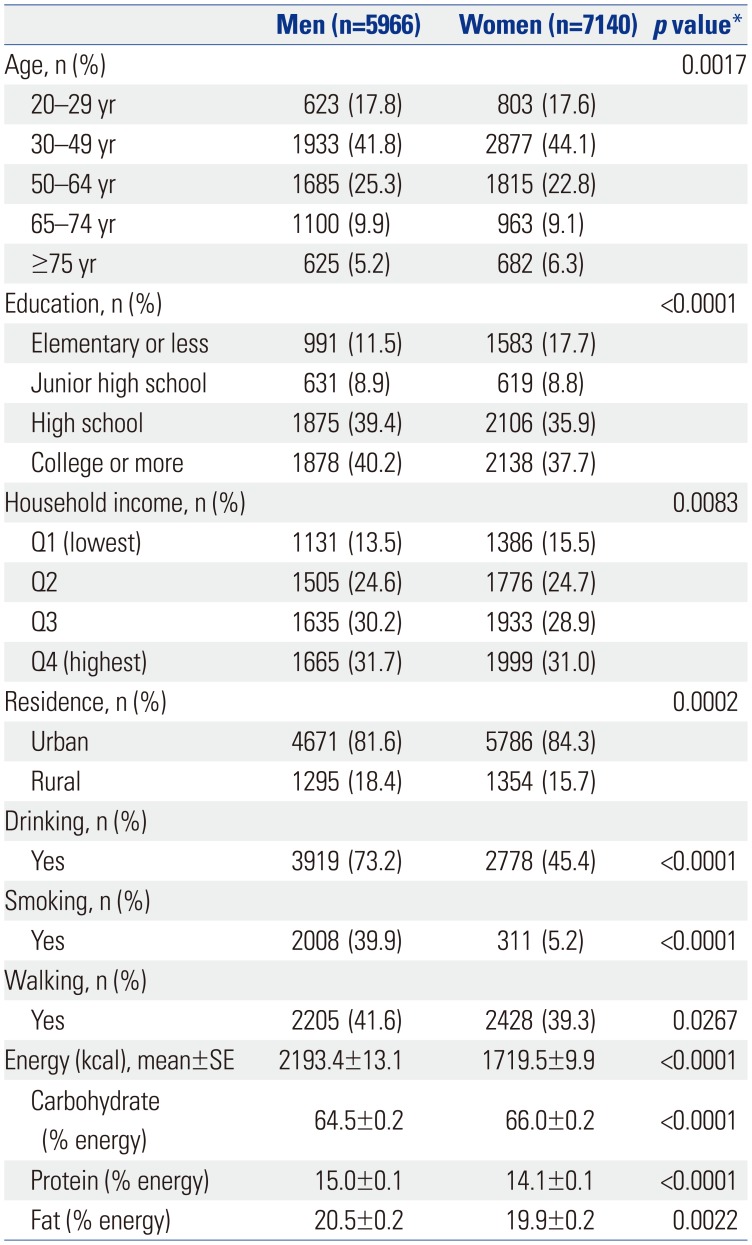
The sociodemographic characteristics, health behaviors, and macronutrient intakes of the participants are summarized in Table 1. Both men and women were more likely to be 30–49 years old and live in an urban area. Men were more likely than women to have a higher education level and to walk. Women were less likely than men to be current drinkers and smokers. Men also had higher intakes of energy and macronutrients than women, with the exception of carbohydrates.

Distribution of dietary carbohydrate intake by sex

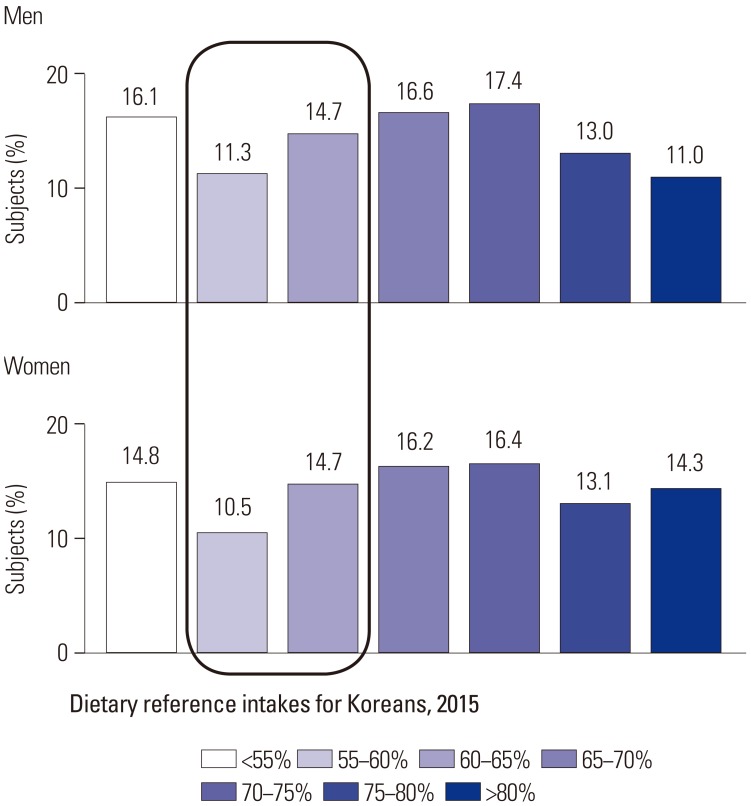
The distribution of subjects according to dietary carbohydrate intake by sex is presented in Fig. 1.
Of the groups categorized according to the proportion of energy from carbohydrate intake, the 70–75% group was most frequent among both men and women. The proportions of energy from carbohydrates of 26.0% for men and 25.2% for women were in the recommended range, whereas 58.0% of men and 60.0% of women exceeded the recommended proportion of energy from carbohydrates (65%). As age group is an important factor, the distribution of dietary carbohydrate intake according to age group by sex is presented in Supplementary Fig. 1 (only online). The proportion of subjects who consumed <55% of energy from carbohydrate intake was highest in 20–29 year group, while those who consumed >80% were highest in the 75 years or more group for both men and women.

Energy, macronutrient, and fatty acid intake by carbohydrate intake

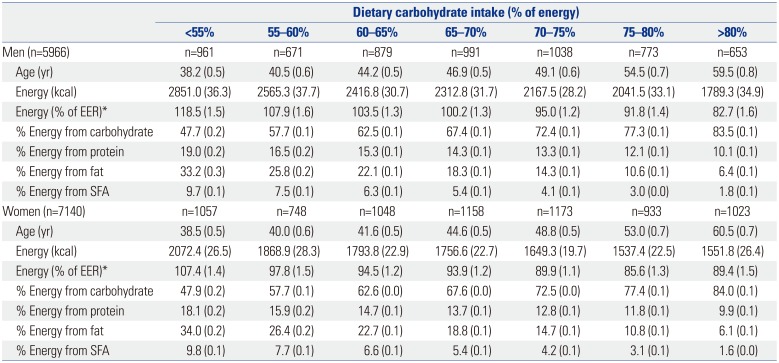
Energy and macronutrient intakes are presented in Table 2. Energy intake decreased across the carbohydrate groups. When we evaluated energy intake using age, sex-specific EER, the lowest carbohydrate group (<55% group) showed 118.5% in men and 107.4% in women, whereas the highest carbohydrate group (>80% group) showed 82.7% in men and 89.4% in women. In the case of the 70–75% carbohydrate group, which was the most prevalent in this population, %EER was 95.0% in men and 89.9% in women, and the percentage of energy from fat was 14.3% in men and 14.7% in women. Fat intake decreased across the carbohydrate groups in the same pattern as energy intake. Whereas saturated fat intake was 9.7% in men and 9.8% in women in the lowest carbohydrate group (<55% group), it was 1.8% in men and 1.6% in women in the highest carbohydrate group (>80% group).

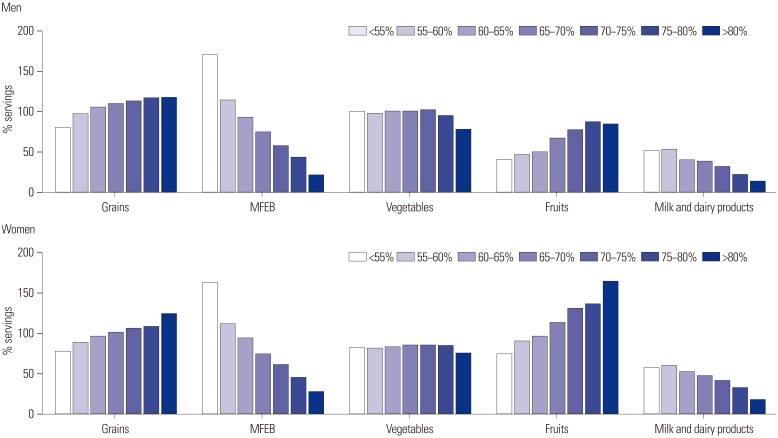
Food group consumption according to carbohydrate intake

Food group consumption as a percentage of the recommended serving is presented in Fig. 2. For men, food group consumption ranged from 79% to 117% of the recommendation for grains and from 77% to 102% for vegetables. However, consumption of MFEB was 170% of the recommendation in the lowest carbohydrate group (<55%), compared to 21% in the highest carbohydrate group (>80%). Milk consumption was low in all groups: 51% in the lowest group (<55%) and only 13% in the highest group (>80%). Women showed a similar pattern, with the exception of fruit consumption. Fruit consumption was 74% of the recommended serving in the lowest carbohydrate group (<55%), but 164% in the highest carbohydrate group (>80%).

Relation of food group consumption to carbohydrate intake

The results of multiple linear regression analyses with the carbohydrate intake as the dependent variable and consumption of the five food groups as independent variables are shown in Table 3. The estimated regression coefficients indicate the influence on carbohydrate intake of a single serving size increase in food group consumption. Decreases in carbohydrate intake were 2.5- and 2.1-fold greater for an increase in servings of MFEB, compared to decreasing one serving of grain intake, in men and women, respectively.

Associations between dietary carbohydrate intake and metabolic disease

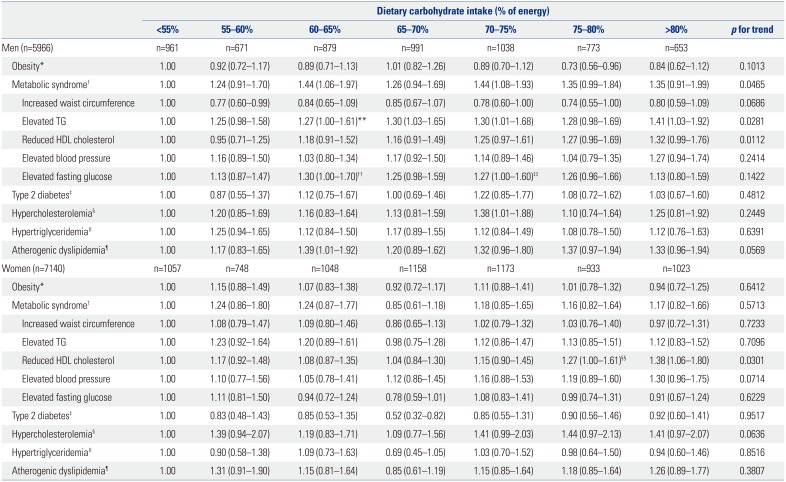
The associations between dietary carbohydrate intake and metabolic diseases are shown in Table 4. Men in the highest carbohydrate group showed an OR of 1.35 (95% CI, 0.91 to 1.99) for metabolic syndrom, which failed to obtain statistical significance. Of the components of metabolic syndrom, men in the highest carbohydrate group (>80%) showed an OR of 1.41 (95% CI, 1.03 to 1.92) for elevated TG level, compared to those in the lowest carbohydrate group (<55%). Among women, the highest carbohydrate group had an OR of 1.38 (95% CI, 1.06 to 1.80) for a reduced HDL cholesterol, compared to the reference group. Men in the 70–75% carbohydrate group had several risk factors, such as metabolic syndrom, elevated TG, elevated fasting glucose, and hypercholesterolemia, whereas waist circumference showed a beneficial effect, compared to the reference group, who consumed a low-carbohydrate diet.

DISCUSSION

Our findings demonstrated that Korean adults consume a very-high-carbohydrate diet and that a higher carbohydrate intake is associated with intake of low energy and saturated fat and little consumption of MFEB and milk. Moreover, very-high-carbohydrate diets comprising more than 80% of energy intake were significantly associated with increased risks of elevated TG level in men and an increased risk of a reduced HDL cholesterol level in women.
A typical Korean diet is based on white rice with plenty of plant-based foods (i.e., a high-carbohydrate and low-fat diet). As white rice is a core food, its contribution to total grains is considerable, despite an overall decrease in the consumption of white rice in Korea over the past decade. In this study, in the highest carbohydrate group (>80%), white rice represented about 65% of grain consumption among both men and women (Supplementary Fig. 2, only online). This high dependence on white rice results in a very-low-fat diet with low consumption of whole grains. Approximately 60% of subjects in a Korean national survey had no whole grain consumption on the survey day, and the proportion of whole grains among total grains was as low as 5%.23
According to an American Heart Association (AHA) science advisory,24 a very-low-fat diet, defined as 15% or less of energy from fat, resulted in a significantly increased TG level and decreased HDL cholesterol level irrespective of any weight change.252627 Furthermore, a systematic review showed that a low-fat diet, defined as less than 30% of energy from fat, had adverse effects on TG levels in the long term, despite a favorable impact on total and LDL cholesterol levels.28 This finding is consistent with studies in Asian populations, including this work. A study in a Chinese population reported that high carbohydrate intake from starchy foods was positively associated with high TG and low HDL cholesterol levels.29 A study in a Japanese population reported that a high glycemic load was positively correlated with elevated fasting TG and reduced HDL cholesterol levels.30 A recent study of Koreans reported that adults who consumed a very-low-fat diet, defined as less than 15% of energy intake, had an increased risk of metabolic syndrom:31 The nutrient adequacy of a very-low-fat diet may vary depending on the food intake pattern; intake of adequate protein and complex carbohydrate is required.24 MFEB is the primary protein-containing foods, and a recent meta-analysis study showed that soy protein supplementation reduced cardiometabolic markers.32
Although meat consumption has increased in Asian countries in the past decade, it is still substantially lower in Asian countries than in the United States.33 Red meat consumption is linked to an increased risk of mortality in Western populations.3435 However, a pooled analysis of prospective cohort studies in Asian populations reported that red meat and poultry consumption were inversely associated with mortality in both men and women.33 Japanese cohort studies reported that the intake of animal products had a protective effect on intracerebral hemorrhage36 and cerebral infraction,37 and an observational study in Japan found no association between an animal food dietary pattern and an abnormality in glucose tolerance.38 In a Chinese cohort, poultry intake was inversely associated with all cardiovascular disease mortality in men,39 and total meat and fish intake was not associated with a risk of colorectal cancer.40 A semi-Western diet, which is characterized by relatively high intakes of meat, poultry, eggs, and alcohol, was associated with a low risk of HDL cholesterol in KNHANES 2007–2008.41 This phenomenon is likely due to the inadequate meat intake typical of Asian populations. The effect of reducing carbohydrate intake is more than two-fold in increasing one serving of MFEB rather than decreasing one serving of grain. Therefore, MFEB consumption should be the focus of efforts to reduce dietary carbohydrate levels.
In this study, we found a positive association of dietary carbohydrate with metabolic disease. As our data was based on the prevalence of metabolic disease, further studies are necessary to confirm our findings in a longitudinal study. A recent study for Korean adults reported that carbohydrate composition, in the range of 67–70%, showed significantly reduced OR for metabolic syndrome incidence.42 However, they did not stratify the association by sex with a short duration of 2 years and different dietary assessment that makes it difficult to compare with our results. Further studies are still necessary for Koreans to elucidate the role of dietary carbohydrate in the progression of metabolic disease.
Our study has several limitations. The data were from a cross-sectional study, which precludes identification of causal relationships between carbohydrate intake groups and metabolic diseases. In addition, a single 24-h recall is not representative of typical food intake. However, we calculated the servings of each food group based on a food guidance system because there was no serving database for individual foods, which may have resulted in error. Also, we included subjects who had diagnosed or treated metabolic disease, which might affect the findings in this study. However, when we examined the relationship of carbohydrate intake with food groups or metabolic risk factors excluding those subjects, there were similar trends with the same significance, although it was attenuated. Lastly, we cannot say that the model to predict dietary carbohydrate with major five food group consumption fit very well. However, this is the first study to provide evidence on how to reduce dietary carbohydrate in practical ways in relation to food groups and portions thereof. Further studies to confirm our results would be necessary. Despite these limitations, this study would contribute to understanding food patterns of high-carbohydrate diets quantitatively.
In conclusion, the very-high-carbohydrate diet typical of the Korean population is attributable to lower consumption of MFEB and dairy products and is associated with several metabolic risk factors. The optimum macronutrient intakes and appropriate food patterns for each country should be explored to enhance the prevention and management of metabolic diseases.

ACKNOWLEDGEMENTS

This study was supported by the Basic Science Research Program of the National Research Foundation of Korea (NRF-2017R1A2B1008420) and by the Research Fund, 2018 of The Catholic University of Korea.

Notes

The authors have no financial conflicts of interest.

References

1. Accurso A, Bernstein RK, Dahlqvist A, Draznin B, Feinman RD, Fine EJ, et al. Dietary carbohydrate restriction in type 2 diabetes mellitus and metabolic syndrome: time for a critical appraisal. Nutr Metab (Lond). 2008; 5:9. PMID: 18397522.
crossref
2. Park YW, Zhu S, Palaniappan L, Heshka S, Carnethon MR, Heymsfield SB. The metabolic syndrome: prevalence and associated risk factor findings in the US population from the Third National Health and Nutrition Examination Survey, 1988–1994. Arch Intern Med. 2003; 163:427–436. PMID: 12588201.
3. Song S, Lee JE, Song WO, Paik HY, Song Y. Carbohydrate intake and refined-grain consumption are associated with metabolic syndrome in the Korean adult population. J Acad Nutr Diet. 2014; 114:54–62. PMID: 24200655.
crossref
4. Villegas R, Liu S, Gao YT, Yang G, Li H, Zheng W, et al. Prospective study of dietary carbohydrates, glycemic index, glycemic load, and incidence of type 2 diabetes mellitus in middle-aged Chinese women. Arch Intern Med. 2007; 167:2310–2316. PMID: 18039989.
crossref
5. Yu D, Shu XO, Li H, Xiang YB, Yang G, Gao YT, et al. Dietary carbohydrates, refined grains, glycemic load, and risk of coronary heart disease in Chinese adults. Am J Epidemiol. 2013; 178:1542–1549. PMID: 24008907.
crossref
6. Radhika G, Van Dam RM, Sudha V, Ganesan A, Mohan V. Refined grain consumption and the metabolic syndrome in urban Asian Indians (Chennai Urban Rural Epidemiology Study 57). Metabolism. 2009; 58:675–681. PMID: 19375591.
crossref
7. Sahyoun NR, Jacques PF, Zhang XL, Juan W, McKeown NM. Whole-grain intake is inversely associated with the metabolic syndrome and mortality in older adults. Am J Clin Nutr. 2006; 83:124–131. PMID: 16400060.
crossref
8. McKeown NM, Meigs JB, Liu S, Saltzman E, Wilson PW, Jacques PF. Carbohydrate nutrition, insulin resistance, and the prevalence of the metabolic syndrome in the Framingham Offspring Cohort. Diabetes Care. 2004; 27:538–546. PMID: 14747241.
crossref
9. Esmaillzadeh A, Mirmiran P, Azizi F. Whole-grain consumption and the metabolic syndrome: a favorable association in Tehranian adults. Eur J Clin Nutr. 2005; 59:353–362. PMID: 15536473.
crossref
10. Mellen PB, Walsh TF, Herrington DM. Whole grain intake and cardiovascular disease: a meta-analysis. Nutr Metab Cardiovasc Dis. 2008; 18:283–290. PMID: 17449231.
crossref
11. Ye EQ, Chacko SA, Chou EL, Kugizaki M, Liu S. Greater whole-grain intake is associated with lower risk of type 2 diabetes, cardiovascular disease, and weight gain. J Nutr. 2012; 142:1304–1313. PMID: 22649266.
crossref
12. Greenwood DC, Threapleton DE, Evans CE, Cleghorn CL, Nykjaer C, Woodhead C, et al. Glycemic index, glycemic load, carbohydrates, and type 2 diabetes: systematic review and dose-response meta-analysis of prospective studies. Diabetes Care. 2013; 36:4166–4171. PMID: 24265366.
13. Dong JY, Zhang YH, Wang P, Qin LQ. Meta-analysis of dietary glycemic load and glycemic index in relation to risk of coronary heart disease. Am J Cardiol. 2012; 109:1608–1613. PMID: 22440121.
crossref
14. Barclay AW, Petocz P, McMillan-Price J, Flood VM, Prvan T, Mitchell P, et al. Glycemic index, glycemic load, and chronic disease risk--a meta-analysis of observational studies. Am J Clin Nutr. 2008; 87:627–637. PMID: 18326601.
crossref
15. Ford ES, Dietz WH. Trends in energy intake among adults in the United States: findings from NHANES. Am J Clin Nutr. 2013; 97:848–853. PMID: 23426032.
16. Yun S, Kim HJ, Oh K. Trends in energy intake among Korean adults, 1998–2015: results from the Korea National Health and Nutrition Examination Survey. Nutr Res Pract. 2017; 11:147–154. PMID: 28386388.
crossref
17. Kweon S, Kim Y, Jang MJ, Kim Y, Kim K, Choi S, et al. Data resource profile: the Korea National Health and Nutrition Examination Survey (KNHANES). Int J Epidemiol. 2014; 43:69–77. PMID: 24585853.
crossref
18. Korean Ministry of Health and Welfare. Dietary reference intakes for Koreans 2015. Sejong: Korean Ministry of Health and Welfare;2015.
19. Korea Centers for Disease Control and Prevention. Manual for the fifth Korea National Health and Nutrition Examination Survey: health examination. Osong: Korea Centers for Disease Control and Prevention;2012.
20. Grundy SM, Cleeman JI, Daniels SR, Donato KA, Eckel RH, Franklin BA, et al. Diagnosis and management of the metabolic syndrome: an American Heart Association/National Heart, Lung, and Blood Institute Scientific Statement. Circulation. 2005; 112:2735–2752. PMID: 16157765.
21. Lee SY, Park HS, Kim DJ, Han JH, Kim SM, Cho GJ, et al. Appropriate waist circumference cutoff points for central obesity in Korean adults. Diabetes Res Clin Pract. 2007; 75:72–80. PMID: 16735075.
crossref
22. Bosomworth NJ. Approach to identifying and managing atherogenic dyslipidemia: a metabolic consequence of obesity and diabetes. Can Fam Physician. 2013; 59:1169–1180. PMID: 24235189.
23. Lee S. Association of whole grain consumption with socio-demographic and eating behavior factors in a Korean population: based on 2007–2008 Korea National Health and Nutrition Examination Survey. Korean J Community Nutr. 2011; 16:353–363.
crossref
24. Lichtenstein AH, Van Horn L. Very low fat diets. Circulation. 1998; 98:935–939. PMID: 9738652.
crossref
25. Schaefer EJ, Lichtenstein AH, Lamon-Fava S, McNamara JR, Schaefer MM, Rasmussen H, et al. Body weight and low-density lipoprotein cholesterol changes after consumption of a low-fat ad libitum diet. JAMA. 1995; 274:1450–1455. PMID: 7474191.
crossref
26. Lichtenstein AH, Ausman LM, Carrasco W, Jenner JL, Ordovas JM, Schaefer EJ. Short-term consumption of a low-fat diet beneficially affects plasma lipid concentrations only when accompanied by weight loss. Hypercholesterolemia, low-fat diet, and plasma lipids. Arterioscler Thromb. 1994; 14:1751–1760. PMID: 7947600.
crossref
27. Clevidence BA, Judd JT, Schatzkin A, Muesing RA, Campbell WS, Brown CC, et al. Plasma lipid and lipoprotein concentrations of men consuming a low-fat, high-fiber diet. Am J Clin Nutr. 1992; 55:689–694. PMID: 1312762.
crossref
28. Schwingshackl L, Hoffmann G. Comparison of long-term low-fat versus high-fat diets on blood lipids: a systematic review and meta-analysis. Proc Nutr Soc. 2012; 71:E220.
crossref
29. Feng R, Du S, Chen Y, Zheng S, Zhang W, Na G, et al. High carbohydrate intake from starchy foods is positively associated with metabolic disorders: a Cohort Study from a Chinese population. Sci Rep. 2015; 5:16919. PMID: 26581652.
crossref
30. Murakami K, Sasaki S, Takahashi Y, Okubo H, Hosoi Y, Horiguchi H, et al. Dietary glycemic index and load in relation to metabolic risk factors in Japanese female farmers with traditional dietary habits. Am J Clin Nutr. 2006; 83:1161–1169. PMID: 16685061.
crossref
31. Park S, Ahn J, Lee BK. Very-low-fat diets may be associated with increased risk of metabolic syndrome in the adult population. Clin Nutr. 2016; 35:1159–1167. PMID: 26602244.
crossref
32. Zhang XM, Zhang YB, Chi MH. Soy protein supplementation reduces clinical indices in type 2 diabetes and metabolic syndrome. Yonsei Med J. 2016; 57:681–689. PMID: 26996569.
crossref
33. Lee JE, McLerran DF, Rolland B, Chen Y, Grant EJ, Vedanthan R, et al. Meat intake and cause-specific mortality: a pooled analysis of Asian prospective cohort studies. Am J Clin Nutr. 2013; 98:1032–1041. PMID: 23902788.
crossref
34. Pan A, Sun Q, Bernstein AM, Schulze MB, Manson JE, Stampfer MJ, et al. Red meat consumption and mortality: results from 2 prospective cohort studies. Arch Intern Med. 2012; 172:555–563. PMID: 22412075.
35. Larsson SC, Orsini N. Red meat and processed meat consumption and all-cause mortality: a meta-analysis. Am J Epidemiol. 2014; 179:282–289. PMID: 24148709.
crossref
36. Sauvaget C, Nagano J, Allen N, Grant EJ, Beral V. Intake of animal products and stroke mortality in the Hiroshima/Nagasaki Life Span Study. Int J Epidemiol. 2003; 32:536–543. PMID: 12913025.
crossref
37. Sauvaget C, Nagano J, Hayashi M, Yamada M. Animal protein, animal fat, and cholesterol intakes and risk of cerebral infarction mortality in the adult health study. Stroke. 2004; 35:1531–1537. PMID: 15166397.
crossref
38. Mizoue T, Yamaji T, Tabata S, Yamaguchi K, Ogawa S, Mineshita M, et al. Dietary patterns and glucose tolerance abnormalities in Japanese men. J Nutr. 2006; 136:1352–1358. PMID: 16614429.
crossref
39. Takata Y, Shu XO, Gao YT, Li H, Zhang X, Gao J, et al. Red meat and poultry intakes and risk of total and cause-specific mortality: results from cohort studies of Chinese adults in Shanghai. PLoS One. 2013; 8:e56963. PMID: 23451121.
crossref
40. Lee SA, Shu XO, Yang G, Li H, Gao YT, Zheng W. Animal origin foods and colorectal cancer risk: a report from the Shanghai Women's Health Study. Nutr Cancer. 2009; 61:194–205. PMID: 19235035.
crossref
41. Oh HY, Kim MK, Lee M, Kim YO. Macronutrient composition and sodium intake of diet are associated with risk of metabolic syndrome and hypertension in Korean women. PLoS One. 2013; 8:e78088. PMID: 24205105.
crossref
42. Cho NH, Cho AK, Kim HK, Kim JB, Lee KE, Kim SS, et al. Carbohydrate composition associated with the 2-year incidence of metabolic syndrome in Korean adults. Clin Nutr Res. 2017; 6:122–129. PMID: 28503508.
crossref

SUPPLEMENTARY MATERIALS

Supplementary Fig. 1

Distribution of dietary carbohydrate intake according to age group by sex.
ymj-59-834-s001.pdf

Supplementary Fig. 2

Contribution of white rice to total grain intake according to dietary carbohydrate intake by sex.
ymj-59-834-s002.pdf
Fig. 1

Distribution of dietary carbohydrate intake according to sex.

ymj-59-834-g001
Fig. 2

Food group consumption (percentage of recommended servings) according to dietary carbohydrate intake based on the Korean Food Guidance System. % servings=the number of servings consumed/the recommended number of servings×100. MFEB, meat, fish, eggs, and beans.

ymj-59-834-g002
Table 1

Characteristics of Participants according to Sex

ymj-59-834-i001
Men (n=5966) Women (n=7140) p value*
Age, n (%) 0.0017
 20–29 yr 623 (17.8) 803 (17.6)
 30–49 yr 1933 (41.8) 2877 (44.1)
 50–64 yr 1685 (25.3) 1815 (22.8)
 65–74 yr 1100 (9.9) 963 (9.1)
 ≥75 yr 625 (5.2) 682 (6.3)
Education, n (%) <0.0001
 Elementary or less 991 (11.5) 1583 (17.7)
 Junior high school 631 (8.9) 619 (8.8)
 High school 1875 (39.4) 2106 (35.9)
 College or more 1878 (40.2) 2138 (37.7)
Household income, n (%) 0.0083
 Q1 (lowest) 1131 (13.5) 1386 (15.5)
 Q2 1505 (24.6) 1776 (24.7)
 Q3 1635 (30.2) 1933 (28.9)
 Q4 (highest) 1665 (31.7) 1999 (31.0)
Residence, n (%) 0.0002
 Urban 4671 (81.6) 5786 (84.3)
 Rural 1295 (18.4) 1354 (15.7)
Drinking, n (%)
 Yes 3919 (73.2) 2778 (45.4) <0.0001
Smoking, n (%)
 Yes 2008 (39.9) 311 (5.2) <0.0001
Walking, n (%)
 Yes 2205 (41.6) 2428 (39.3) 0.0267
Energy (kcal), mean±SE 2193.4±13.1 1719.5±9.9 <0.0001
 Carbohydrate (% energy) 64.5±0.2 66.0±0.2 <0.0001
 Protein (% energy) 15.0±0.1 14.1±0.1 <0.0001
 Fat (% energy) 20.5±0.2 19.9±0.2 0.0022

SE, standard error.

All analyses accounted for the complex sampling design effect and appropriate sampling weights of the national survey using PROC SURVEY in SAS.

*p values were determined by t test for continuous variables and the chi-square test for categorical variables.

Table 2

Energy, Macronutrient, and Fatty Acid Intake according to Dietary Carbohydrate Intake by Sex

ymj-59-834-i002
Dietary carbohydrate intake (% of energy)
<55% 55–60% 60–65% 65–70% 70–75% 75–80% >80%
Men (n=5966) n=961 n=671 n=879 n=991 n=1038 n=773 n=653
 Age (yr) 38.2 (0.5) 40.5 (0.6) 44.2 (0.5) 46.9 (0.5) 49.1 (0.6) 54.5 (0.7) 59.5 (0.8)
 Energy (kcal) 2851.0 (36.3) 2565.3 (37.7) 2416.8 (30.7) 2312.8 (31.7) 2167.5 (28.2) 2041.5 (33.1) 1789.3 (34.9)
 Energy (% of EER)* 118.5 (1.5) 107.9 (1.6) 103.5 (1.3) 100.2 (1.3) 95.0 (1.2) 91.8 (1.4) 82.7 (1.6)
 % Energy from carbohydrate 47.7 (0.2) 57.7 (0.1) 62.5 (0.1) 67.4 (0.1) 72.4 (0.1) 77.3 (0.1) 83.5 (0.1)
 % Energy from protein 19.0 (0.2) 16.5 (0.2) 15.3 (0.1) 14.3 (0.1) 13.3 (0.1) 12.1 (0.1) 10.1 (0.1)
 % Energy from fat 33.2 (0.3) 25.8 (0.2) 22.1 (0.1) 18.3 (0.1) 14.3 (0.1) 10.6 (0.1) 6.4 (0.1)
 % Energy from SFA 9.7 (0.1) 7.5 (0.1) 6.3 (0.1) 5.4 (0.1) 4.1 (0.1) 3.0 (0.0) 1.8 (0.1)
Women (n=7140) n=1057 n=748 n=1048 n=1158 n=1173 n=933 n=1023
 Age (yr) 38.5 (0.5) 40.0 (0.6) 41.6 (0.5) 44.6 (0.5) 48.8 (0.5) 53.0 (0.7) 60.5 (0.7)
 Energy (kcal) 2072.4 (26.5) 1868.9 (28.3) 1793.8 (22.9) 1756.6 (22.7) 1649.3 (19.7) 1537.4 (22.5) 1551.8 (26.4)
 Energy (% of EER)* 107.4 (1.4) 97.8 (1.5) 94.5 (1.2) 93.9 (1.2) 89.9 (1.1) 85.6 (1.3) 89.4 (1.5)
 % Energy from carbohydrate 47.9 (0.2) 57.7 (0.1) 62.6 (0.0) 67.6 (0.0) 72.5 (0.0) 77.4 (0.1) 84.0 (0.1)
 % Energy from protein 18.1 (0.2) 15.9 (0.2) 14.7 (0.1) 13.7 (0.1) 12.8 (0.1) 11.8 (0.1) 9.9 (0.1)
 % Energy from fat 34.0 (0.2) 26.4 (0.2) 22.7 (0.1) 18.8 (0.1) 14.7 (0.1) 10.8 (0.1) 6.1 (0.1)
 % Energy from SFA 9.8 (0.1) 7.7 (0.1) 6.6 (0.1) 5.4 (0.1) 4.2 (0.1) 3.1 (0.1) 1.6 (0.0)

SFA, saturated fatty acid; EER, estimated energy requirement.

All analyses accounted for the complex sampling design effect and appropriate sampling weights of the national survey using PROC SURVEY in SAS. Values are means (standard errors).

*Energy intake was evaluated as the percentage of age, sex-specific EER.

Table 3

Multiple Linear Regression Results for Carbohydrate Intake with Consumption of the Five Food Groups according to Sex

ymj-59-834-i003
Food group Dietary carbohydrate intake (% of energy)
Men (n=5966) Women (n=7140)
β SE p value β SE p value
Serving
 Grain 0.7146 0.0387 <0.0001 1.0565 0.0679 <0.0001
 MFEB −1.7502 0.0664 <0.0001 −2.1239 0.1006 <0.0001
 Vegetables 0.1397 0.0229 <0.0001 0.1369 0.0260 0.0010
 Fruit 0.6625 0.0444 <0.0001 0.9126 0.0424 <0.0001
 Milk and dairy products −1.1973 0.1505 <0.0001 −1.2554 0.1647 <0.0001
Model adj R2=0.6622, p<0.0001 adj R2=0.6448, p<0.0001

MFEB, meat, fish, eggs, and beans; SE, standard error.

Grain, one serving=100 kcal; MFEB, one serving=100 kcal; vegetables, one serving=15 kcal; fruit, one serving=50 kcal; milk and dairy products, one serving=125 kcal.

All analyses accounted for the complex sampling design effect and appropriate sampling weights of the national survey using PROC SURVEY in SAS. Linear regression model was used to predict dietary carbohydrate intake with five major food groups consumption after adjusted for age, education, household income, energy intake. β, standardized regression coefficient; adj R2, adjusted coefficient of multiple determinations.

Table 4

Multivariable-Adjusted ORs and 95% CIs for Metabolic Diseases according to Dietary Carbohydrate Intake by Sex

ymj-59-834-i004
Dietary carbohydrate intake (% of energy)
<55% 55–60% 60–65% 65–70% 70–75% 75–80% >80% p for trend
Men (n=5966) n=961 n=671 n=879 n=991 n=1038 n=773 n=653
 Obesity* 1.00 0.92 (0.72–1.17) 0.89 (0.71–1.13) 1.01 (0.82–1.26) 0.89 (0.70–1.12) 0.73 (0.56–0.96) 0.84 (0.62–1.12) 0.1013
 Metabolic syndrome 1.00 1.24 (0.91–1.70) 1.44 (1.06–1.97) 1.26 (0.94–1.69) 1.44 (1.08–1.93) 1.35 (0.99–1.84) 1.35 (0.91–1.99) 0.0465
  Increased waist circumference 1.00 0.77 (0.60–0.99) 0.84 (0.65–1.09) 0.85 (0.67–1.07) 0.78 (0.60–1.00) 0.74 (0.55–1.00) 0.80 (0.59–1.09) 0.0686
  Elevated TG 1.00 1.25 (0.98–1.58) 1.27 (1.00–1.61)** 1.30 (1.03–1.65) 1.30 (1.01–1.68) 1.28 (0.98–1.69) 1.41 (1.03–1.92) 0.0281
  Reduced HDL cholesterol 1.00 0.95 (0.71–1.25) 1.18 (0.91–1.52) 1.16 (0.91–1.49) 1.25 (0.97–1.61) 1.27 (0.96–1.69) 1.32 (0.99–1.76) 0.0112
  Elevated blood pressure 1.00 1.16 (0.89–1.50) 1.03 (0.80–1.34) 1.17 (0.92–1.50) 1.14 (0.89–1.46) 1.04 (0.79–1.35) 1.27 (0.94–1.74) 0.2414
  Elevated fasting glucose 1.00 1.13 (0.87–1.47) 1.30 (1.00–1.70)†† 1.25 (0.98–1.59) 1.27 (1.00–1.60)‡‡ 1.26 (0.96–1.66) 1.13 (0.80–1.59) 0.1422
 Type 2 diabetes 1.00 0.87 (0.55–1.37) 1.12 (0.75–1.67) 1.00 (0.69–1.46) 1.22 (0.85–1.77) 1.08 (0.72–1.62) 1.03 (0.67–1.60) 0.4812
 Hypercholesterolemia§ 1.00 1.20 (0.85–1.69) 1.16 (0.83–1.64) 1.13 (0.81–1.59) 1.38 (1.01–1.88) 1.10 (0.74–1.64) 1.25 (0.81–1.92) 0.2449
 Hypertriglyceridemia 1.00 1.25 (0.94–1.65) 1.12 (0.84–1.50) 1.17 (0.89–1.55) 1.12 (0.84–1.49) 1.08 (0.78–1.50) 1.12 (0.76–1.63) 0.6391
 Atherogenic dyslipidemia 1.00 1.17 (0.83–1.65) 1.39 (1.01–1.92) 1.20 (0.89–1.62) 1.32 (0.96–1.80) 1.37 (0.97–1.94) 1.33 (0.96–1.94) 0.0569
Women (n=7140) n=1057 n=748 n=1048 n=1158 n=1173 n=933 n=1023
Obesity* 1.00 1.15 (0.88–1.49) 1.07 (0.83–1.38) 0.92 (0.72–1.17) 1.11 (0.88–1.41) 1.01 (0.78–1.32) 0.94 (0.72–1.25) 0.6412
 Metabolic syndrome 1.00 1.24 (0.86–1.80) 1.24 (0.87–1.77) 0.85 (0.61–1.18) 1.18 (0.85–1.65) 1.16 (0.82–1.64) 1.17 (0.82–1.66) 0.5713
  Increased waist circumference 1.00 1.08 (0.79–1.47) 1.09 (0.80–1.46) 0.86 (0.65–1.13) 1.02 (0.79–1.32) 1.03 (0.76–1.40) 0.97 (0.72–1.31) 0.7233
  Elevated TG 1.00 1.23 (0.92–1.64) 1.20 (0.89–1.61) 0.98 (0.75–1.28) 1.12 (0.86–1.47) 1.13 (0.85–1.51) 1.12 (0.83–1.52) 0.7096
  Reduced HDL cholesterol 1.00 1.17 (0.92–1.48) 1.08 (0.87–1.35) 1.04 (0.84–1.30) 1.15 (0.90–1.45) 1.27 (1.00–1.61)§§ 1.38 (1.06–1.80) 0.0301
  Elevated blood pressure 1.00 1.10 (0.77–1.56) 1.05 (0.78–1.41) 1.12 (0.86–1.45) 1.16 (0.88–1.53) 1.19 (0.89–1.60) 1.30 (0.96–1.75) 0.0714
  Elevated fasting glucose 1.00 1.11 (0.81–1.50) 0.94 (0.72–1.24) 0.78 (0.59–1.01) 1.08 (0.83–1.41) 0.99 (0.74–1.31) 0.91 (0.67–1.24) 0.6229
 Type 2 diabetes 1.00 0.83 (0.48–1.43) 0.85 (0.53–1.35) 0.52 (0.32–0.82) 0.85 (0.55–1.31) 0.90 (0.56–1.46) 0.92 (0.60–1.41) 0.9517
 Hypercholesterolemia§ 1.00 1.39 (0.94–2.07) 1.19 (0.83–1.71) 1.09 (0.77–1.56) 1.41 (0.99–2.03) 1.44 (0.97–2.13) 1.41 (0.97–2.07) 0.0636
 Hypertriglyceridemia 1.00 0.90 (0.58–1.38) 1.09 (0.73–1.63) 0.69 (0.45–1.05) 1.03 (0.70–1.52) 0.98 (0.64–1.50) 0.94 (0.60–1.46) 0.8516
 Atherogenic dyslipidemia 1.00 1.31 (0.91–1.90) 1.15 (0.81–1.64) 0.85 (0.61–1.19) 1.15 (0.85–1.64) 1.18 (0.85–1.64) 1.26 (0.89–1.77) 0.3807

OR, odds ratio; CI, confidence interval; BMI, body mass index; SBP, systolic blood pressure; DBP, diastolic blood pressure; HDL, high-density lipoprotein; TG, triglyceride.

All analyses accounted for the complex sampling design effect and appropriate sampling weights of the national survey using PROC SURVEY in SAS. Multivariate adjusted logistic regression was used to estimate ORs (95% CIs) and p values for trends after adjustment for age, education, household income, residence, current smoking, current alcohol drinking, physical activity, BMI (except for the model with obesity and increased waist circumference), and energy intake.

*Obesity (BMI ≥25 kg/m2), Definition of metabolic syndrome (three or more abnormalities): increased waist circumference (≥90 cm for men and ≥85 cm for women), elevated triglycerides (≥150 mg/dL), reduced HDL cholesterol (<40 mg/dL for men and <50 mg/dL for women), elevated blood pressure (SBP ≥130 mm Hg or DBP ≥85 mm Hg), or elevated fasting glucose (≥100 mg/dL), Type 2 diabetes (fasting glucose ≥126 mg/dL or medication use), §Hypercholesterolemia (≥240 mg/dL or medication use), Hypertriglyceridemia (≥200 mg/dL), Atherogenic dyslipidemia (HDL<40 mg/dL for men, <50 mg/dL for women, and TG ≥150 mg/dL), **p=0.0551, ††p=0.0472, ‡‡p=0.0479, §§p=0.0520.

TOOLS
Similar articles