Abstract
Background:
Methods:
Results:
REFERENCES
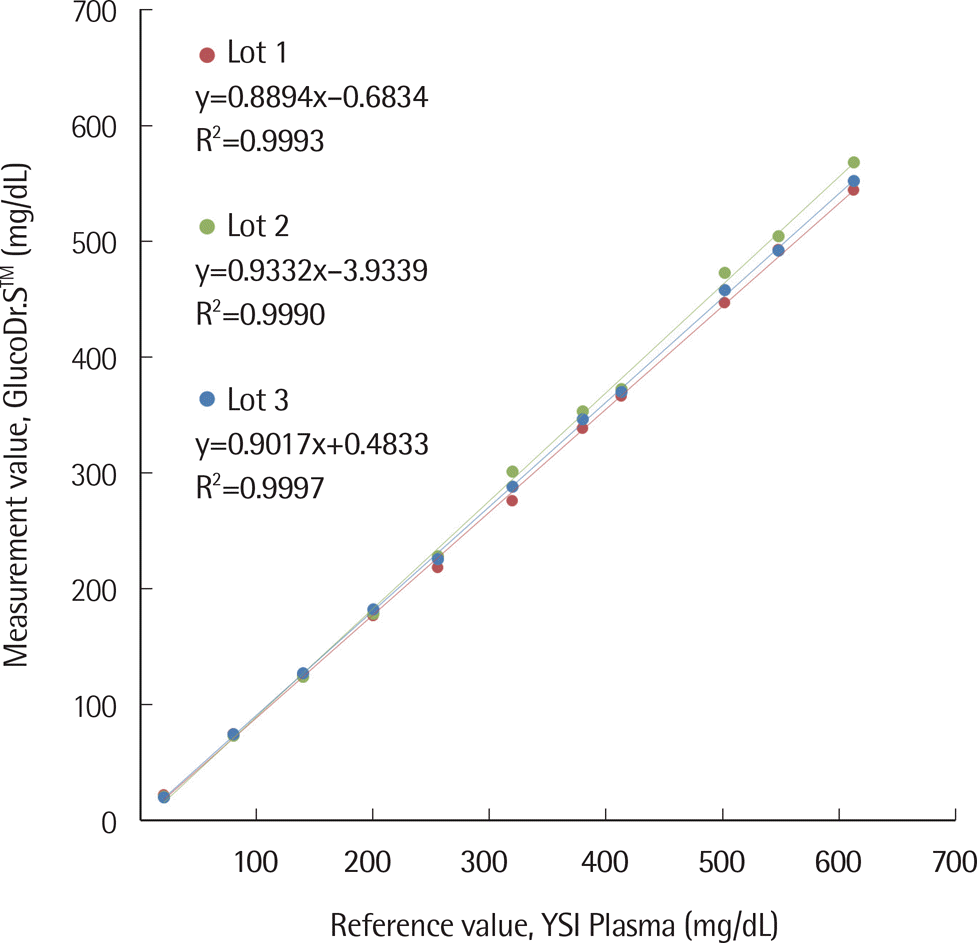
 | Fig. 1.Linearity results of the three lots of GlucoDr.S™. Linearity test was conducted with 9 m, 3 reagent lots, and 11 sample levels. One tester was performed with each combination of reagent lot and sample within one day. Good linearity was indicated at R2≥0.99. |
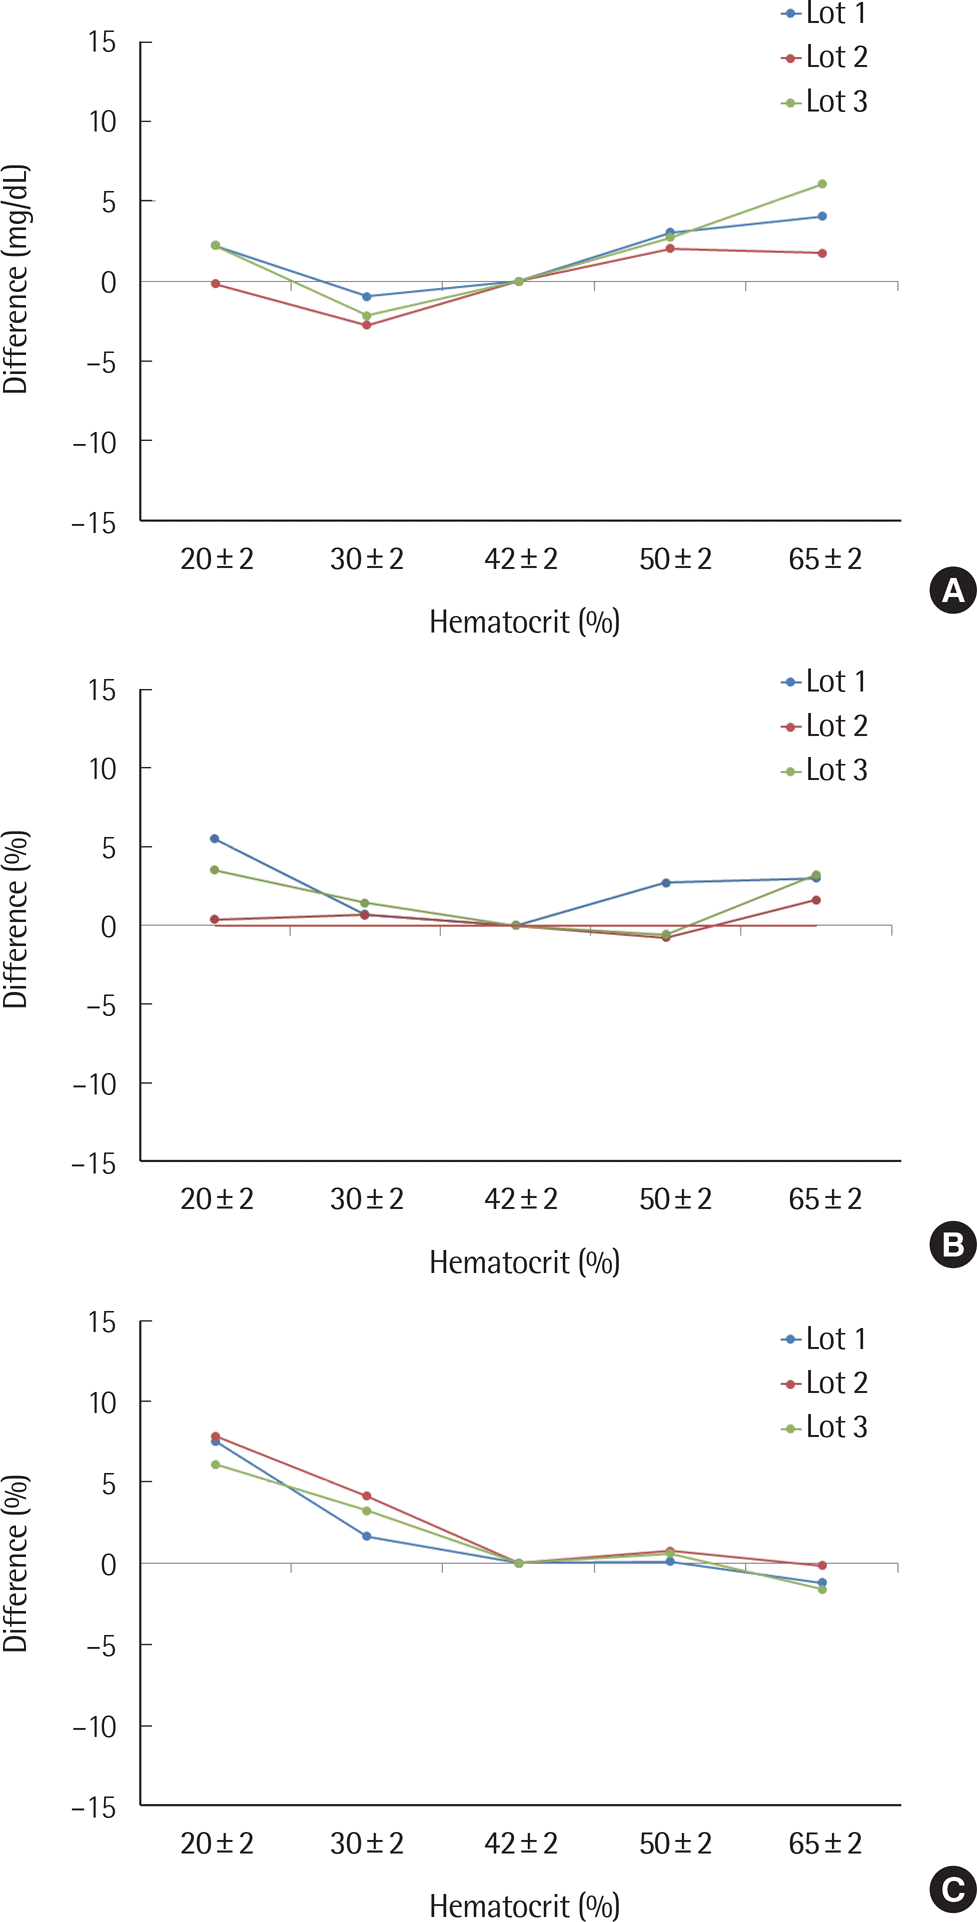
 | Fig. 2.Packed cell volume test. (A) glucose level: 30–50 mg/dL; (B) 96–144 mg/dL; (C) 280–420 mg/dL. |
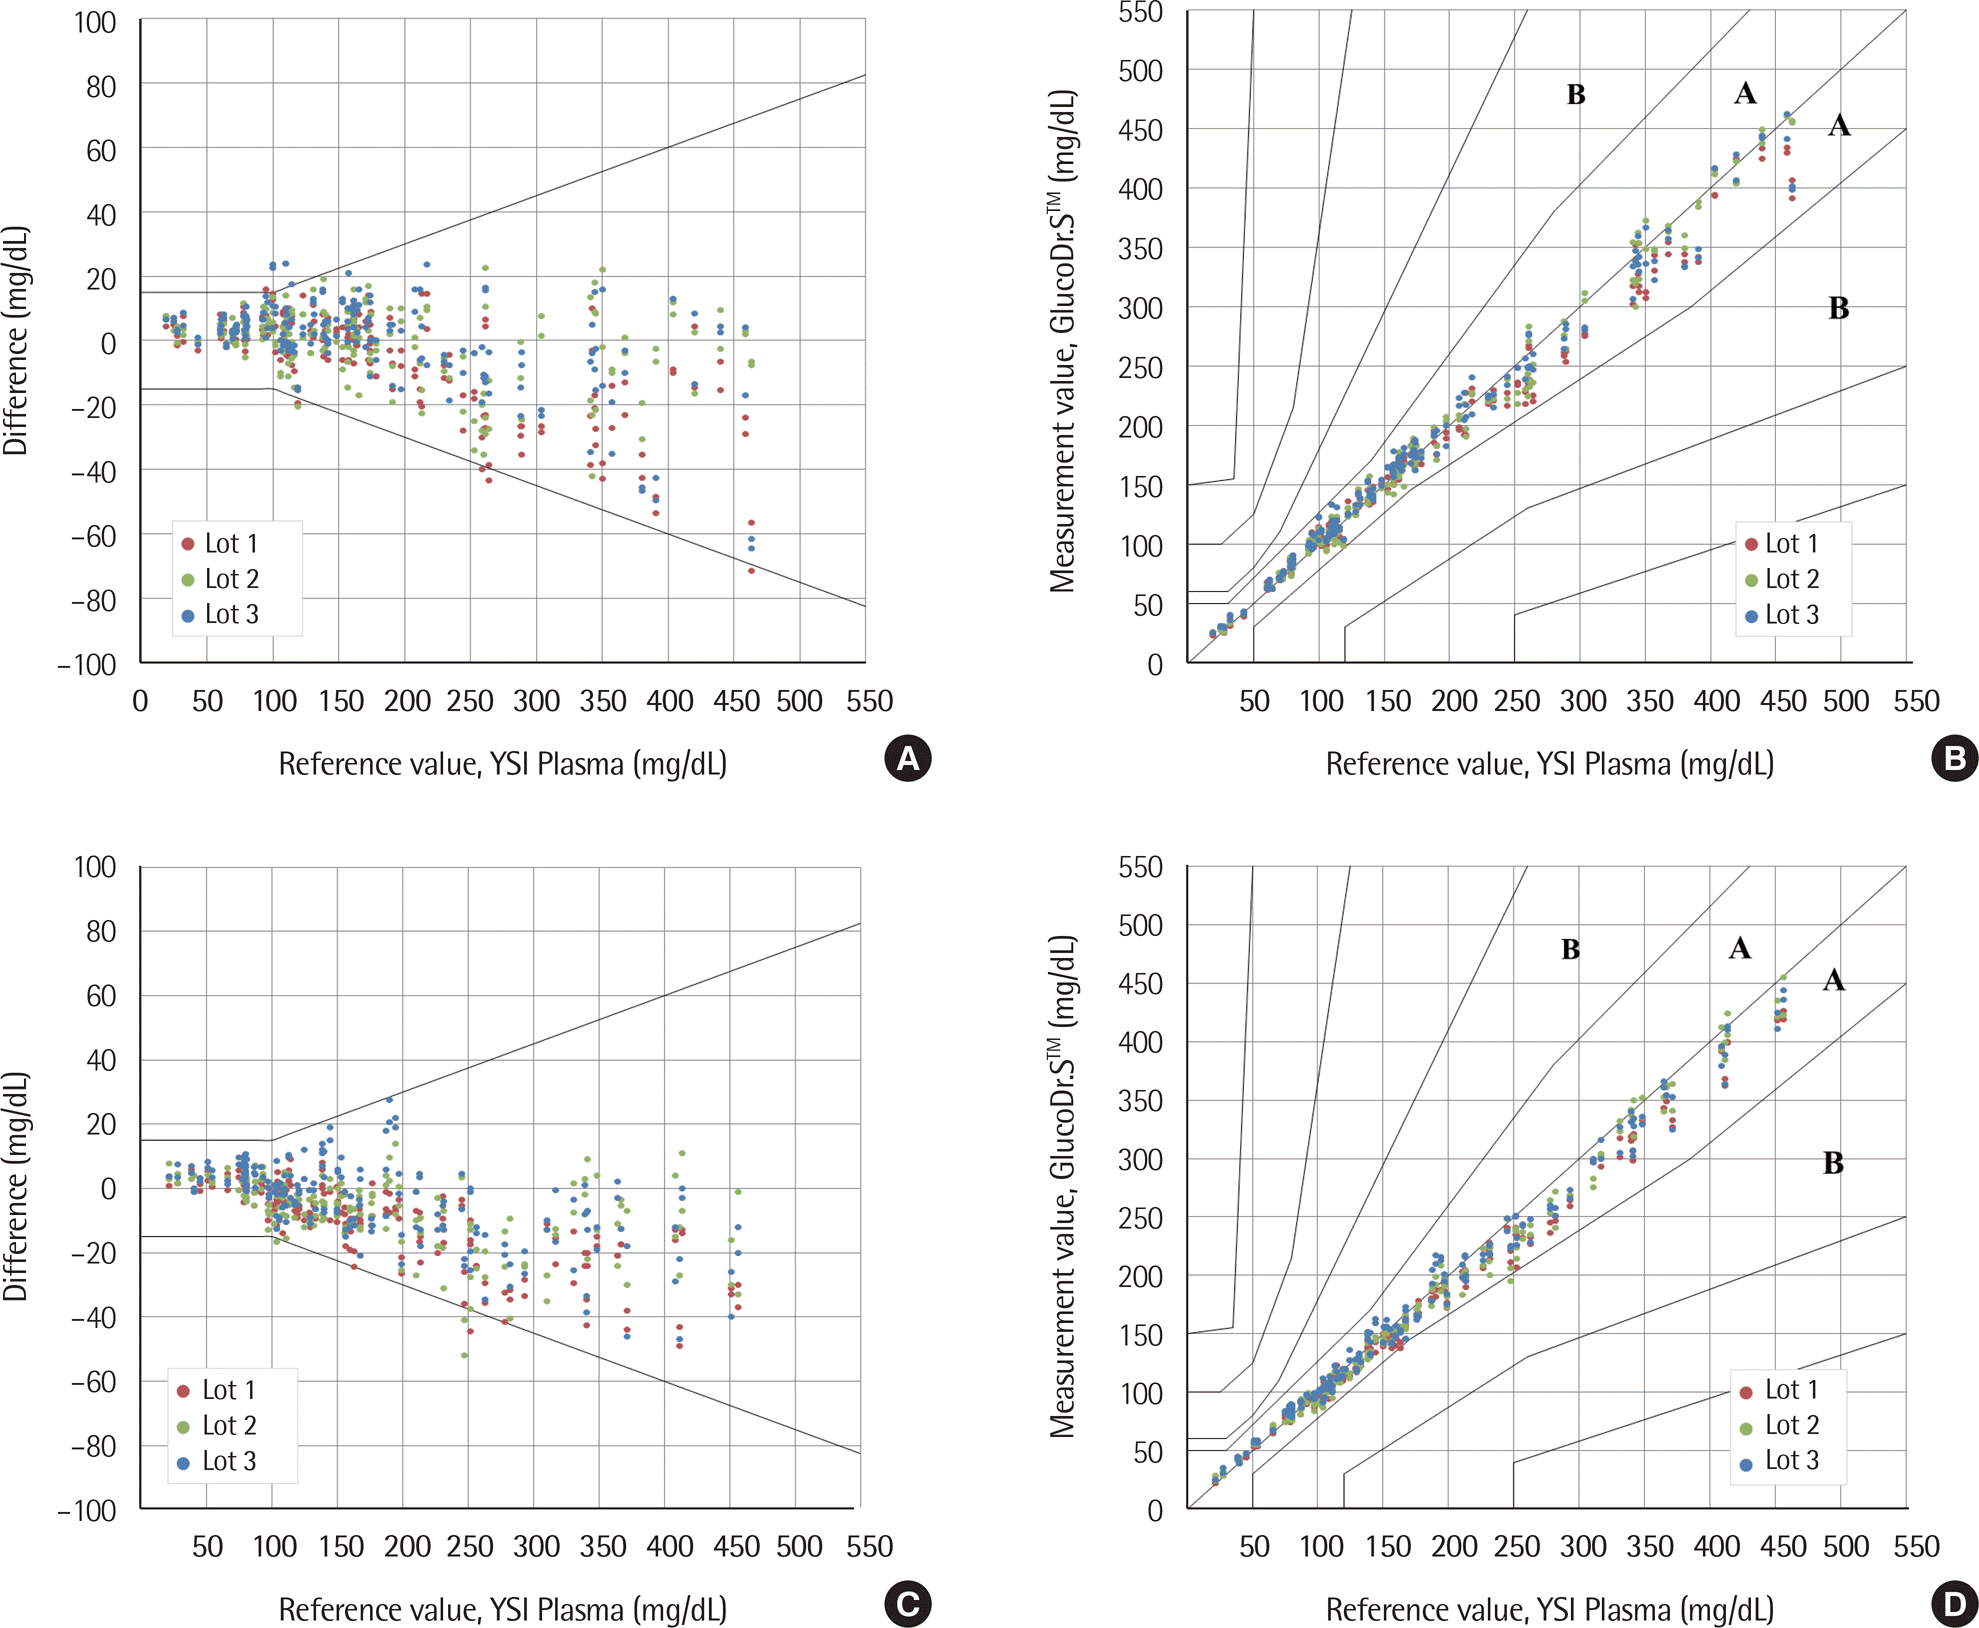
 | Fig. 3.System accuracy of GlucoDr.S™. (A) Difference-plots of capillary blood samples; (B) Clarke error grid analysis of capillary blood samples; (C) Difference-plots of venous blood samples; (D) Clarke error grid analysis of venous blood samples. A zone: No effect on clinical action, B zone: Little or no effect on clinical outcome. |
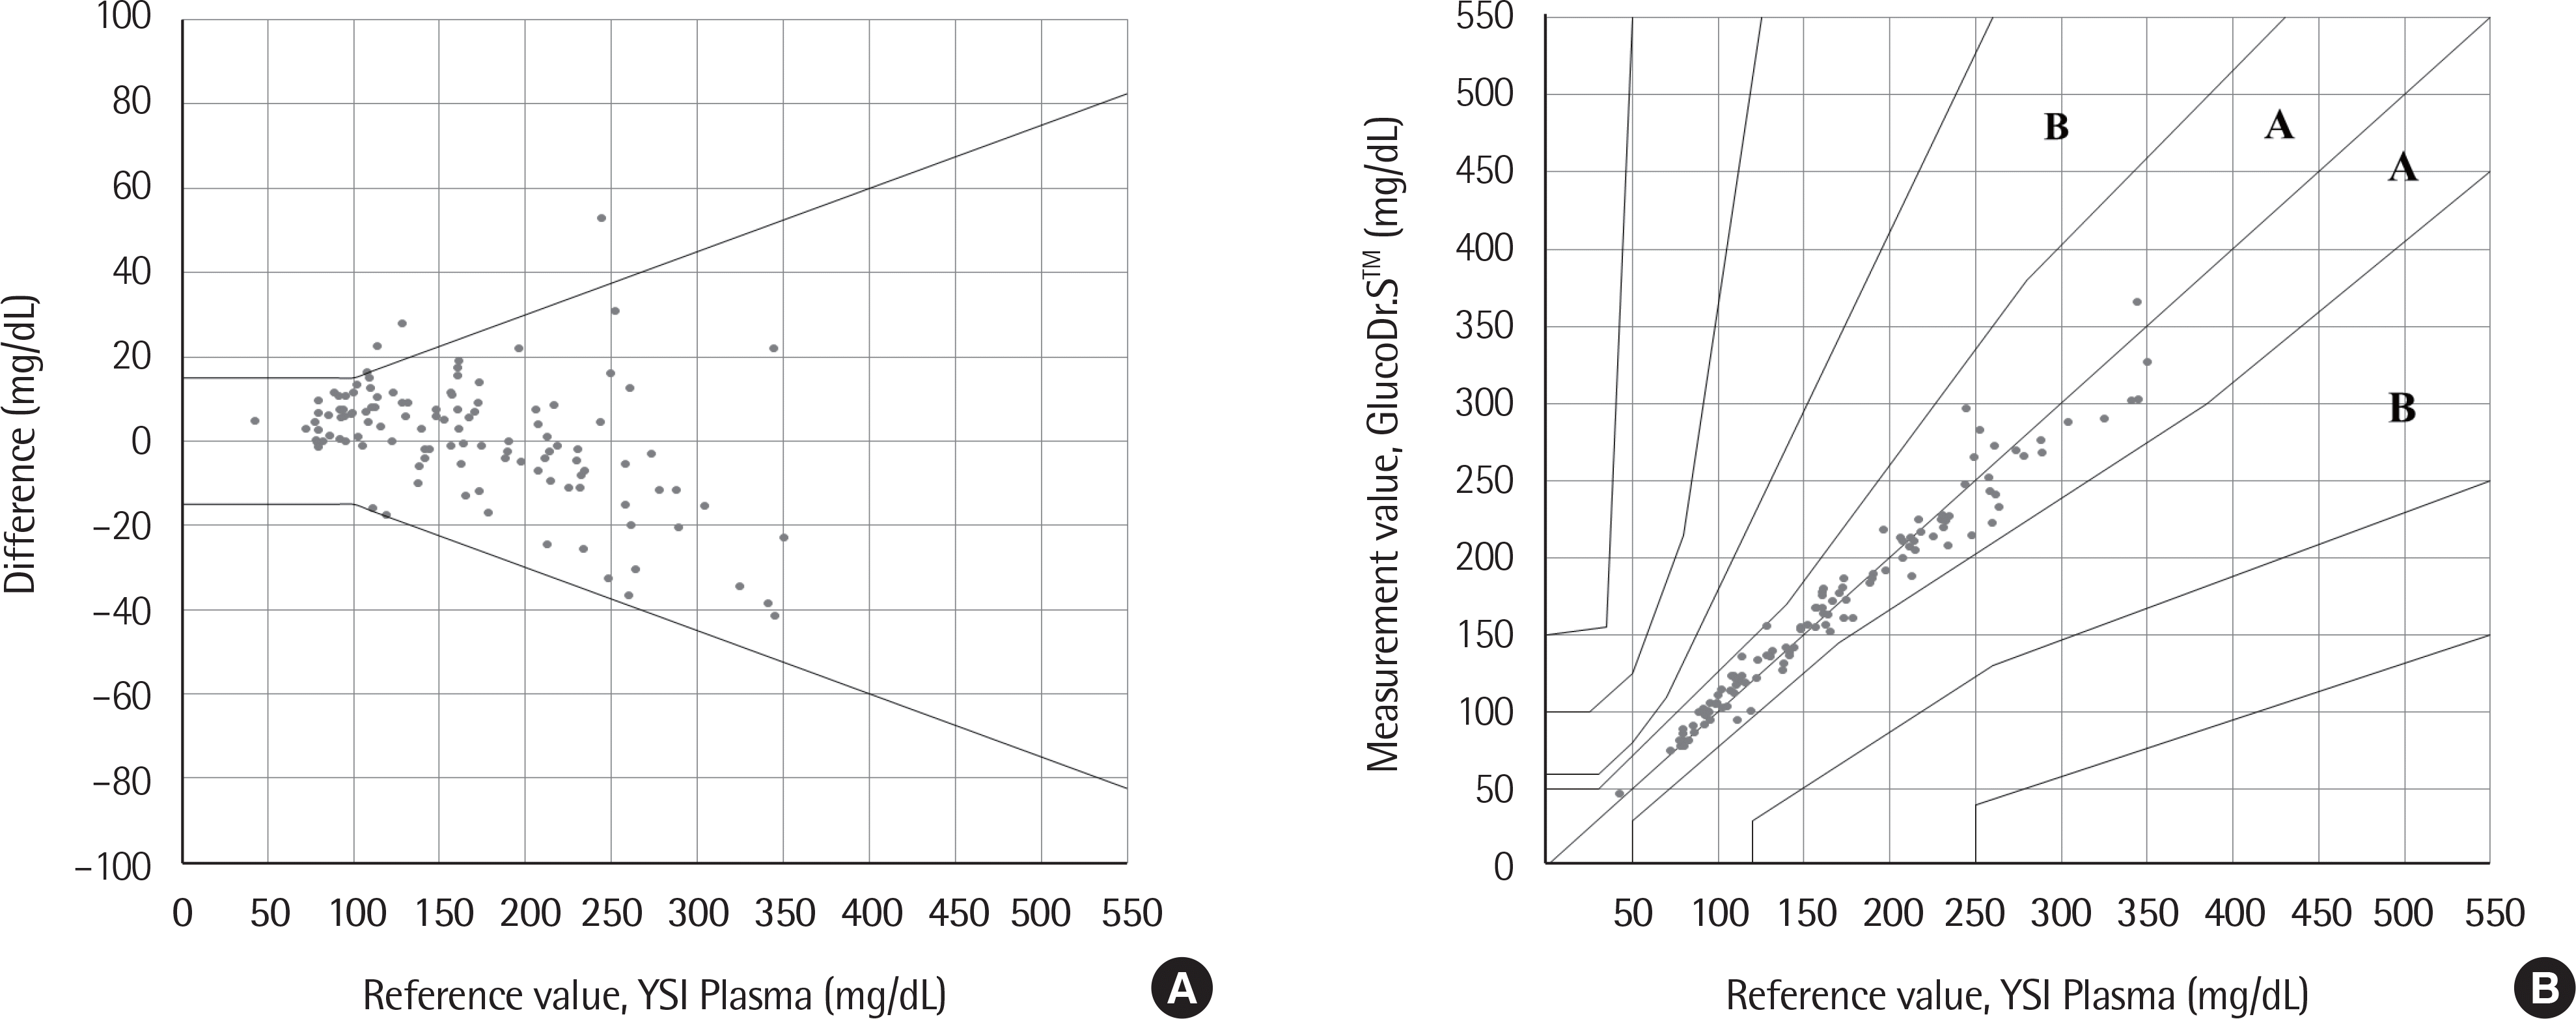
 | Fig. 4.User performance test. (A) Difference-plots; (B) Clarke error grid analysis. A zone: No effect on clinical action, B zone: Little or no effect on clinical outcome. |
Table 1.
| Measurement repeatability∗ | Intermediate measurement precision† | ||||||||
|---|---|---|---|---|---|---|---|---|---|
| Level 1 | Level 2 | Level 3 | Level 4 | Level 5 | Level 1 | Level 2 | Level 3 | Level 4 | |
| Standard concentration, YSI (mg/dL) | 39.1 | 85.5 | 121.0 | 205.0 | 352.0 | 37.2 | 118.0 | 353.0 | 520.0 |
| Mean (mg/dL) | 42.3 | 81.9 | 113.0 | 185.0 | 315.0 | 38.0 | 119.0 | 353.0 | 514.0 |
| SD (mg/dL) | 2.7 | 3.2 | 4.2 | 6.3 | 11.7 | 1.4 | 2.6 | 7.4 | 13.3 |
| CV (%) | 6.3 | 3.9 | 3.7 | 3.4 | 3.7 | 3.7 | 2.2 | 2.1 | 2.6 |
∗ Measurement repeatability test was conducted with 10 meters, 3 reagent lots, and 5 sample levels (Level 1, 30–50 mg/dL; Level 2, 51–110 mg/dL; Level 3, 111–150 mg/dL; Level 4, 151–250 mg/dL; Level 5, 251–400 mg/dL) with glucose concentrations representing hyperglycemic, euglycemic and hypoglycemic conditions. Ten measurements were performed with each combination of meter, reagent lot and sample. In other words, each sample (level) was measured 300 times (10 meters × 3 reagent lots × 10 measurements);
† Intermediated measurement precision test was performed with control materials. The evaluation was conducted with one measurement of each sample per day and 10 meters, 3 reagent lots, and 4 sample levels (Level 1, 30–50 mg/dL; Level 2, 96–144 mg/dL; Level 3, 280–420 mg/dL; Level 4, 425–550 mg/dL) with glucose concentrations representing hyperglycemic, euglycemic and hypoglycemic conditions over 10 days. In other words, each sample (level) was measured 300 times (10 meters × 3 reagent lots × 1 measurement/day ×10 days).
Table 2.
∗ The interference effects were described in the instructions for use if they met ei ther of the following performance criteria. — For glucose concentrations <100 mg/dL, the average difference between th test sample and the control sample exceeds 10 mg/dL. — For glucose concentrations ≥100 mg/dL, the average difference between th test sample and the control sample exceeds 10%. Abbreviations: L-DOPA, L-3,4-dihydroxyphenylalanin; NT, Not tested.
Table 3.
| Substance∗ | Maximum test oncentration (mg/dL) |
Upper concentration limit at which there is no interference (mg/dL) |
|
|---|---|---|---|
| Glucose levels, 50–100 mg/dL | Glucose levels, 250–350 mg/dL | ||
| Pralidoxime iodide (PAM) | 80 | 20 | 10 |
| Uric acid | 24 | 8 | 24 |
| Xylose | 20 | 11 | 20 |


 PDF
PDF ePub
ePub Citation
 Print
Print


 XML Download