

 PDF
PDF ePub
ePub Citation
 Print
Print


INTRODUCTION
Ultrasonography (US) is an accurate modality for noninvasive identification and evaluation of thyroid nodules; however, the sensitivity and specificity of US alone are relatively low, in the ranges of 52–81% and 54–83%, respectively (1). To overcome these limitations, US malignancy risk stratification systems for thyroid nodules and noninvasive additional US techniques for identifying malignancy have been introduced. Ever since Horvath et al. (2) initially introduced the Thyroid Imaging Reporting and Data System (TIRADS), US risk stratification systems for thyroid nodules have been investigated in many studies (3456789). Recently, Shin et al. (10) revised the Korean TIRADS (K-TIRADS) with regard to US-based diagnosis and management of thyroid nodules in clinical practices (10).
As a noninvasive additional US technique for thyroid evaluation, several guidelines have considered the color Doppler US feature of central vascularity as a US predictor of malignancy (1112) and one of the suspicious US features (913). However, the role of Doppler US examination remains a matter of debate in the literatures (14151617).
Ultrasonography elastography is a relatively new and noninvasive technique developed to obtain information on tissue stiffness (18192021). As described in the literature (22), elastography is used complementary to conventional gray-scale and Doppler US for improving the diagnosis of thyroid nodules, which appear harder than the surrounding tissue. The European Federation of Societies for Ultrasound in Medicine and Biology Guidelines stated that tissue found to be hard on an elastography scan is closely correlated with malignant disease (23). As the US elastography has developed, a new thyroid elastography technique that uses carotid artery pulsation as the internal compression source has recently been introduced as a way of reducing the limitations of elastography, such as variability of the different compression levels by the operators (24) and the out-of-plane motion during external compression (25). Based on this new technique, the elasticity contrast index (ECI) can be obtained through a quantitative scoring method. Lim et al. (26) previously reported good interobserver agreement and intraobserver reproducibility with this technique. In addition, Cho et al. (27) recently demonstrated the diagnostic efficacy of the ECI value for thyroid nodules with US-pathology discordance. In this prospective study, we evaluated the diagnostic performance of gray-scale US and Doppler US based on the K-TIRADS and elastography, using carotid artery pulsation in the differential diagnosis of thyroid nodules, and we tried to find a complementary role for elastography.
MATERIALS AND METHODS
This prospective study was approved by the ethics committee at our institution, and all patients provided written informed consent.
Patients
Between November 2015 and February 2016, 241 consecutive patients, who had 253 thyroid nodules, were included in this study. All of the nodules were ≥ 1 cm in diameter, and the patients were scheduled for biopsy or surgery at the time of US examination. Of these patients, 54 were excluded because the cytohistologic diagnosis was incomplete (n = 14), some nodules were not followed up by US assessment (n = 36), or there was incomplete data acquisition at elastography (n = 4). Finally, a total 197 thyroid nodules with 91 malignant and 106 benign pathologic results from 187 patients (41 male and 146 female; age range, 20–83 years; mean age, 49.4 years) were included in this prospective study.
Real-Time US, Doppler US, and Elastography
Before starting this prospective study, a consensus meeting was held to establish a consensus in the study protocols and the lexicon for the US criteria. During a consensus meeting, three experienced radiologists evaluated images and assessed the lexicon for the US criteria of 30 biopsy-proven thyroid nodules not included in this study. In addition, before starting the study, all three radiologists employed the thyroid elastography technique in the assessment of more than 30 nodules.
Conventional gray-scale US, Doppler US, and elastography were performed using a US system (RS80A with Prestige, Samsung Medison, Co. LTD., Seoul, Korea) with dedicated elastography quantitative software (Samsung Medison, Co. LTD.) with a 5–13 MHz linear transducer. One of three board-certified radiologists with more than 8 years of experience specializing in thyroid imaging performed all the imaging examinations. The gray-scale US images were prospectively evaluated and categorized according to the K-TIRADS by the same radiologist who performed the US examinations. The final K-TIRADS category was decided as high suspicion, intermediate suspicion, low suspicion, or benign nodule based on the malignancy risk stratified by US patterns composed of integrated solidity, echogenicity, presence of microcalcification, orientation, and margin (10). Category 1 represented no nodule; category 2, a benign nodule (spongiform, pure cyst, or partially cystic nodule with comet tail artifact, < 3% malignancy risk); category 3, low suspicion nodule (partially cystic or isohyperechoic nodule without any of the three suspicious US features, 3–15% malignancy risk); category 4, intermediate suspicion nodule (solid hypoechoic nodule without any of the three suspicious US features or partially cystic or isohyperechoic nodule with any of the three suspicious US features, 15–50% malignancy risk); and category 5, high suspicion nodule (solid hypoechoic nodule with any of the three suspicious US features, > 60% malignancy risk).
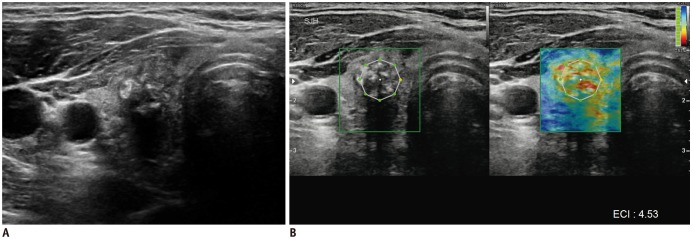
Doppler US was performed to assess vascularity during the same US examination by the same operator. The vascularity patterns of the thyroid nodules were categorized as four types, according to the K-TIRADS: type 1, absence of nodule vascularity; type 2, perinodular vascularity only; type 3, mild intranodular vascularity with or without perinodular vascularity (vascularity < 50%); and type 4, marked intranodular vascularity with or without perinodular vascularity (vascularity > 50%). Elastography was also performed by the same radiologist who performed the gray-scale and Doppler US. No external compression with the transducer was applied because carotid artery pulsation was used as the compression source. As a consequence, the nodules were colored depending on their stiffness. On the upper right side of the screen, a scale indicates stiff and soft areas with red and blue colors, respectively (Fig. 1). The operator decided on the predominant color of the thyroid nodules and recorded it. The elasticity parameter, ECI, was determined by manually setting the region of interest within the lesion; once the region of interest was manually set, the ECI was automatically calculated and recorded. To minimize possible observer variability or effects of environmental factors, the operator measured the ECI values once from the transverse plane and once from the longitudinal plane. The ECI values were measured once at each plane.
Data and Statistical Analysis
Thyroid nodules with malignant pathologic results at surgery (n = 81), with malignant cytologic results being confirmed at least twice (n = 6), or with suspicious malignant cytologic results on initial fine needle aspiration (FNA) and malignant results on follow-up core needle biopsy (CNB) (n = 3) were finally classified as malignant.
Thyroid nodules were finally classified as benign when benign pathologic results were obtained at surgery (n = 34); benign cytologic results were confirmed at least twice (n = 27); benign cytologic results were found on both initial FNA and follow-up CNB (n = 10); and there was no increase in size (n = 27) or decrease in size on follow-up US (n = 8). For the reference standard, all initial and repeat biopsy results were included, regardless of the study period.
All data were collected prospectively and recorded by each radiologist in a computerized spreadsheet (Excel; Microsoft, Redmond, WA, USA). We used the χ2 test for categorical variables, the t test for continuous variables with normal distribution, and the Mann-Whitney U test for continuous variables with non-normal distribution to compare the differences in demographic and US characteristics between patients with benign and malignant thyroid nodules. The malignancy rate in each K-TIRADS category based on the gray-scale US was calculated in terms of percentage of malignancy.
In terms of ECI parameters, positive results for transverse and longitudinal elasticity values were determined using the cut-off values obtained with the Youden index (28), and we decided which ECI value was more accurate. The Kruskal-Wallis nonparametric rank sum test was used to test for equality of population medians among the different types of thyroid nodules.
The diagnostic performances of gray-scale US, Doppler US, and elastography for differentiating malignant from benign thyroid nodules were evaluated. The areas under the curve (Az) values were compared by the receiver operating characteristic (ROC) curve analysis with 95% confidence intervals (CIs). The diagnostic performance of the ECI with various cut-off values was evaluated, along with the sensitivity, specificity, positive predictive value (PPV), and negative predictive value (NPV). The diagnostic performances of the K-TIRADS category of gray-scale US, ECI of elastography, and the combined assessment of both techniques using the optimal ECI cut-off value were evaluated and compared using McNemar's test. For the combined assessment of gray-scale US and elastography, the K-TIRADS category was downgraded or upgraded when an ECI value indicated perfect predictive value with no false negatives or false positives.
The statistical analysis was performed using SPSS® version 23.0 software (IBM Corp., Armonk, NY, USA), and statistical significance was accepted as a p value of less than 0.050.
RESULTS
The clinical and imaging characteristics of the 187 patients and the 91 malignant and 106 benign thyroid nodules are summarized in Table 1. The mean age of patients with malignant thyroid nodules was significantly younger than that of those with benign nodules (p = 0.000). The mean size of the malignant thyroid nodules was significantly smaller than that of the benign nodules (p = 0.005). Calcifications were more frequently seen in malignant than in benign nodules (p = 0.000). K-TIRADS categories based on gray-scale US were higher in the malignant group than in the benign group (p = 0.000). The malignancy rate in each K-TIRADS category was 0% (0/18) for category 2, 20.2% (18/89) for category 3, 54.1% (20/37) for category 4, and 100% (53/53) for category 5. The ECI was significantly higher in malignant nodules than in benign thyroid nodules (p < 0.001). Type 4 vascularity (marked intranodular vascularity) on Doppler US and stiffness color (red) on elastography were more frequent in malignant thyroid nodules (p = 0.009 and p = 0.010).
The transverse measurement method was the more accurate elastography technique, achieving an area under the ROC curve of 0.693 (95% CI 0.620–0.766) and having an optimal cut-off value of 1.71. The longitudinal ECI measurement method had an area under the ROC curve of 0.635 (95% CI 0.557–0.714), and its best cut-off value was 1.91. In this study, an ECI value in a transverse measurement was adopted as the appropriate measure for suspected malignancy in the evaluation of thyroid nodules.
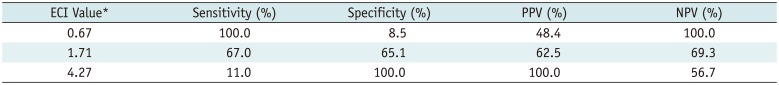
Table 2 lists the diagnostic performance of the ECI with various cut-off values for the differential diagnosis of thyroid nodules as benign or malignant. The optimal cut-off value of the ECI was 1.71 with estimated sensitivity 67%, specificity 65.1%, PPV 62.5%, and NPV 69.3%. No benign nodules had ECI values ≥ 4.27, and no malignant nodules had ECI values ≤ 0.67.
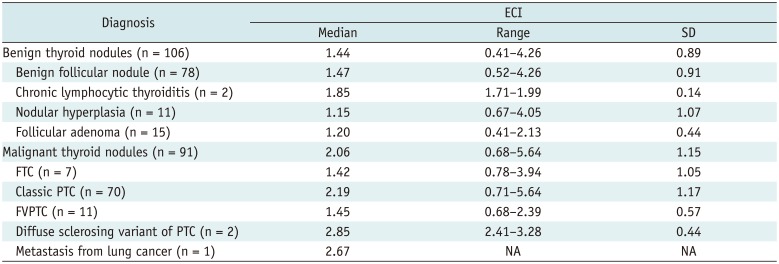
The cytopathologic and histopathologic diagnoses and correlation of ECI values are summarized in Table 3. The median ECI value of follicular thyroid carcinoma (FTC) and follicular variant of papillary thyroid carcinoma (FVPTC) was significantly lower than those of the other malignant lesions (p = 0.005). However, there was no significant difference in the ECI among the benign thyroid nodules (p = 0.299). Meanwhile, a diffuse sclerosing variant of PTC and a metastatic nodule showed the two highest median values of the ECI.
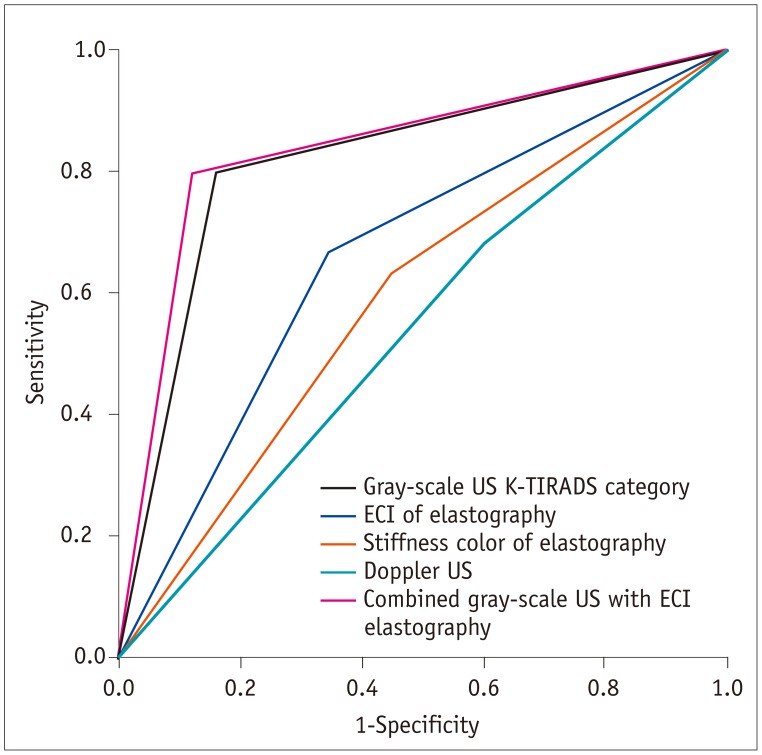
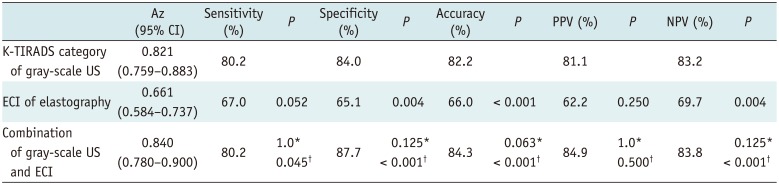
The Az values for each dataset were 0.821 (95% CI 0.759–0.883) for K-TIRADS category of gray-scale US, 0.661 (95% CI 0.584–0.737) for ECI of elastography, 0.592 (95% CI 0.513–0.672) for stiffness color of elastography, and 0.539 (95% CI 0.458–0.619) for Doppler US (Fig. 2). Therefore, we applied K-TIRADS and the ECI in order to evaluate and compare the diagnostic performance of the imaging methods.
For the combined assessment of gray-scale US and elastography, the reader downgraded the K-TIRADS category when an ECI ≤ 0.67 was assigned, and upgraded the K-TIRADS category when an ECI of ≥ 4.27 was assigned. For lesions with an ECI between 0.67 and 4.27, the K-TIRADS category was not changed. The Az value for a combined assessment of the gray-scale US and the ECI was higher than that for the gray-scale US alone; however, there was no statistical difference (p = 0.219) (Table 4). Using the combined assessment of both techniques, the sensitivity (80.2%) and specificity (87.7%) were significantly higher than those of elastography with the ECI alone (67.0% and 65.1%) (p = 0.034).
DISCUSSION
Ultrasonography elastography was developed to obtain information on tissue stiffness noninvasively (18192021), and it is used complementary to conventional gray-scale and Doppler US for improving the diagnosis of thyroid nodules, which appear harder than the surrounding tissue (22). In this study, we employed a new elastographic technique that uses carotid artery pulsation as a compression source for thyroid elastography, which was more regular and objective than manual external compression. This technique was first introduced by Bae et al. (24) in a preliminary study indicating the feasibility of pulsation-induced thyroid strain elastography and was later assessed in various studies (2426272930313233).
Previously, several studies have analyzed the efficacy of elastography for differentiating between benign and malignant thyroid nodules. Some of these studies reported that the diagnostic performance of elastography was similar to or higher than that of gray-scale US (31333435). They concluded that the high specificity of elastography could play an adjunctive role in enhancing the diagnostic performance of gray-scale US. In our study, to assess the diagnostic performance of quantitative elastographic parameters, we derived cut-off values of 0.67 and 4.27 for the lower and upper limits of the ECI, respectively. For the combination of gray-scale US and elastography, the ECI with these cut-off values was used, because it resulted in the highest Az value of all the combinations of diagnostic methods, but this finding was not statistically significant. Cho et al. (27) recently evaluated the diagnostic accuracy of the ECI, using a different study design, but they obtained results similar to ours.
For quantification of the local strain contrast within a nodule, the ECI has been used as the parameter for elastography using carotid artery pulsation (2426272930313233). In this study, our cut-off value for the ECI was lower than those in previous studies for differentiating malignant from benign thyroid nodules (27313233). The relatively high cut-off value (ranging from 2.45 to 3.60) of those studies may be a consequence of the small number of malignant cases, a comparatively homogeneous population of malignant cases (almost whole numbers of PTC), the malignant cases with small sizes (less than 1 cm), or narrow inclusion criteria (indeterminate US features only). Meanwhile, our study included a larger number of malignant nodules with various types of histology and various US findings, and it excluded nodules less than 1 cm in size. In particular, FVPTC and FTC comprised 19.8% of malignant thyroid nodules (12.1% and 7.7%, respectively). Our median ECI value for total malignant nodules was 2.06 ± 1.15, while those for the FVPTC and FTC were, respectively, 1.45 ± 0.57 and 1.42 ± 1.05, which was much closer to benign (1.45 ± 0.89) than malignant nodules.
In the present study, we applied the K-TIRADS to stratify the malignancy risk of thyroid nodules on gray-scale US. The malignancy rate for each K-TIRADS category was as follows: 0% for category 2, 20.2% for category 3, 54.1% for category 4, and 100% for category 5. Our malignancy rates for categories 3 and 4 were slightly higher than the expected malignancy risk (10). Because our institution is a referral center, the proportion of malignant thyroid nodules in our patient population might be higher than that of other institutions. As described above, 19.8% of our malignant cases were diagnosed as FVPTC or FTC. According to the studies (363738), FVPTC and FTC have less frequent malignant US findings compared to classic PTC. Therefore, these tumors should be considered when they lack malignant US appearances (category 3 and 4) and have a lower ECI of elastography, but being malignant or follicular neoplasms at cytology.
This study had several limitations. First, interobserver variability was not evaluated in the assessment of US and elastography. Second, patient factors (e.g., weight, pressure, and combinations of diseases such as diabetes mellitus, hypertension, and atherosclerosis) and nodule factors (e.g., distance of the nodule from the carotid artery) that might influence the diagnostic accuracy of US elastography were not analyzed. Because we used carotid artery pulsation as the compression source, these factors could have affected the results of elastography. Kim et al. (39) reported that elastography results for nodules within 1 cm distance of the carotid artery should be interpreted with caution. To reflect daily practice conditions, in this study we evaluated all nodules regardless of location.
In conclusion, for differentiating thyroid nodules, the diagnostic performances of a combination of gray-scale US and elastography with ECI were similar but not superior to those of gray-scale US alone. FVPTC and FTC have a significantly lower ECI value than those of the other malignant lesions.

 XML Download