

 PDF
PDF ePub
ePub Citation
 Print
Print


INTRODUCTION
Parotid gland tumors constitute approximately 3% of all head and neck tumors (1), with a majority of patients presenting with a palpable mass in the pre-auricular region. For patients with suspected parotid gland tumors, CT can easily confirm the presence of a parotid mass and assess the extent of tumor to facilitate the determination of benign or malignant nature of the tumor for appropriate treatment selection. However, streak artifacts caused by various dental restorations on CT often interfere with the evaluation of the parotid gland and Stensen duct. Furthermore, they increase the difficulty of evaluation of masses originating in the deep lobe of the gland, which lies anterior to the styloid process of the temporal bone and lateral to the parapharyngeal fat (2).
Technological advances have continued to improve the quality of CT images, with a noticeable progression in CT reconstruction algorithms, particularly iterative reconstruction techniques (3). The most recently introduced knowledge-based iterative model reconstruction (IMR) system has been used for CT imaging of various body parts, with several advantages such as better image quality and decreased noise and radiation dose, compared with previous CT reconstruction algorithms (4567).
The purpose of this study was to assess the diagnostic utility of low-dose CT using the IMR algorithm in patients with parotid gland tumors and compare the CT images with those obtained via other reconstruction algorithms and with non-low-dose CT.
Go to : 
MATERIALS AND METHODS
Patients
This prospective clinical study was approved by our Institutional Review Board, and informed consent was obtained from each patient. Between November 2015 and July 2016, 42 consecutive patients (16 males and 26 females) with suspected parotid gland tumors who were scheduled to undergo contrast-enhanced CT were enrolled in this study. In addition, after retrospective review of these patients, prior or subsequent non-low-dose CT images within 12 months were available in 10 patients (5 males and 5 females), who were included for the comparison of imaging parameters using the reconstruction methods and non-low-dose CT images. However, subsequent non-low-dose CT images after surgery were not included. The median patient age was 50.5 years (range, 20–78 years), and the median body mass index (BMI) was 23.4 kg/m2 (range, 18.9–35.3 kg/m2).
Overall, 36 patients underwent surgical excision or biopsy for their parotid gland masses, and the final histopathological diagnoses were: benign non-neoplastic lesions in two, benign neoplasms in 28, and malignancy in 6. The specific histological types included lymphoepithelial cyst (n = 1), branchial cleft cyst (n = 1), pleomorphic adenoma (n = 23), Warthin tumor (n = 3), basal cell adenoma (n = 1), myoepithelioma (n = 1), mucoepidermoid carcinoma (n = 1), salivary duct carcinoma (n = 1), and lymphoma (n = 4). The remaining six patients were diagnosed with acute parotitis (n = 3), pneumoparotid (n = 1), and lipoma (n = 2) on the basis of imaging findings without further diagnostic or therapeutic procedures. The mean size of the 38 measurable masses on CT images was 22.6 ± 9.6 mm (range, 8.1–51.0 mm).
Image Acquisition and Reconstruction
All studies were performed using a 256-row multidetector CT scanner (Brilliance iCT scanner; Philips Healthcare, Cleveland, OH, USA) at our institution. CT images were acquired at a manually fixed peak tube voltage of 100 kVp, with automated Z-axis dose modulation using a scout image (DoseRight; Philips Healthcare). The maximal tube current was limited to 150 mAs, and the effective mAs ranged from 77 mAs to 131 mAs. The field of view was 180 mm, with a matrix of 512 × 512. Other scanning parameters were as follows: detector configuration, 128 × 0.625 mm; pitch, 0.601; tube rotation time, 0.5 seconds; and acquisition mode, helical.
All patients underwent contrast-enhanced CT in the supine position using a neck CT protocol. Contiguous images of the neck were acquired in the axial plane from the orbital floor to the suprasternal notch. A total of 80–100 mL of the iodinated contrast medium iobitridol (Xenetix 300; Guerbet, Roissy, France) was intravenously administered at a flow rate of 2 mL/s using an automated injector, followed by injection of 40 mL of 0.9% saline solution at the same flow rate. Contrast-enhanced CT scans were obtained at 40–60 seconds after the initiation of contrast agent administration.
Three axial image datasets were created by reconstructing the identical raw projection dataset using three different algorithms, namely filtered back projection (FBP), iDose4 level 3 (a fourth-generation hybrid iterative reconstruction algorithm supplied by Philips Healthcare), and IMR level 1. The iDose4 and IMR algorithms include levels 1–7 and levels 1–3, respectively, with a higher level providing greater noise reduction. All reconstructed section thicknesses were 3 mm.
Concurrent non-low-dose CT images in 10 patients were obtained with various scanners and vendors, suggesting variation in parameters. They consisted of a helical scan at a tube voltage of 120 kVP and mAs ranging from 90 mAs to 150 mAs. FBP reconstruction algorithms were used.
To evaluate the radiation dose, the CT dose index volume (CTDIvol, described in mGy) and dose length product (DLP, described in mGy-cm) were recorded, according to the dose report (8).
Objective Image Analyses
Objective image assessment was conducted by measuring the background noise (BN), signal-to-noise ratio (SNR), and contrast-to-noise ratio (CNR) as quantitative image parameters on a Picture Archiving and Communication System (PACS) workstation (Centricity RA 1000; GE Healthcare, Chicago, IL, USA). A head and neck radiologist with 6 years of experience recorded the average attenuation values (V) and standard deviation (SD) of Hounsfield units (HU) by placing a circular or ovoid region of interest measuring approximately 10 mm in diameter in the two empty spaces bilaterally on the head (Air), masseter muscle (MM), and internal jugular vein (IJV) at the same level of the parotid gland mass (Fig. 1). The measurement was repeatedly conducted for each of the three image datasets, and BN, SNR, and CNR were calculated using the following formulae:
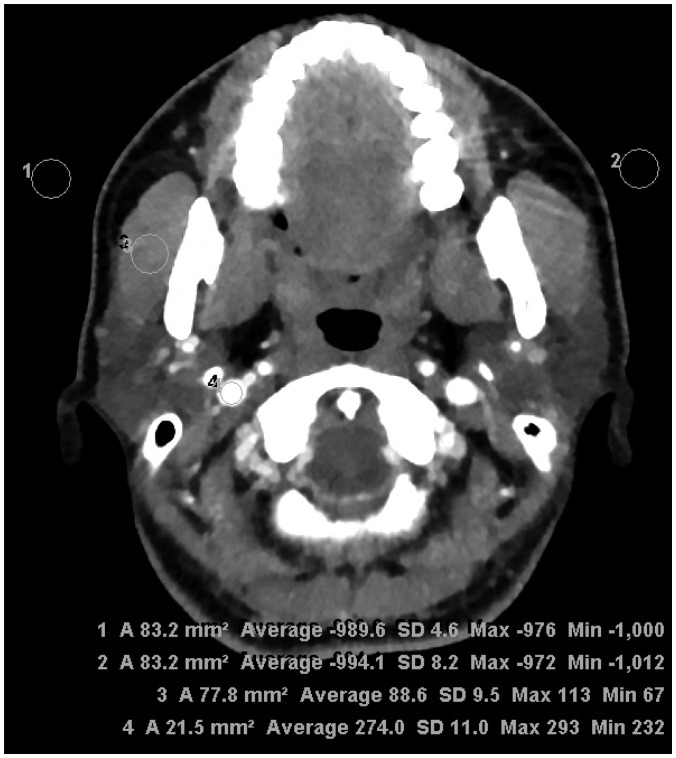 | Fig. 1Assessment of objective image quality at parotid gland level.Regions of interest were drawn to bilaterally measure SD of air (background noise) and attenuation of masseter muscle and internal jugular vein for estimation of signal-to-noise ratio and contrast-to-noise ratio. SD = standard deviation
|


Subjective Image Analyses
Using a PACS workstation, two radiologists with 15 years and 4 years of experience, respectively, independently assessed 4 axial image sets displayed on 4 monitors concurrently in 10 patients for whom non-low-dose CT was available. Three axial image sets displayed on 3 monitors were also assessed in the remaining 32 patients for whom non-low-dose CT was not available. In addition to the default preselected window settings (window width of 350 HU, window level of 60 HU), the radiologists were allowed to change the window width and level for optimal viewing conditions. The image sets of each patient were displayed randomly to each radiologist. Both radiologists were blinded to the patient data, clinical information, and image reconstruction technique.
For each image dataset, each radiologist graded the overall image quality (1 = non-diagnostic, 2 = poor, 3 = sufficient, 4 = good, 5 = excellent), delineation of tumor (ranging from 1 = no visual delineation to 5 = perfect delineation of tumor), image sharpness (ranging from 1 = distinct blurring to 5 = no apparent image blurring), and image artifact and noise (ranging from 1 = extensive image artifact and noise to 5 = no apparent artifact and noise) (9).
Statistical Analysis
All statistical analyses were performed using SPSS version 20.0 (IBM Corp., Armonk, NY, USA). All recorded data were presented as means ± SDs. Quantitative imaging parameters (BN, SNR, and CNR) and subjective image assessment for the low-dose CT with three reconstruction algorithms and non-low-dose CT were compared using Friedman tests, followed by Wilcoxon signed-rank tests. Interobserver agreement for the subjective image analyses was calculated using Cohen's kappa statistics with quadratic weighting, and estimation of the overall kappa was based on the study of Landis and Koch (10) as follows: slight agreement (0–0.20), fair agreement (0.21–0.40), moderate agreement (0.41–0.60), substantial agreement (0.61–0.80), and almost perfect agreement (0.81–1.00) (10). A p value of < 0.05 was considered statistically significant.
Go to :
RESULTS
The results of the objective image analyses are summarized in Table 1. The mean BN value was significantly lower with the IMR algorithm than with the FBP (4.24 ± 3.77 vs. 11.73 ± 4.06, p < 0.001) and iDose4 algorithm (4.24 ± 3.77 vs. 8.77 ± 3.85, p = 0.037), while the mean SNR value was significantly higher with the IMR algorithm than with the FBP (23.93 ± 7.49 vs. 7.33 ± 2.03, p < 0.001) and iDose4 algorithms (23.93 ± 7.49 vs. 10.20 ± 3.29, p = 0.011). The mean CNR value was significantly higher with the IMR algorithm, compared with that of FBP (25.76 ± 11.88 vs. 9.02 ± 3.18, p < 0.001), although there was no significant difference in the CNR value between the IMR and iDose4 algorithms (25.76 ± 11.88 vs. 16.62 ± 6.54, p = 0.602). Furthermore, while lower BN and higher SNR and CNR values were obtained in IMR-generated low-dose CT, compared with non-low-dose CT, there were no statistically significant differences between them (9.4 ± 12.75, p = 0.268; 14.36 ± 6.66, p = 0.171; and 19.51 ± 11.23, p = 1.000, respectively).
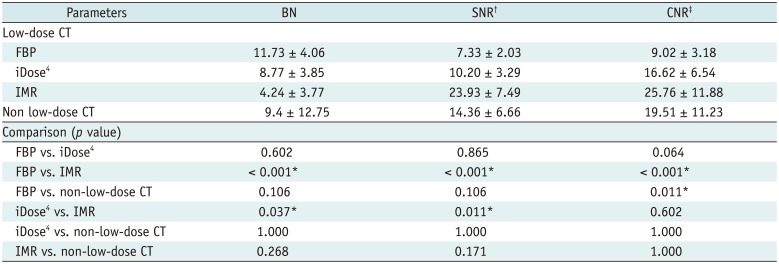
Table 1
Results of Objective Analyses of Reconstruction Techniques for CT in Evaluation of Parotid Gland Masses
*p < 0.05, †SNR measured at MM, ‡CNR between MM and internal jugular vein. BN = background noise, CNR = contrast-to-noise ratio, FBP = filtered back projection, iDose4 = hybrid iterative reconstruction, IMR = knowledge-based iterative model reconstruction, MM = masseter muscle, SNR = signal-to-noise ratio
![]()
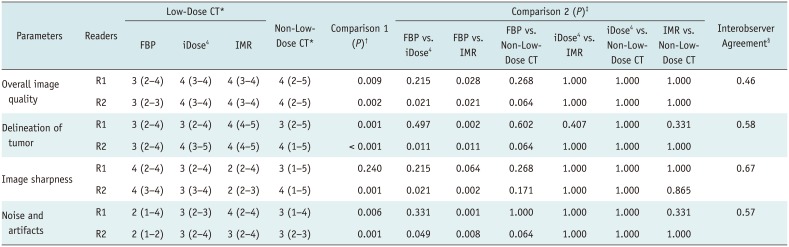
The results of subjective image analyses are shown in Table 2. The four groups were compared using Friedman test, with similar or better subjective image quality scores for low-dose CT using an IMR algorithm compared with those obtained with low-dose CT using FBP and iDose4 algorithms, as well as with non-low-dose CT, with regard to overall image quality, delineation of tumor, and image artifact and noise (IMR vs. other three algorithms, 4 vs. 3–4, 4 vs. 3–4, and 3–4 vs. 2–3) (Figs. 2, 3). However, there was no significant difference in subjective image quality scores for all pairs among the four groups, except in the comparison of FBP vs. IMR algorithms, according to Wilcoxon signed-rank tests following Friedman tests (p = 0.028, 0.002, and 0.001 for reader 1 and p = 0.021, 0.011, and 0.008 for reader 2, respectively). Meanwhile, according to only reader 2, the score for image sharpness was significantly lower for the low-dose CT with IMR and iDose4 algorithm than for FBP (p = 0.002 and p = 0.021, respectively), although there was no significant difference in the score for image sharpness between low-dose CT using the three reconstruction algorithms and non-low-dose CT images for reader 1.
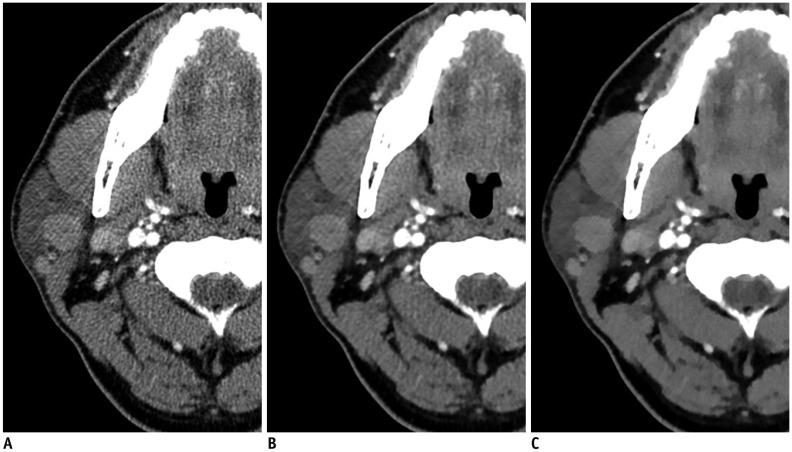 | Fig. 263-year-old woman with right parotid gland mass.Three axial image sets reconstructed using FBP (A), iDose4
(B), and IMR (C) algorithms. Compared with FBP- and iDose4-reconstructed images, significant decrease in streak artifacts related to dental amalgam was observed in parotid area with better conspicuity and definition of tumor margins in iterative model-reconstructed image. However, iterative model-reconstructed image showed relatively poor image sharpness, compared with FBP- and iDose4-reconstructed images. FBP = filtered back projection, iDose4 = hybrid iterative reconstruction, IMR = knowledge-based iterative model reconstruction
|
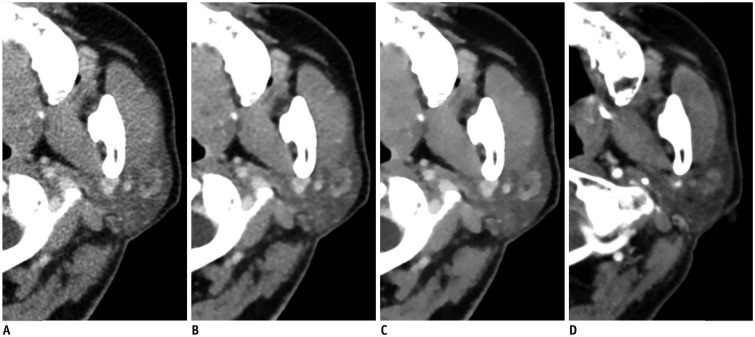 | Fig. 368-year-old man with left parotid gland mass.Four axial image sets of low-dose CT reconstructed using FBP (A), iDose4
(B), and knowledge-based IMR (C) algorithms and non-low-dose CT (D). Compared with FBP- and iDose4-reconstructed images as well as non-low-dose CT, there is significant decrease in noise associated with parotid region and significantly better contrast and characterization of tumor in iterative model-reconstructed image. Parotid tissue appears blotchy and pixelated in iterative model-reconstructed image.
|
Table 2
Results of Subjective Analyses of Reconstruction Techniques for CT in Evaluation of Parotid Gland Masses
*Values indicate median (range), †p < 0.05 indicates that there was/were pair/pairs showing significant difference for six pairs in four different data sets according to Friedman test, ‡p values indicate comparison results for six pairs in four different data sets according to Wilcoxon signed-rank tests following Friedman tests, §Values indicate kappa scores.
![]()
Interobserver agreements for the subjective image analyses were moderate to substantial for all parameters (overall image quality: κ = 0.46, delineation of the tumor contour: κ = 0.58, image sharpness: κ = 0.67, and artifact and noise: κ = 0.57).
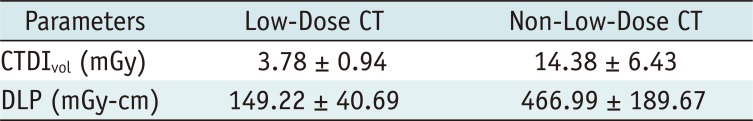
The average CTDIvol and DLP values with low-dose CT were 3.78 ± 0.94 mGy and 149.22 ± 40.69 mGy-cm, respectively. The average CTDIvol was 73.71% lower (3.78 mGy vs. 14.38 mGy) for low-dose CT than for non-low-dose CT with various scanners (Table 3).
Go to :
DISCUSSION
In the present study, we compared the image quality of low-dose CT with IMR and non-low-dose CT with conventional reconstruction in patients with parotid gland masses. Our results demonstrated that low-dose CT with knowledge-based IMR yielded comparable objective and subjective measures of image quality, compared with non-low-dose CT as well as other reconstruction algorithms, and this finding was consistent with the results of previous studies (4567).
Recently, several studies have reported the advantages of the IMR algorithm for CT evaluation of other body parts (1112). We decided to assess the utility of this technique for parotid gland imaging, which is susceptible to interference by streak artifacts derived from dental amalgam restorations that are frequently observed on CT images reconstructed with FBP algorithms (2). Furthermore, image contrast is another important parameter to determine the precise extent of the mass on CT, because the majority of parotid gland tumors are pleomorphic adenomas, which show poor contrast enhancement on CT images obtained 30 seconds after contrast administration and are difficult to detect against the background of parotid gland tissue (13).
Although the conventional FBP technique is the most widely used CT reconstruction algorithm because of fast and efficient reconstruction, it can result in image deterioration due to systemic geometric distortion and streak artifacts with insufficient data collection (14). With rapid advances in computer technologies, iterative reconstruction algorithms represent an innovation characterized by repeated modification processes with multiple iteration correction steps. This technique has dramatically improved the overall image quality through noise reduction and adequate resolution (315). IMR is the latest knowledge-based or model-based iterative reconstruction algorithm offered by Philips Healthcare. It optimizes the image reconstruction process by reflecting image and data statistics and systemic models. Therefore, the IMR algorithm requires a longer reconstruction time. However, we used the latest processors with greater computational capacity in the present study, which yielded an average reconstruction time of approximately 5 minutes only, which is acceptable for clinical use.
In the present study, we performed objective and subjective image analyses using several imaging parameters. Among the quantitative imaging parameters, CNR describes the extent to which differences in attenuation between two different regions increase above the pixel-to-pixel variations (16). Thus, CNR represents an excellent image quality parameter for the detection of low-contrast lesions. In the present study, CNR was significantly higher for low-dose CT with IMR algorithm compared with FBP reconstruction, and greatly aids the detection and characterization of parotid masses, considering that different tumors with different cell types and enhancement patterns develop in the parotid gland. In addition, we assessed artifacts and noise together, and found that low-dose CT with IMR resulted in significantly lesser overall noise and artifacts, compared with other reconstruction algorithms and non-low-dose CT, which was especially apparent with streak artifacts caused by dental amalgam restorations interfering with the evaluation of the parotid gland and Stensen duct.
While the average score of subjective imaging parameters for overall image quality and delineation of the parotid mass was significantly higher with IMR compared with FBP, probably due to significant noise reduction, image sharpness was worse in CT with the IMR algorithm, compared with FBP and non-low-dose CT in the present study. This result might be associated with distinct image features obtained using iterative reconstruction techniques, such as a unique plastic texture and a blotchy, pixelated appearance, as reported previously (17). Among the various image quality optimization methods applied for iterative reconstruction, the total variation minimization method has been widely used (18). However, it inevitably results in excessive smoothing of images because of its basic assumption. Therefore, a characteristic texture of CT images reconstructed using iterative reconstruction techniques may be observed in the form of oversmoothing in edge regions and a blotchy, pixelated appearance in nonedge regions (19), which might affect the image sharpness. Nevertheless, we believe that the unique image texture obtained with IMR might not affect or may only slightly affect the accurate diagnosis of parotid galnd masses with IMR in this study.
Previous phantom studies demonstrated that IMR enables a dose reduction of 60–80%, compared with FBP (20). In the present study, the mean DLP for CT performed at 100 kVp with the IMR algorithm was 149.22 ± 40.69 mGy-cm, and this was approximately 74% lower than the values obtained for CT performed at 120 kVp with the FBP algorithm at our institution. This result indicates that IMR undoubtedly offers further radiation dose reduction, compared with other reconstruction techniques, without severely compromising the image quality.
This study has several limitations. First, the image quality was analyzed on the basis of semiquantitative and qualitative parameters, and phantom experiments provide more accurate and comprehensive information about the image quality using various physical metrics, such as the modulation transfer function, section sensitivity profile, and noise power spectrum (2122). Second, although reviewers were blinded during subjective image analyses, they may be able to distinguish the four image sets because of the unique image texture obtained with IMR, resulting in assessment bias. Third, we failed to compare the diagnostic performance indicators (such as sensitivity and specificity) for the reconstruction algorithms because all patients carried parotid gland masses. Finally, only 42 patients were included in the study and non-low-dose CT was available only in 10 patients. Future studies with larger sample sizes determined by statistical power analysis are necessary to elucidate our findings.
In conclusion, despite unique plastic texture and blotchy pixelated appearance of images with IMR algorithm, CT evaluation with knowledge-based IMR is a feasible alternative to non-low-dose CT, without significantly affecting image quality in patients with parotid gland tumors.
Go to :
 XML Download