

 PDF
PDF ePub
ePub Citation
 Print
Print


INTRODUCTION
A wide range of splenic lesions may be encountered in clinical practice. Although most of the incidentally detected splenic lesions are benign (12), differential diagnosis of benign and malignant lesions is still a radiological challenge due to overlapping imaging features (345). According to previous reports, truly incidental splenic lesions in trauma patients were indeed mostly benign (67). However, since most of the patients with splenic lesions who undergo abdominal CT scans manifest various types of underlying disease including malignancy, it is essential to provide reasonable differential diagnosis for appropriate management. In addition, ultrasound-guided splenic biopsy may not always be an option because of the risk of bleeding or poor sonic window (8). Further, cost-effectiveness should be considered before suggesting additional imaging studies such as magnetic resonance (MR) imaging or positron emission tomography (PET). Therefore, optimal management plan requires the maximum possible information based on the CT scans and patient's medical records.
Several studies have investigated radiological findings of splenic lesions. A few studies focused on specific pathologies such as splenic cysts, hematologic malignancies or vascular tumors (9101112). Others assessed the value of supplemental MR imaging or PET/CT examination for the evaluation of splenic lesions (4131415). Several studies have also discussed the role of CT findings of the spleen to establish guidelines for interpretation and management (116). However, to our knowledge, no study has comprehensively reviewed both clinical and imaging findings with proven pathological diagnosis of focal splenic lesions. Therefore, the purpose of this study was to assess key CT findings and clinical features to differentiate malignant from benign focal splenic lesions in patients with pathologically confirmed focal splenic lesion.
Go to : 
MATERIALS AND METHODS
Study Population
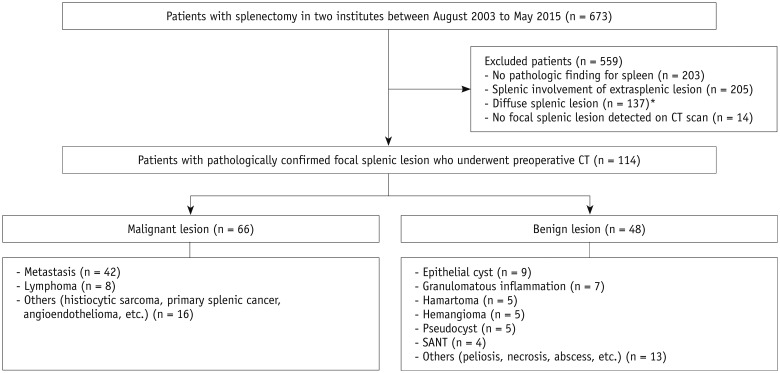
This retrospective study was approved by the Institutional Review Boards of Seoul National University Hospital (IRB No. 1604-144-758) and National Cancer Center (NCC2016-0116), and the requirement for informed consent was waived. We reviewed medical, pathology, and radiology databases of two tertiary referral hospitals from August 2003 to May 2015 and found 673 patients who had undergone total splenectomy. We excluded 1) patients who did not have any pathological findings for spleen (n = 203); 2) patients whose splenic pathology was attributed to a direct extension of extrasplenic lesion (n = 205); 3) patients who had diffuse splenic lesion such as idiopathic thrombocytopenic purpura, hemolytic anemia, or hereditary spherocytosis (n = 137); and 4) patients who did not have any focal splenic lesion detected on CT scan (n = 14). Finally, a total of 114 patients who had pathologically proven focal splenic lesions detected on preoperative CT were included in the final cohort (male:female = 44:70; age range, 12–79 years; mean age, 51.8 years). CT scans were obtained at a mean of 38 days (range, 1–384 days) prior to surgery. Figure 1 shows the flowchart of this study population.
CT Examination
Various types of multidetector computed tomography scanners with 8–320 channels were used to screen patients in the two hospital databases. Commonly used multidetector CT scanners include: an 8-channel scanner (LightSpeed Ultra, GE Healthcare, Milwaukee, WI, USA, [n = 7]), a 16-channel scanner (Sensation 16, Siemens, Forchheim, Germany, [n = 18]; LightSpeed Pro 16, GE Healthcare, [n = 13]; Mx8000, Philips Medical Systems, Best, the Netherlands, [n = 7]), 64-channel and 320-channel scanners (Brilliance 64, Philips Medical Systems, [n = 22]; LightSpeed VCT, GE Healthcare, [n = 14]; Aquilion, Toshiba Medical Systems, Otawara, Japan, [n = 7]). Table 1 summarizes the CT parameters of popular CT scanners. All of the CT images included portal venous phase, which was used to evaluate splenic lesions. The portal venous scans were acquired at fixed delays (70–80 seconds) after the administration of 1.5–2.0 mL per kilogram of body weight of nonionic contrast material at a rate of 2.0–3.5 mL/sec with a pump (Multilevel CT; Medrad, Indianola, PA, USA) via an 18-gauge catheter placed in a peripheral vein.
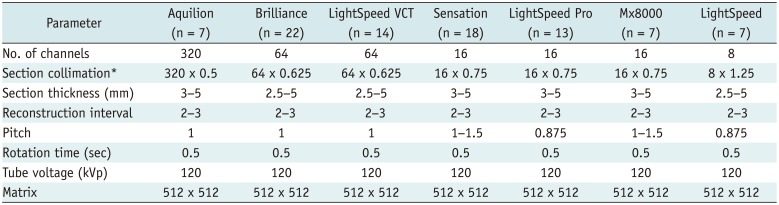
Table 1
Summary of CT Parameters of according to CT Scanners
![]()
CT Image Analysis
Two radiologists, each with seven and five years of experience in abdominal radiology, reviewed the CT images. The radiologists were aware of patient's clinical information including underlying history of malignancy, and were blinded to histopathological results. Initially, the following CT findings were independently determined by each reviewer: size of the spleen and size of the focal lesion, number of lesions, distinct margin (well-defined vs. ill-defined), nature of the mass (mainly solid vs. mainly cystic), presence of the wall, calcification, enhancement pattern (none vs. homogeneous vs. heterogeneous), and lymph node (LN) enlargement. Splenomegaly was defined as the longest splenic length exceeding 12 cm. Maximal diameter of the largest focal lesion was measured in two dimensions on axial images. The lesions were categorized into single, multiple (defined as two or more focal nodular lesions regardless of their size), and miliary (defined as wide dissemination of subcentimeter nodular lesions). The margin was regarded as well-defined if the focal lesion was sharply demarcated with an abrupt transition between the lesion and surrounding tissue. In order to fulfill the criteria, at least 75% of the margin must be distinct. Focal lesions were divided into mainly solid and cystic groups, based on 50% of the lesion volume as the standard. When assessing the nature of the focal lesion, we considered the proportion of solid and cystic portions in each axial image. When assessing LN enlargement, the short-axis diameter was measured and the cut-off value was 10 mm. For statistical analysis, another radiologist with 17 years of experience combined the two data sets and decided the results for further analysis after reviewing images. At the end of CT image analysis, each reviewer graded the possibility of malignancy on a 5-point scale. Reviewers were blinded to histopathological results, and scoring was based on their clinical experience and the patient's clinical information including underlying history of malignancy. Score 1 indicated definitely benign; score 2, probably benign; score 3, indeterminate; score 4, probably malignant; and score 5, definitely malignant. The diagnostic criteria for malignant splenic lesions were based on previous reports (5811151718), i.e., if a mass showed multiple, ill-defined, solid, hypovascular, heterogeneous or progressive enhancement patterns with LN enlargement and underlying history of malignancy, it was assigned a score of 5. If a splenic lesion showed only some of the features described above with underlying history of malignancy, it was scored 4. If a splenic lesion only showed some of the features including single, well-defined, mainly cystic, none or homogeneous contrast-enhancement patterns without underlying history of malignancy, it was rated 1 or 2, according to the subjective judgment. In addition to CT images, patient's underlying history of malignancy, presence of fever (axillary or otic temperature ≥ 37.2℃, or oral temperature ≥ 37.7℃), and white blood cell count was determined according to the electronic medical records. Leukocytosis was diagnosed by white blood cell counts greater than 11000/mm3.
Statistical Analysis
Each of the different CT findings involving benign and malignant focal splenic lesions was compared using multivariate logistic regression analysis, followed by a series of univariate analyses to identify significant predictors of malignant focal splenic lesions. First, univariate analysis was performed with each clinical feature and CT finding, and only variables with p values < 0.05 were selected as input variables for multivariate analysis. Interobserver agreement was calculated using interobserver correlation coefficient, kappa and weighted Cohen's kappa statistics. Kappa values ≤ 0.40 indicated poor agreement; 0.41–0.60, moderate agreement; 0.61–0.80, substantial agreement; and ≥ 0.80, almost perfect agreement. Diagnostic performance was analyzed by these two reviewers using receiver operating characteristic analysis. All statistical analyses were performed using commercially available software (SPSS 21 for Windows; IBM Corp., Armonk, NY, USA). A p value of less than 0.05 indicated significant difference.
Go to :
RESULTS
Of the 114 patients evaluated, 48 showed benign lesions including epithelial cysts (n = 9), granulomatous inflammation (n = 7), hamartomas (n = 5), hemangiomas (n = 5), pseudocysts (n = 5), sclerosing angiomatoid nodular transformation (n = 4), and others such as necrosis or abscess (n = 13). By contrast, 66 malignant lesions included splenic metastasis (n = 42), direct involvement of intraperitoneal seeding (n = 11), lymphoma (n = 8) and other types of malignancies (n = 5) including histiocytic sarcoma (n = 2), primary splenic cancer (n = 1), follicular dendritic cell tumor (n = 1), and angioendothelioma (n = 1).
Clinical Features of Benign and Malignant Focal Splenic Lesions
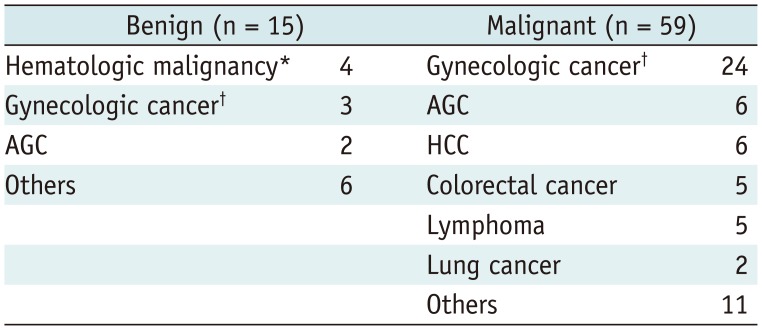
Among the 114 patients, 74 patients (64.9%) had underlying malignant disease. Presence of underlying malignancy was significantly more common in patients with malignant focal splenic lesions (p < 0.05). Underlying malignancy was detected in 59 patients (89.4%) carrying 66 malignant focal splenic lesions compared with only 15 patients (31.3%) harboring 48 benign focal splenic lesions. Table 2 summarizes underlying malignancy for patients with benign or malignant focal splenic lesions. Patient's age was a significant factor in differentiating benign from malignant splenic lesions (p = 0.001). However, sex, presence of fever or leukocytosis were not significant factors distinguishing benign from malignant splenic lesions (p = 0.416, p = 0.489, and p = 0.308, respectively).
CT Findings of Benign and Malignant Focal Splenic Lesions
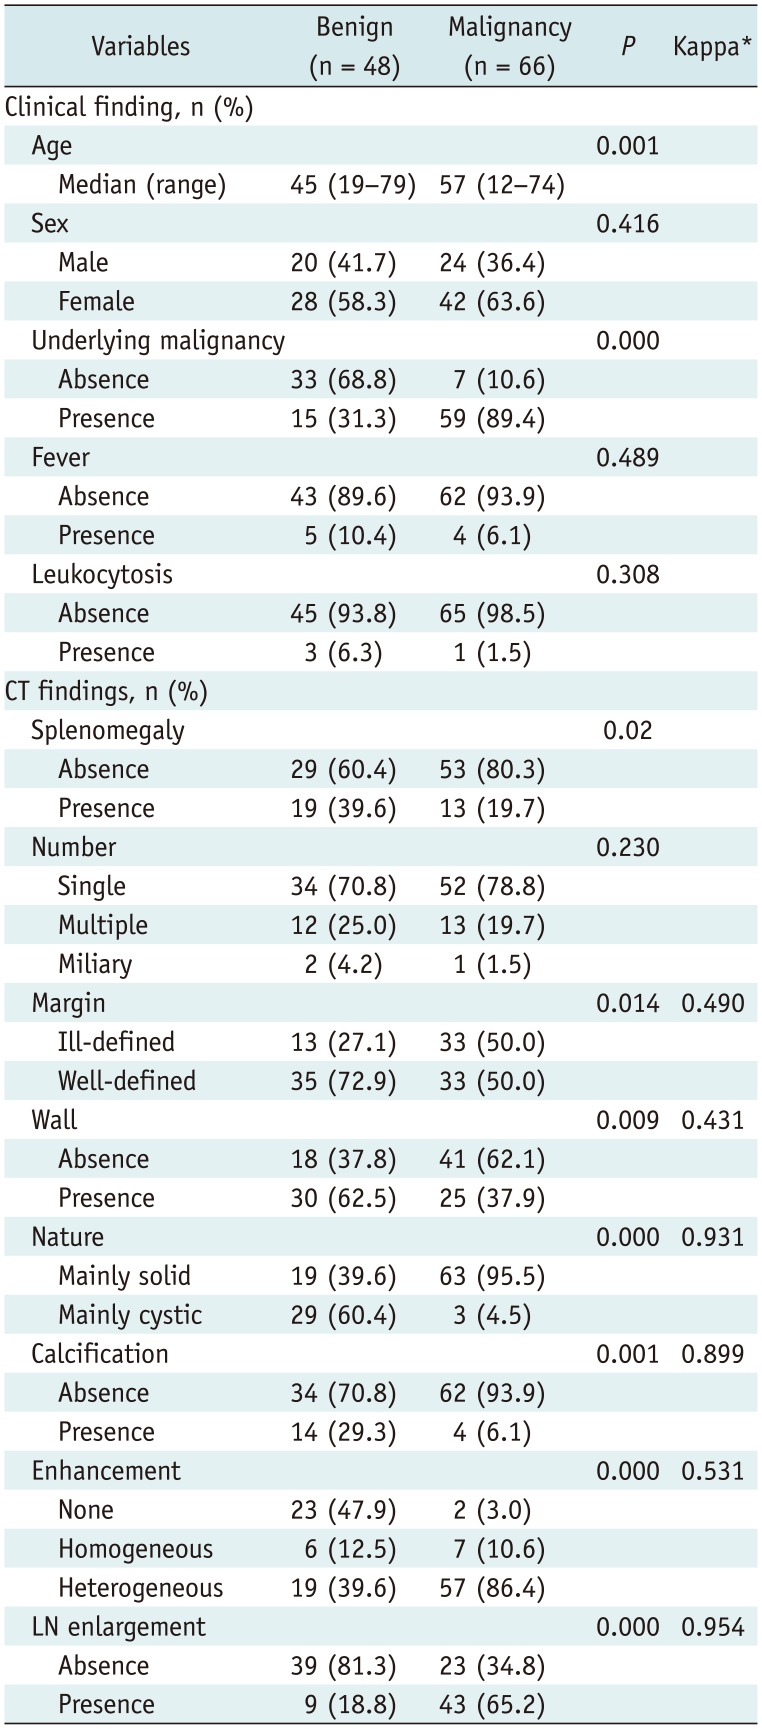
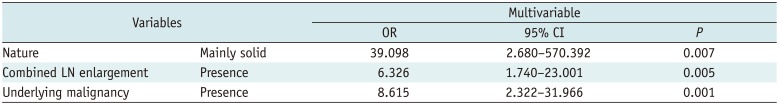
Table 3 summarizes clinical and CT findings of benign and malignant focal splenic lesions. Common imaging findings diagnostic of malignant splenic lesions compared with benign lesions were absence of splenomegaly (80.3% vs. 60.4%, p = 0.02), ill-defined margin (50.0% vs. 27.1%, p = 0.014), absence of wall (62.1% vs. 37.8%, p = 0.009), mainly solid nature (95.5% vs. 39.6%, p = 0.000), absence of calcification (93.9% vs. 70.8%, p = 0.001), presence of contrast enhancement (97.0% vs. 52.1%, p = 0.001) (Fig. 2), and LN enlargement (65.2% vs. 18.8%, p = 0.000). Interobserver correlation coefficient for the length measurement was 0.957 (p < 0.001) for the spleen size and 0.992 (p < 0.001) for the lesion diameter. Kappa values for each CT imaging feature ranged from 0.431 to 0.954, suggesting moderate to very good agreement. Multivariate analysis using p < 0.25 revealed mainly solid nature (odds ratio [OR], 39.098, p = 0.007) (Fig. 3), LN enlargement (OR, 6.326, p = 0.005), and presence of underlying malignancy (OR, 8.615, p = 0.001) as significant predictors for malignant focal splenic lesions. Table 4 summarizes important features predicting malignant focal splenic lesions.
 | Fig. 230-year-old female patient with epithelial cyst.She had incidental splenic lesion detected during routine examination. A, B. Axial and coronal contrast-enhanced CT images show 6.3 cm well-defined cystic mass (arrows) with surrounding wall and multifocal calcifications. Splenic size was 9.5 cm, and patient had no fever or leukocytosis. C. Surgical specimen shows smooth inner surface of epithelial cyst (arrows).
|
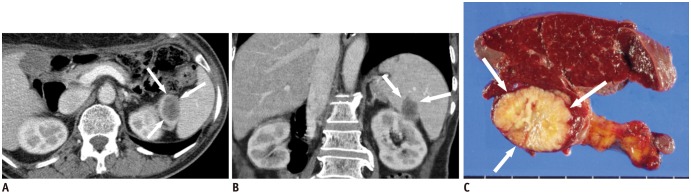 | Fig. 366-year-old female patient with splenic metastasis.She had history of subtotal gastrectomy due to advanced gastric cancer. A, B. Axial and coronal contrast-enhanced CT images show 2.9 cm ill-defined solid mass (arrows) with heterogeneous enhancement. There was no wall or calcification. Splenic size was 9.1 cm, and patient did not have fever or leukocytosis. C. Surgical specimen shows yellowish solid mass (arrows) in spleen.
|
Table 3
Comparison of Clinical and CT Finding of Benign and Malignant Focal Splenic Lesions
![]()
Benign focal splenic lesions were significantly larger than malignant focal splenic lesions (p = 0.004). The mean size of benign focal splenic lesions was 5.8 ± 3.3 cm. Conversely, the mean size of malignant focal splenic lesions was 4.0 ± 3.4 cm. A threshold of 4.25 cm yielded a sensitivity of 66.7% and specificity of 72.7% in distinguishing benign and malignant lesions.
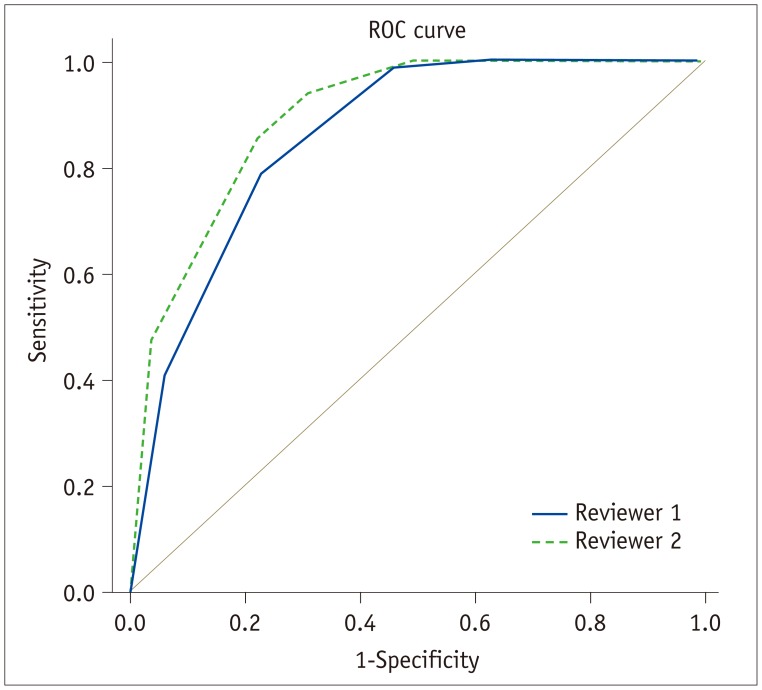
Diagnostic performance for differentiation of malignant focal splenic lesions were 0.856 by reviewer 1 and 0.893 by reviewer 2 (Fig. 4) with no significant difference between the two reviewers (p > 0.05). Interobserver agreement in the evaluation of the splenic focal lesions was substantial, based on a 5-point scale (weighted κ = 0.541–0.727).
Go to :
DISCUSSION
In our study, based on the CT features, the diagnostic performances of two observers for differentiation of malignant focal splenic lesions were 0.856 and 0.893. The common CT findings for the malignant splenic lesions were absence of splenomegaly, ill-defined margin, absence of wall, mainly solid nature, absence of calcification, and presence of contrast enhancement. Based on the clinical and CT features, the presence of underlying malignancy (OR, 15.017, p = 0.001) and mainly solid nature (OR, 7.428, p = 0.005) were two important features suggesting malignant splenic lesions.
According to previous reports, history of underlying malignancy and several image findings were useful for differentiation of malignant splenic lesions. Pugalenthi et al. (19) reported that up to 90% of the patients with malignant splenic lesions had a previous history of cancer, among patients who underwent a splenectomy. Another study suggested that hypodense, ill-defined, and contrast-enhancing lesions on contrast-enhanced CT images in patients with known malignancies need to be regarded as splenic metastases until proven otherwise (17). Even though most of the multiple metastases suggest widespread disease before splenic involvement, a CT finding of multiple splenic masses was the sole manifestation of metastatic disease in 5% of cancer patients (20). Therefore, it is necessary to carefully review not only CT findings, but also the underlying malignancy in cases of splenic lesions. Our study results are consistent with previous studies, which demonstrated the importance of underlying malignancy when evaluating splenic lesions.
In our study, focal splenic lesions with solid portions constituting more than 50% of lesion volume were more likely to be malignant, which was consistent with previous studies. Warshauer and Hall (18) divided solitary splenic lesions into two groups: predominantly cystic and predominantly solid. The predominantly solid lesions encompassed diverse pathologies, including malignant tumors. Malignant lesions also manifest as single or multiple cystic masses (21). However, most splenic cystic lesions are non-neoplastic lesions such as congenital cysts, post-traumatic pseudocysts, pancreatic pseudocyst and parasitic cysts (22).
In our study, the mean size of benign splenic lesions (5.8 ± 3.3 cm) was larger than that of malignant splenic lesions (4.0 ± 3.4 cm). Although there is a paucity of literature regarding size criteria of focal splenic lesions, larger diameters usually represent aggressive nature. Heller et al. (1) suggests that in a patient with a history of primary neoplasm with a tendency to metastasize to the spleen, an incidentally discovered splenic lesion > 1 cm should be suspected as a metastasis. However, because our study included patients who had undergone total splenectomy, only benign lesions which were large enough to be symptomatic were resected, thus increasing the average diameter of benign splenic lesions. Further, a number of patients with underlying malignancy undergo routine follow-up CT imaging, which resulted in early detection of splenic metastasis before it was enlarged.
Our study has several limitations. First, CT scanners and examination protocols were not uniform. Although we standardized the scan phase to portal venous phase, differences between scanners and protocols remained. Second, we only included patients who had undergone total splenectomy. In fact, a few patients with splenic masses do not undergo surgical resection if imaging findings strongly suggest benign cystic lesions (23). Similarly, patients who have known malignancy do not necessarily undergo splenectomy if splenic lesions are likely to be metastases. In addition, traumatic injuries, vascular disorders, or inflammatory diseases, which do not mainly depend on surgical treatment, were not evaluated. Third, only focal splenic lesions were assessed, thus excluding diseases with diffuse splenic involvement or with isolated splenomegaly. In our study, frequencies of primary malignancies varied from previously reported data, with only a small number of lymphoma patients (n = 5). Lymphoma is the most common splenic malignancy, and the most common finding of splenic involvement in lymphoma is homogeneous enlargement (24). Since we only included focal splenic lesions in the study population, many cases of lymphomas, which only presented as splenomegaly may have been excluded from the beginning. It is also unusual that gynecologic cancers are the single most common type of primary malignancy for splenic metastasis. Previous studies reported that common primary sources of splenic metastasis are breast, lung, colorectal, and ovarian carcinomas and melanomas in cases of multivisceral cancer, and colorectal and ovarian carcinomas in cases of solitary splenic lesion (25). This discrepancy may be due to different surgical indications for splenectomy among institutions. Fourth, only CT images were evaluated as the single imaging modality. MRI, fluorodeoxyglucose PET or microbubble-enhanced sonography facilitate improved characterization of splenic lesions (1326).
In conclusion, CT findings and clinical features are useful to differentiate benign from malignant splenic lesions, which are characterized by mainly solid nature of the splenic mass and presence of underlying malignancy. Our results can be used to predict malignancy of the focal splenic lesions detected on CT and facilitate further management and surgical planning.
Go to :
 XML Download