

 PDF
PDF ePub
ePub Citation
 Print
Print


INTRODUCTION
Fatty liver is defined as the accumulation of liver triglycerides exceeding more than 5% of the liver weight (1). Fatty liver without a history of alcohol intake is known as non-alcoholic fatty liver disease (NAFLD). NAFLD is a common chronic liver disease in the world (2). NAFLD is clinically defined as a transition from simple liver steatosis to non-alcoholic hepatitis, which may in turn develop into non-alcoholic hepatic cirrhosis and even hepatocellular carcinoma (3). Therefore, diagnostic screening for simple liver steatosis is important clinically. Studies indicated that NAFLD was more prevalent in obese population, and was related to type 2 diabetes, dyslipidemia and hypertension (4). A few studies considered NAFLD as a manifestation of metabolic syndrome in the liver (5). Meanwhile, a few studies reported a close relationship between abdominal obesity and risk factors for these metabolic diseases (6). In abdominal obesity, abdominal visceral adipose tissue was more closely related to metabolic risk factors compared with subcutaneous adipose tissue (6). However, recent studies explored the effects of these risk factors on liver in patients with morbid obesity or in those who had been diagnosed with metabolic syndrome (7). A few epidemiological studies have shown that NAFLD occurred even in non-obese patients with non-metabolic syndrome (89). In China, Xu et al. (10) investigated large samples of non-obese populations and showed that NAFLD was also prevalent in China's non-obese population, and the prevalence ratio was increased in the 5-year follow-up. However, there was no study related to body fat composition and NAFLD measured by CT in non-obese population. The purpose of this study was to investigate the correlation between NAFLD and abdominal fat in non-obese Chinese adults by computed tomography (CT).
MATERIALS AND METHODS
Subjects
This study was approved by our hospital ethics committee, and all participants had signed informed consent before participating in the study.
The subjects included in this study were participants of an ongoing study since June 2014 investigating degeneration of the spine in the Department of Orthopedics, Beijing Jishuitan Hospital. A routine CT scan of lumbar spine was performed. The present study analyzed existing data of the lumbar spine. The images of liver and spleen were reconstructed with a large field of view (FOV), and no radiation was involved. Participants' age, place of origin and past medical history were determined by a questionnaire survey. Indices such as height, weight, waist circumference and hip circumference with barefoot and underwear were measured in all the participants. Patients diagnosed with diabetes or Cushing's syndrome, patients who were treated with large doses of steroids or addicted to heavy drinking, diagnosed with hepatitis, history of cirrhosis or liver surgery, and obesity with a body mass index (BMI) ≥ 30 kg/m2 were further excluded. Finally, 454 (164 men and 290 women) participants were included, with an age range of 19–63 years and an average age of 38 years.
CT Scan
Images were obtained for all the subjects using an 80-slice CT scanner (Toshiba Medical Systems Corp., Tokyo, Japan) with a calibration phantom (Mindways Software Inc., Austin, TX, USA) beneath the waist. Routine calibration was performed before quantitative computed tomography (QCT) measurement. The scan parameters were as follows: 120 kV, 250 mA, 40 cm FOV, 120 cm bed height, 1 mm slice thickness, and 512 × 512 matrix. All subjects were scanned in the supine position with both the arms stretched above the head. The images of liver and spleen were reconstructed with large FOV.
CT Attenuation Measurement
Liver and spleen measurements were performed using a CT post-processing workstation, and only one image (level of portal vein into the liver) of each patient was selected to complete the attenuation measurement of liver and spleen. Three regions of interest in the liver were selected to avoid blood vessels, bile ducts and calcification; and 2 regions of interest in the spleen were selected at the same level. Finally, the respective means of the 3 attenuation values of the liver and 2 attenuation values of the spleen were calculated (Fig. 1). The following 3 indices were selected to determine hepatic fat infiltration: 1) The attenuation value of liver parenchyma (CTLP); 2) The attenuation ratio of liver and spleen (LSratio); 3) The attenuation difference between liver and spleen (LSdif). Fatty liver was diagnosed by traditional standards: Attenuation value of liver parenchyma (CTLP) less than 48 HU, or attenuation ratio of liver and spleen (LSratio) less than 1.0, or attenuation difference of liver and spleen (LSdif) less than 5 HU, indicate a diagnosis of fatty liver (111213).
CT Measurement of Abdominal Fat
The acquired scan data were transferred to QCT bone density measurement analysis (QCT PRO) workstation (Mindways Software Inc.). Fat areas were measured using the body fat analysis software of the QCT bone density measurement. Using the intervertebral space as an anatomic mark, the following anatomical areas were used for CT measurement: 1) the horizontal level of L2/3; 2) the horizontal level of L4/5 (Fig. 2). Visceral fat area (VFA) and total fat area (TFA) at each level were obtained, respectively, and the subcutaneous fat area (SFA) was calculated using the following equation: SFA = TFA − VFA. All measurements were performed by an experienced radiologist. Previous studies have shown that this method showed good repeatability (14).
Statistical Analysis
SPSS 20.0 software (IBM Corp., Armonk, NY, USA) was used for statistical analysis. Normal distribution data were expressed by mean ± standard deviation. Independent sample t test was used to compare the differences between VFA, TFA and SFA in the fatty and non-fatty liver groups and the differences were analyzed. Bivariate correlation analysis (Pearson's correlations analysis) was used to analyze the correlation between the three indices (CTLP, LSratio, LSdif) and VFA, TFA, SFA at L2/3 and L4/5 levels. P < 0.05 was considered statistically significant.
RESULTS
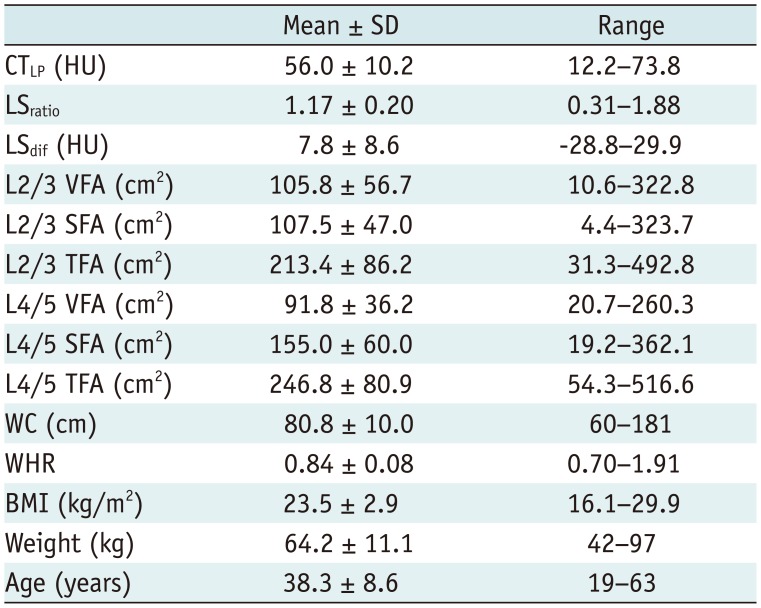
The mean CTLP, LSratio and LSdif were 56.0 ± 10.2 HU (ranging from 12.2 HU to 73.8 HU), 1.17 ± 0.20 (ranging from 0.31 to 1.88), 7.8 ± 8.6 HU (ranging from −28.8 HU to 29.9 HU), respectively. The mean VFA, SFA and TFA values at L2/3 levels were 105.8 ± 56.7 cm2 (ranging from 10.6 cm2 to 322.8 cm2), 107.5 ± 47.0 cm2 (ranging from 4.4 cm2 to 323.7 cm2), and 213.4 ± 86.2 cm2 (ranging from 31.3 cm2 to 492.8 cm2), respectively. The mean VFA, SFA and TFA values at L4/5 levels were 91.8 ± 36.2 cm2 (ranging from 20.7 cm2 to 260.3 cm2), 155.0 ± 60.0 cm2 (ranging from 19.2 cm2 to 362.1 cm2), and 246.8 ± 80.9 cm2 (ranging from 54.3 cm2 to 516.6 cm2), respectively. The mean BMI, waist circumference, waist-hip ratio, weight and age were 23.5 ± 2.9 kg/m2 (ranging from 16.1 kg/m2 to 29.9 kg/m2), 80.8 ± 10.0 cm (ranging from 60 cm to 181 cm), 0.84 ± 0.08 (ranging from 0.70 to 1.91), 64.2 ± 11.1 kg (ranging from 42 kg to 97 kg), and 38.3 ± 8.6 years (ranging from 19 years to 63 years), respectively (Table 1).
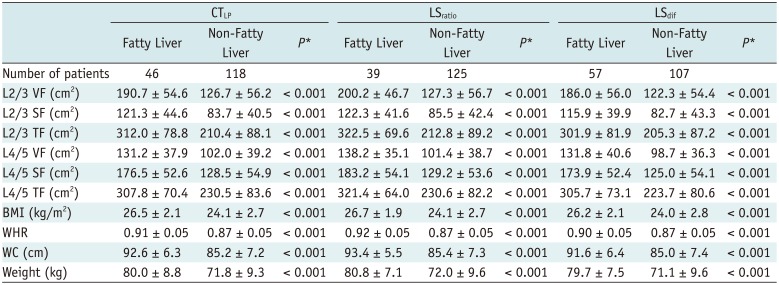
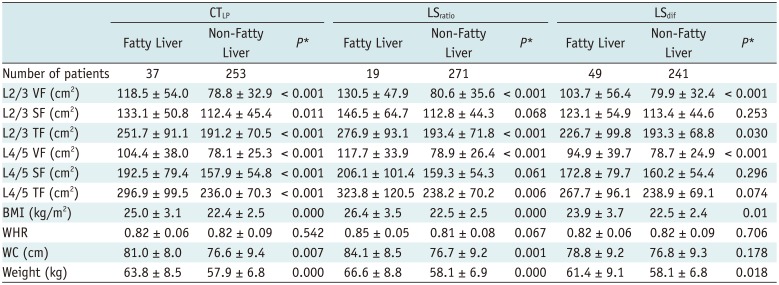
The case numbers of fatty liver disease diagnosed in terms of the three indices in male and female groups are shown in Tables 2 and 3. The differences in VFA, SFA and TFA between fatty and non-fatty liver groups were evaluated according to the three indices, and the statistical results are presented in Tables 2 and 3. In men, significant differences were observed between VFA, SFA and TFA at L2/3 and L4/5 levels when using the three indices to distinguish between the fatty and non-fatty liver groups (all, p < 0.001) (Table 2). In women, significant differences between VFA, SFA and TFA at L2/3 and L4/5 levels were observed using CTLP to distinguish between the fatty and non-fatty liver groups (p = 0.011 in SFA at L2/3 and p < 0.001 in others). However, there was no significant difference in SFA between the two groups at different levels when using LSratio and LSdif to evaluate fatty liver (Table 3).
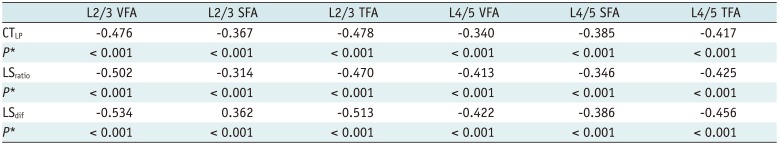
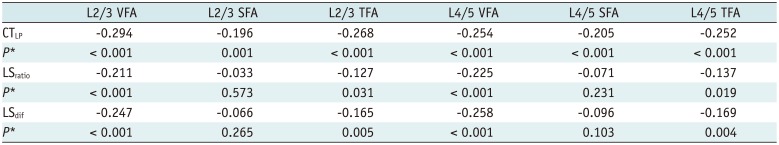
In men, CTLP, LSratio and LSdif demonstrated negative correlation with TFA, SFA and VFA at L2/3 and L4/5 levels, respectively (all, p < 0.001) (Table 4). The negative correlation of LSratio and LSdif with VFA at L2/3 and L4/5 levels was higher than SFA at the corresponding level. The three indices were negatively correlated with VFA, and the negative correlations at L2/3 level were all higher than at L4/5 level (r = −0.476 vs. r = −0.340 for CTLP, r = −0.502 vs. r = −0.413 for LSratio, r = −0.543 vs. r = −0.422 for LSdif, p < 0.001, respectively) (Table 4). In women, CTLP, LSratio and LSdif showed negative correlation with VFA and TFA at L2/3 and L4/5 levels, respectively (p = 0.004 in TFA at L4/5 and p ≤ 0.001 in others). Neither LSratio nor LSdif demonstrated any correlation with SFA at L2/3 or L4/5 levels. The negative correlation between CTLP and VFA at L2/3 level was higher than at L4/5 level (r = −0.294 vs. r = −0.254, p < 0.001). Overall, the negative correlation between CTLP and VFA at L2/3 level was significant (r = −0.294, p < 0.001) (Table 5).
DISCUSSION
Non-alcoholic fatty liver disease is one of the most common chronic liver diseases worldwide, and obesity is an important cause underlying NAFLD. BMI has a direct correlation with NAFLD (15). Although BMI can be used as an independent predictor of NAFLD, a few studies showed that the body fat composition reflected health better than BMI and body weight (1516). Omagari et al. (17) investigated 3432 Japanese adults and found that 27.2% males and 59.2% females who had no history of alcohol intake were diagnosed with fatty liver, even though they were not overweight. This finding suggested unreliability of BMI as the sole indicator for determination of fatty liver. Further, the study indicated that central body fat distribution correlated with the development of fatty liver. Similar studies also showed that the central body fat distribution in obese individuals was more closely related to diabetes, dyslipidemia, hypertension and other cardiovascular diseases, compared with gluteo-femoral body fat distribution in obese patients (18). In obesity characterized by central body fat distribution, excessive accumulation of visceral fat was more closely related to metabolic syndrome, compared with subcutaneous fat (18). Although studies pointed to waist circumference as a predictor of central body fat distribution in obese patients (19), the index failed to distinguish between visceral and subcutaneous fat and resulted in errors in the evaluation of visceral fat.
Currently, histological examination is considered as the gold standard for fatty liver diagnosis, even though in vivo biopsy is an invasive tool with obvious deficiencies (20). Alternative imaging modalities have been used for liver examination (2122). CT scan has the ability to diagnose and quantify the degree of liver fat infiltration (23). CT scan is an effective and practical modality that clearly distinguishes between visceral fat and subcutaneous fat, and also facilitates direct quantification with simple, highly repeatable and accurate results. Previous studies demonstrated that CT scan facilitated the determination of the degree of hepatic fat infiltration and obviated the need for unnecessary biopsy; it also has been used to quantify visceral fat adequately (2324). Hence, CT represents an important technique for clinical investigation of the correlation between fatty liver and visceral fat.
In this study, three CT indices were used to evaluate fatty liver. Significant differences in VFA among males and females in the fatty and non-fatty liver groups were found. There was no significant difference in female SFA between the two groups. In both men and women, the correlation between the three indices of the degree of hepatic fatty infiltration and VFA was higher compared with SFA. Studies involving morbidly obese patients or those diagnosed with metabolic syndrome showed that abnormal visceral fat accumulation was a risk factor for fatty liver (7). These results were consistent with our study investigating non-obese Chinese adults, probably due to the endocrine function of adipose tissue, and the role of metabolites of abdominal subcutaneous tissue in body circulation, while visceral fat secretions were discharged into the portal system. Free fatty acids were produced by excessive metabolization of visceral fat, shunted into the liver via portal circulation, synthesized into fat, and deposited in the liver, resulting in the formation of fatty liver (25).
Instead of total visceral fat volume, VFA in a single image was measured by CT in this study. This method has been widely accepted, but the level still remains disputed (2426272829). Researchers recommend the use of CT for VFA at a single image to replace the total visceral fat volume (24), and the level of the umbilicus (L4/5) was mostly selected (2627). Other studies indicated that VFA at L2/3 level better predicted the visceral total fat (2829). We selected L2/3 and L4/5 (umbilicus) levels and measured in this study. Results showed negative correlations between the three indices and VFA at L2/3 level, which were higher than at L4/5 level in males. By contrast, a negative correlation between CTLP and VFA at L2/3 level was higher than at L4/5 level in females, which was consistent with the study of Han et al. (28) and Demerath et al. (29). A few studies suggested that (30) visceral fat was more likely to accumulate in the upper abdominal region at the L1/2 to L3/4 levels, due to the presence of highly active visceral adipocytes in the omentum and mesentery than in the retroperitoneal adipocytes. This accumulation of visceral fat might increase the plasma adiponectin level and release additional inflammatory factors, triggering a series of metabolic diseases, such as insulin resistance, inflammation and NAFLD (30). Compared with the lower abdomen, the upper abdomen was more closely related to total visceral fat (30), and this interpretation was consistent with our study results. Waist circumference was measured at the level of umbilicus (L4/5) clinically. The study results showed that the measurement of waist circumference at L2/3 level facilitates clinical evaluation of visceral fat.
Our study has several important strengths. The correlation between NAFLD and visceral adipose tissue in non-obese Chinese adults was analyzed using a large sample of CT data, and abdominal fat at two levels of L2/3 and L4/5 was measured concurrently. We found that abdominal fat strongly correlated with hepatic steatosis in non-obese adults and L2/3 was better than L4/5 for fat measurement.
However, our study also has several limitations: First, CT was used to diagnose and evaluate fatty liver in this study, without including pathological diagnosis, making it difficult to distinguish between simple hepatic steatosis and NAFLD hepatitis. The three indices of CT were used to judge liver fat infiltration, and the best index among the three warrants additional study in the future. Further, this study failed to consider hemochromatosis or other diseases in patients, which were related to hepatic iron deposition. These diseases increase the CT attenuation value of the liver, resulting in missed diagnosis of fatty liver.
In summary, in non-obese Chinese adults, the degree of liver fatty infiltration showed a strong correlation with abdominal fat, and the association of VFA with fatty liver was stronger than SFA. VFA at L2/3 level was more closely related to fatty liver compared with VFA at L4/5 level.


 XML Download