

 PDF
PDF ePub
ePub Citation
 Print
Print


INTRODUCTION
Obesity is associated with a higher incidence and prevalence of asthma.123 Moreover, obesity increases asthma severity and impairs patients' response to management.456 High body mass index (BMI) or waist circumference have been established as risk factors for asthma in adults.37 Abdominal obesity may be related to asthma via multifactorial mechanisms including mechanical alterations in the airways and lung parenchyma, systemic and airway inflammation and metabolic dysregulation, adversely influencing lung function and/or response to therapy.358 Adipokines such as leptin and adiponectin were proposed to affect airway inflammation of asthma9 through their systemic effects. However, human studies on the adipokines and asthma did not show consistent results.1 In addition, although research on the effect of weight reduction in severe asthmatics mostly reported improved asthma control and airway parameters which could be improved by reduction in both mechanical alteration and systemic inflammation, its effects on airway inflammation and airway hyperresponsiveness were not obvious in some studies.1011 This raised the possibility that some characteristics of adipose tissues such as distribution within human body would influence the way adipose tissue affect asthma. With recent advances in multi-detector computed tomography (CT), imaging-based quantification of abdominal fat allows the separate measurement of subcutaneous and visceral fat area, providing visceral to subcutaneous fat area ratio (V/S).1213 The fat distribution analysis has been widely performed to show the association of obesity with metabolic syndrome or cardiovascular diseases.1415 Moreover, CT enables the exact measurement of airway and pulmonary parenchyma such as bronchial lumen diameter (LD) or wall thickness (WT), emphysema and air-trapping in asthmatic patients.161718 However, to our knowledge, no studies have yet performed simultaneous CT assessment of the airways, lung parenchyma and abdominal fat area to demonstrate the association between asthma and obesity.
In this study, we aimed to investigate whether airway parameters, emphysema or air trapping are associated with abdominal fat areas or certain types of adipose tissue, measured via CT or BMI, and to compare the clinical characteristics of asthmatic patients with and without elevated V/S (EV).
Go to : 
MATERIALS AND METHODS
Study population
From December 2014 to August 2016, patients of all weight status diagnosed with asthma, aged ≥40 years, who visited the outpatient asthma clinic at our hospital, were prospectively enrolled in the study. Asthma was diagnosed when a patient had more than 1 asthma symptom, including dyspnea, wheezing, chest tightness, and/or cough, and objective evidence of variable airway obstruction and/or hyper-responsiveness. Variable airway obstruction was defined as a 12% (200 mL from baseline) increase in forced expiratory volume in 1 second (FEV1) after bronchodilator use or 4-weeks of treatment with anti-inflammatory agents. Airway hyper-responsiveness was tested by the methacholine bronchial provocation test, using standard methods.19 Patients who refused to participate in this study, had any other pulmonary diseases, and/or whose CT datasets contained any post-processing failure were excluded.
Clinical characteristics
We explored patients' clinical characteristics including age, sex, height, weight, BMI, body surface area (BSA), smoking status, presence of atopy and chronic rhinitis, age at asthma diagnosis, asthma duration, number of exacerbations (requiring the use inhaled or systemic corticosteroid agents or emergency department visits) within the previous year, and Quality of Life Questionnaire for Adult Korean Asthmatics (QLQAKA) score (range 1 to 5 [minimal clinically important difference 0.5]; higher scores representing better quality of life).20 Atopy was identified following 1 or more positive results to common inhalant allergens via skin or serum specific immunoglobulin E (IgE) tests. Chronic rhinitis was confirmed if rhinorrhea with 1 or more symptoms including itching, sneezing and nasal obstruction was present chronically. Severe asthma was defined as per the European Respiratory Society (ERS)/American Thoracic Society (ATS) guideline,21 as either: 1) asthma “controlled” with high-dose inhaled corticosteroids and a second agent (i.e., systemic corticosteroids); or 2) “uncontrolled” asthma despite high-dose inhaled corticosteroids and a second agent (i.e., systemic corticosteroids). Asthma exacerbation was defined as: 1) worsening of asthma requiring systemic corticosteroids; 2) an increase from a stable maintenance corticosteroid dose for at least 3 days; or 3) emergency department visitation or hospitalization due to asthma requiring systemic corticosteroids.22
Baseline and post-bronchodilator FEV1, forced vital capacity (FVC), FEV1/FVC ratio, and forced expiratory flow between 25%−75% (FEF25−75) were recorded in all patients. The percentages of predicted FVC and FEV1 values were calculated.
CT image acquisition and quantification of airway and fat areas
To assess airway and fat areas CT scans were performed on all patients using a 128-multi-detector computed tomography scanner (Ingenuity CT; Philips Healthcare, Cleveland, OH, USA). The protocol for acquiring chest (airway) CT scans was as follows: detector collimation, 64 × 0.625 mm; rotation speed, 0.42 seconds; pitch, 1.25; tube voltage, 120 kV; tube current, 50 mAs; and automatic tube current modulation technique. Both inspiration and expiration chest (airway) CT images were obtained with slice thicknesses and intervals of 0.625 mm, using a standard algorithm (without an iterative reconstruction algorithm). The protocol for acquiring fat CT scans was as follows: level of the umbilicus; tube voltage, 140 kV; and tube current, 33 mAs. Axial fat CT images were reconstructed with slice thicknesses and intervals of 5.0 mm, using a standard algorithm. Transverse datasets were transferred to dedicated workstations to quantify airway and fat areas.
Airway parameters, including bronchial WT, LD, lumen area (LA), wall area (WA), total area (TA) and WA/TA percentage (wall area %), were semi-automatically measured at the apical segmental bronchus of the right upper lobe, which has been used as the target anatomic location to assess airway remodeling in asthmatic patients,2324 by a single radiologist. The predicted diameter and WT of the trachea were calculated using age, sex and height (as references to normalize the corresponding airway parameters).25 Emphysema and air-trapping scores were automatically calculated with low attenuation areas, below −950 and −856 HU in inspiration and expiration CT images, respectively.
Visceral (VFA), subcutaneous (SFA) and total (TFA) fat areas (cm2) were automatically measured and recorded. The fat areas used in the current study were indexed to BSA to account for variations in lean body mass and overall body size.26 A V/S of ≥ 0.4 was defined as EV.27 The correlation between abdominal fat areas, including VFA, SFA, and TFA, and airway parameters, emphysema % and air-trapping %, were assessed. The clinical characteristics of patients with and without EV were compared.
Statistical analysis
The sample size was calculated to power the study to test the correlation coefficient. With the assumption that the expected correlation coefficient would be 0.390 based on the result of previous study showing the correlation between airway WT and BMI,28 we determined that 49 subjects are required for statistical power of 0.80 to prove the hypothesis with two-sided test at a 0.05 significance level. All data are expressed as means ± standard deviations (SDs) unless otherwise stated. Correlation analyses were performed using coefficients. Dichotomous variables were compared using χ2 tests, and continuous variables were compared using Student's t tests for normally distributed variables and Wilcoxon rank-sum tests for non-normally distributed variables. Multiple linear regression or logistic regression were performed to control the effect of age. P values < 0.05 were considered statistically significant. All statistical analyses were performed using SPSS 20.0 (IBM SPSS Statistics; IBM Corp., Armonk, NY, USA).
Ethics
This prospective study was approved by the Institutional Review Board of SMG-SNU Boramae Medical Center (Seoul, Korea, IRB No. 16-2014-103). All clinical investigations were conducted according to the principles of the Declaration of Helsinki. Written informed consent was obtained from all participants
Go to :
RESULTS
Clinical characteristics and CT variables
A total of 54 patients participated in this study; however, 4 were excluded because they refused to undergo CT scanning due to claustrophobia (n = 1), consent withdrawal (n = 1), primary lung cancer (n = 1) and CT post-processing failure (n = 1). Thus, 50 patients were included in the analysis (mean age ± SD, 62.9 ± 10.6 years; 26/50 [52%] female).
Obesity with BMI ≥ 25 was found in 27 subjects (54%). Six (12%) subjects were current smokers, and 7 (14%) had atopy. Thirty (60%) subjects complained of chronic rhinitis symptoms, and 19 (38%) had severe asthma. The mean pre-bronchodilator FEV1 was 2.16 ± 0.64 L, and the mean post-bronchial FEV1 was 2.24 ± 0.62 L. Table 1 shows patients' clinical characteristics and pulmonary function test results. Table 2 shows patients' airway parameters including bronchial LD, WT, LA, WA, TA, wall area % (Fig. 1), emphysema %, air-trapping % and abdominal fat areas including VFA, SFA, and TFA (Fig. 2).
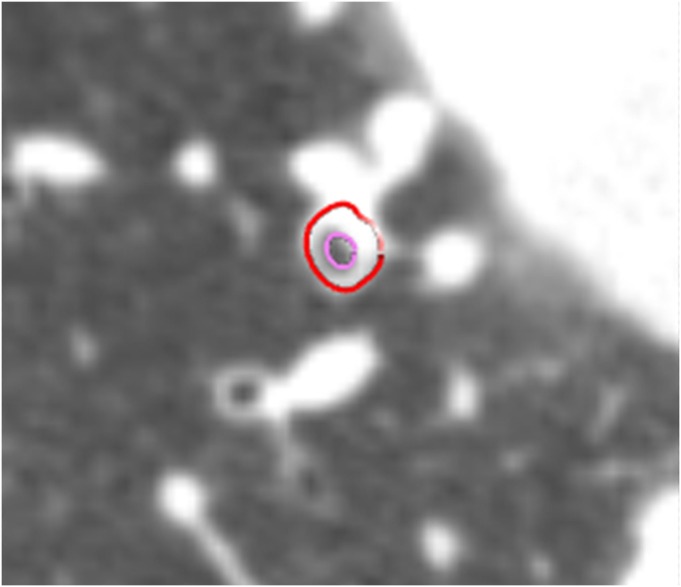 | Fig. 1Computed tomographic measurement of airway parameters at the right upper lobe apical segmental bronchus. The red and pink line is outer and inner border of the right upper lobe apical segmental bronchus, respectively. Bronchial LD, WT and WA % was estimated as 2.8 mm, 2.2 mm and 85%, respectively.LD, lumen diameter; WT, wall thickness; WA, wall area.
|
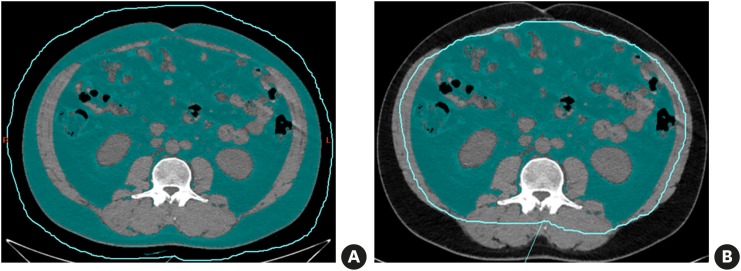 | Fig. 2Abdominal fat area assessed via CT in a 44-year-old man. The fat area was marked green. Abdominal TFA was calculated as 56.7 cm2 (A) and VFA as 36.6 cm2 (B).CT, computed tomography; TFA, total fat area; VFA, visceral fat area.
|
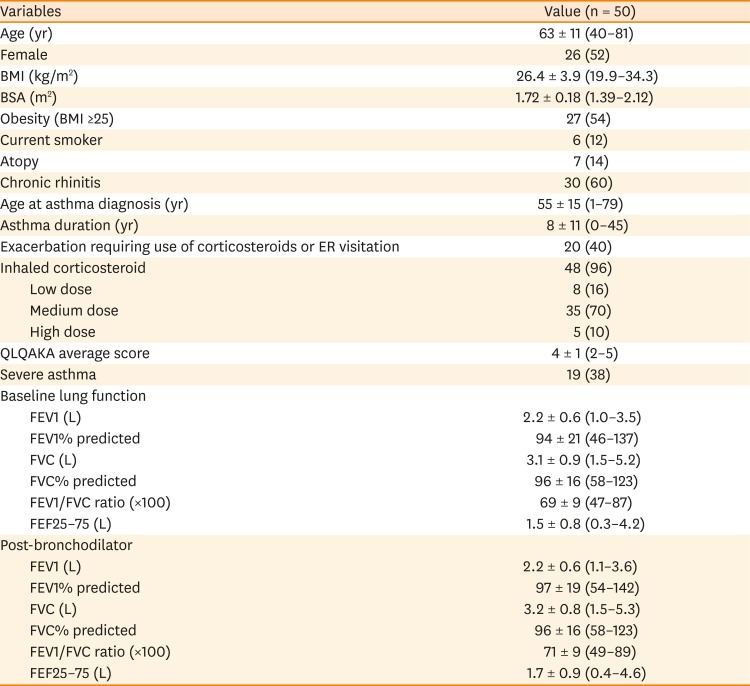
Table 1
Clinical characteristics and pulmonary function test results in patients with asthma
Values are means±SD (minimum–maximum) or number (%).
BMI, body mass index; BSA, body surface area; ER, emergency room (department); QLQAKA, Quality of Life Questionnaire for Adult Korean Asthmatics; FEV1, forced expiratory volume in 1 second; FVC, forced vital capacity; FEF, forced expiratory flow; SD, standard deviation.
![]()
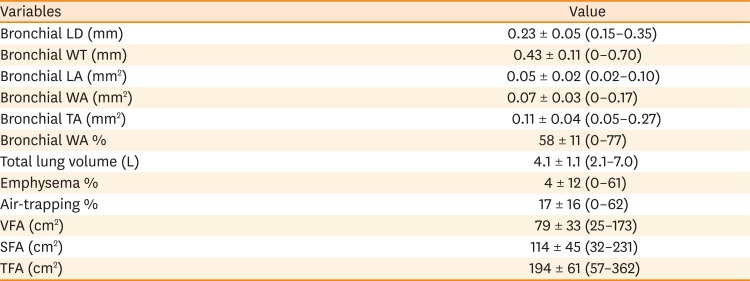
Table 2
Airway parameters, emphysema, air-trapping and abdominal fat areas assessed by chest and fat area CT in 50 patients with asthma
Data are means±SD (minimum–maximum). Airway parameters were measured at the orifice of the apical segmental bronchus in the right upper lobe and were normalized with predicted trachea diameter; and WT values calculated using age, sex, and height.18 The fat areas were indexed to BSA to account for variations in lean body mass and overall body size.19
CT, computed tomography; LD, lumen diameter; WT, wall thickness; LA, lumen area; WA, wall area; TA, total area; VFA, visceral fat area; SFA, subcutaneous fat area; TFA, total fat area; SD, standard deviation.
![]()
Correlation analyses (between abdominal fat areas and airway parameters, emphysema %, and air-trapping %) revealed significant negative correlations between VFA and both bronchial LD and LA (r = −0.35, P = 0.01; r = −0.34, P = 0.01, respectively; Table 3) and significant positive correlations between SFA and both bronchial WA and TA (r = 0.38, P = 0.007; r = 0.34, P = 0.01, respectively; Fig. 3); no significant correlations were found for TFA. Emphysema and air-trapping % did not correlate significantly with abdominal fat area. BMI showed significant correlations with LD and LA (r = −0.34, P = 0.02 for both; Table 3).
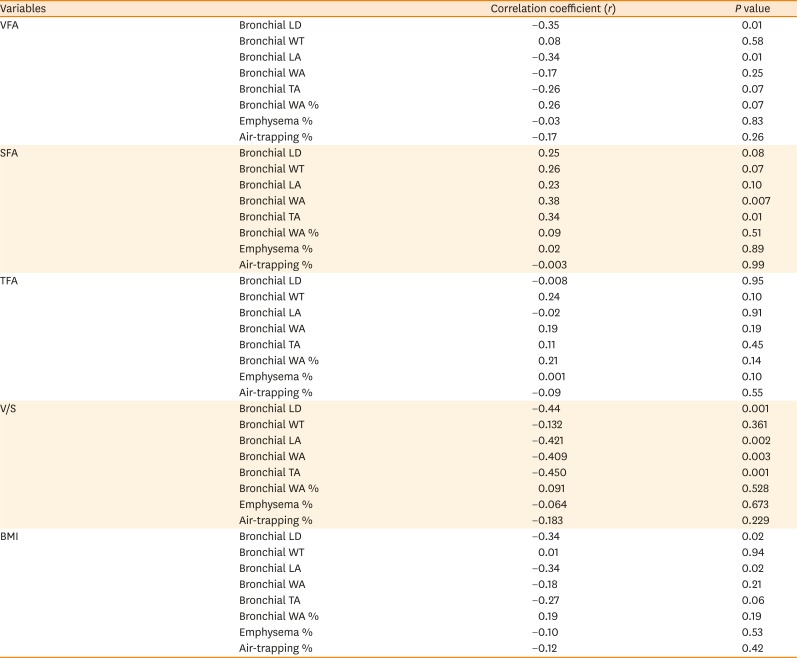
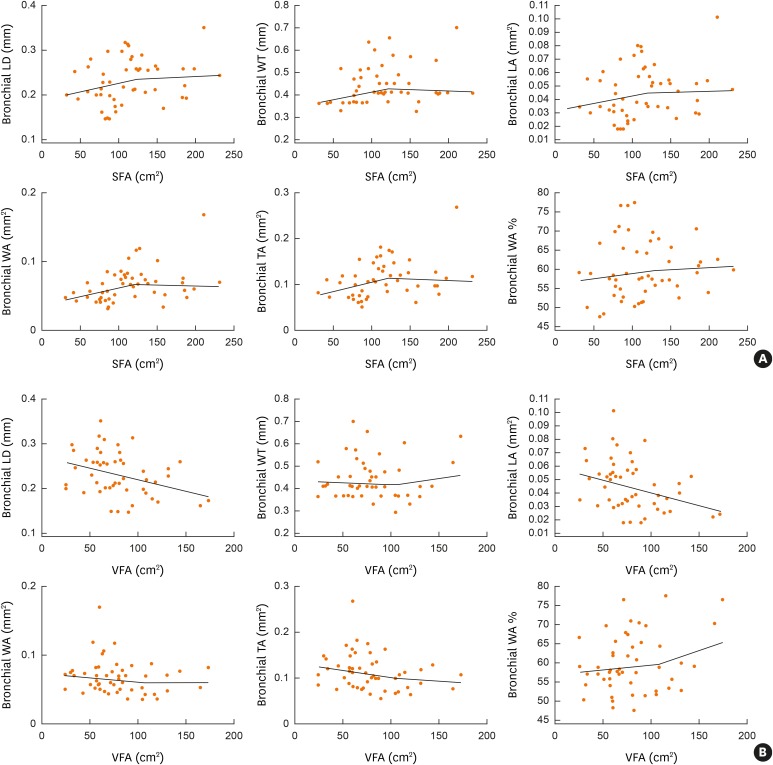 | Fig. 3Scatter diagrams and line of best fit showing correlation between VFA (A) or SFA (B) and airway parameters including bronchial LD, bronchial WT, bronchial LA, bronchial WA, bronchial TA and bronchial WA %.VFA, visceral fat area; SFA, subcutaneous fat area; LD, lumen diameter; WT, wall thickness; LA, lumen area; WA, wall area; TA, total area.
|
Table 3
Correlation between abdominal fat s or BMI and airway parameters, emphysema %, and air-trapping % in 50 patients with asthma
Correlation analyses were performed using Pearson's correlation coefficients.
BMI, body mass index; VFA, visceral fat area; SFA, subcutaneous fat area; TFA, total fat area; V/S, visceral to subcutaneous fat area ratio; LD, lumen diameter; WT, wall thickness; LA, lumen area; WA, wall area; TA, total area.
![]()
EV was found in 44 patients (92%). Subjects with EV were older (65 vs. 48 years, P < 0.001) and were diagnosed with asthma at an older age (43 vs. 56 years old, P = 0.04; Table 4). There were no differences in atopy, chronic rhinitis, QLQAKA score or presence of severe asthma between patients without and with EV; however, exacerbations requiring corticosteroid therapy or ER visitation were significantly more frequent in subjects without EV (83% vs. 34%, P = 0.05). The pulmonary function test results revealed significantly lower baseline FEV1 and post-bronchodilator FEV1% predicted in patients with EV (2.6 vs. 2.1, P = 0.04; 107.5 vs. 95.3, P = 0.05; respectively).
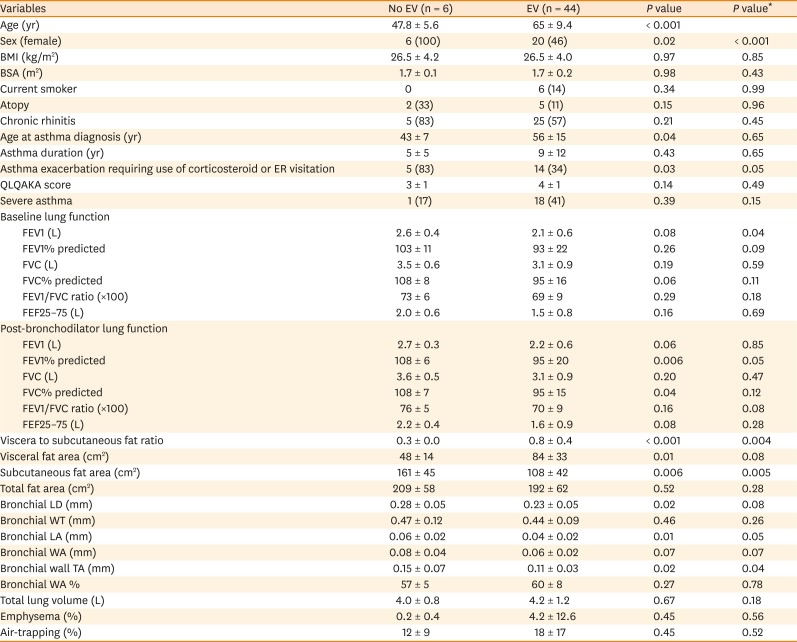
Table 4
Comparison of the clinical characteristics and CT variables between asthmatic patients without and with EV measured on CT
Data are mean±SD or number (%). EV was defined as VFA/SFA ≥0.4.
CT, computed tomography; EV, elevated visceral to subcutaneous fat area ratio; BMI, body mass index; BSA, body surface area; ER, emergency room (department); QLQAKA, Quality of Life Questionnaire for Adult Korean Asthmatics; FEV1, forced expiratory volume in 1 second; FVC, forced vital capacity; FEF, forced expiratory flow; LD, lumen diameter; WT, wall thickness; LA, lumen area; WA, wall area; TA, total area.
*Multiple linear regression or logistic regression were performed to control the effect of age.
![]()
Go to :
DISCUSSION
In this study, bronchial LD and LA, assessed via CT, were found to decrease as VFA increased in asthmatic patients. Moreover, asthmatic patients with EV had lower bronchial LDs and TAs than those without. Subcutaneous fat area is positively associated with bronchial WA, which might be a marker for airway remodeling in asthma.29
We found that different locations of adipose tissues within the body of asthmatics might be related to different airway parameters. Abdominal VFA was negatively associated with LD and LA. In addition, asthmatics with EV had smaller airway LDs and thinner airway WTs than those without. This finding is in-line with the known effect of body weight on airway caliber.303132A possible explanation supporting the inverse correlation between visceral fat and bronchial LD or LA is that excessive adipose tissue, accumulating around intra−abdominal organs, might push the diaphragm upward, resulting in insufficient inflation of the lungs and airway.12 Significantly lower post-bronchodilator FEV1% predicted and FVC% predicted values in asthmatic patients with EV might also indicate that VFA was indirectly associated with the bronchial lumen. On the other hand, abdominal SFA, but not VFA, was associated with bronchial WA and TA in this study (r = 0.38, P = 0.007, r = 0.34, P = 0.01, respectively). This is consistent with the result of a recent study exploring abdominal fat areas via CT, which revealed that subcutaneous, but not visceral, adiposity was associated with asthma.33 Another study demonstrating that subcutaneous abdominal fat was associated with airway hyper-responsiveness is also quite similar to our results.34 It was proposed that leptin which is one of the best-known systemically secreted adipokines would affect proliferation and survival of eosinophils and promote airway inflammation in several reports.353637 Considering that there were reports describing airway inflammation in asthma could be demonstrated as bronchial wall thickening on CT,3839 the positive association of SFA with WA or TA shown in this study might suggest that subcutaneous fat tissue may influence the airway inflammation through systemically secreted adipokines. These results were unexpected because visceral fat was better known to be more related to systemic inflammation than subcutaneous fat in other diseases. Visceral adiposity was proposed to be associated with type 2 diabetes, inflammation, dyslipidemia and non-alcoholic fatty liver disease (NAFLD), whereas subcutaneous adiposity was not.40 There were several factors that distinguish visceral and subcutaneous fat tissues, including adipokines and cytokine production, and lipid storage and mobilization abilities.41 Regarding NAFLD, visceral fat is anatomically linked to the liver through the portal vein. The ability of visceral adipose tissue to deliver free fatty acids and adipokines/cytokines to the liver is likely to explain the association between visceral fat and NAFLD.40 However, our results suggest that subcutaneous adiposity may be related to airway inflammation more than visceral adiposity unlike in other diseases.
There was significant difference in clinical outcomes of asthmatics according to the distribution of adipose tissue in their body whether they were obese or not. Asthmatics without EV showed more frequent asthma exacerbation requiring use of corticosteroid or ER visit in this study. This would be explained by the presence of airway inflammation. Because bronchial wall thickening on CT might reflect airway inflammation as mentioned above39 and airway inflammation is one of the most important risk factors for acute exacerbation,42 asthmatics without EV might be vulnerable to acute exacerbation. Only about half of the subjects in our study were BMI 25 kg/m2 or higher, and it seemed that even non-obese subjects were affected by their fat location.9 Differences in adipocyte size and tissue biology between differing human adipose tissue depots were found in recent studies exploring human coronary inflammation.434445 Result from that study may indicate that it is the location and composition of adipose tissue that is important in the fat associated− inflammation than the total amount of fat in the body.43 Obesity is a well− known risk factor for asthma, and obesity related asthma subtypes had been reproducibly suggested in several unsupervised cluster analysis of asthma.464748 However, considering that subcutaneous and visceral adipose tissues play different roles in inflammatory diseases, obesity itself would be an arbitrary phenotype rather than ‘an endotype’ which is a phenotypic classification that reflects the pathomechanism of the disease. Thus, separate measurement of SFA and VFA, using CT in this study, would provide a clue to better pathophysiology-based classification of asthma than just using BMI and obesity as a criterion for asthma classification. Through this study, we could suggest that not only obese patients with high BMI but also non-obese asthmatics might be affected by the adipose tissue in various ways, depending on the location of fat tissue. This might provide a clue for new endotypic approach and for personalized management for fat associated asthma.
This study has several limitations. First, we included non-severe asthmatic patients. Meticulous care is required to compare the results of this study to those of previous studies, exploring asthma using CT, which only include patients with severe asthma.23 Secondly, 50 asthmatic patients included in this study are too small to generalize the results. Further studies with a larger sample size will be needed to confirm our results. Thirdly, we only included airway parameters for the apical segmental bronchus in the right upper lobe,4950 due to limited use of dedicated post-processing software. However, there may be more information on airway parameters in other lobes or subsegmental bronchi. Comprehensive analysis with advanced post-processing software is necessary. Fourthly, current smokers were included in this study; while smoking induces airway inflammation, independent of asthma, excluding current smokers could bias study results as a population including smokers reflects the real population of asthmatic patients. Finally, intrathoracic fat was not evaluated in this study. We indirectly evaluated obesity using abdominal fat area only. A comprehensive method for quantifying thoracic fat is necessary to evaluate the direct association between fat and airway or lung parenchyma.
In summary, the present study suggests that the relationship between abdominal fat and asthma would vary, depending on the distribution of fat tissues. Visceral fat seems to be attributable to the bronchial luminal narrowing, while subcutaneous fat may be related to thickening of bronchial wall in asthmatic patients. Further studies are required to explore the causal relationship of fat tissue location and their effects on different endotypes of asthma.
Go to :
 XML Download