Journal List > Allergy Asthma Immunol Res > v.10(5) > 1099593

Inoue, Sato, Manabe, Makita, Chiyotanda, Takahashi, Yamamoto, Yanagida, and Ebisawa: Measurement of Exhaled Nitric Oxide in Children: A Comparison Between NObreath® and NIOX VERO® Analyzers

Abstract

Purpose

Few studies have compared fractional exhaled nitric oxide (FeNO) measurement by NIOX VERO® (NOV) and other devices in children. Moreover, there is no agreement between differences in FeNO values obtained using different devices in adults. Here, we compared FeNO values obtained using NOV and NObreath® (NOB) systems to derive a correction equation for children.

Methods

Eighty-eight participants (age 7–15 years) who were diagnosed with atopic bronchial asthma and visited Sagamihara National Hospital as outpatients between January and April of 2017 were included. We measured FeNO values obtained using NOB and NOV, and analyzed them using Wilcoxon tests and Altman-Bland plots.

Results

The median age of the participants was 11.5 years, and the scored Asthma Control Test (ACT) or Childhood ACT (C-ACT) was 25 (interquartile range, 24–25) or 26 (24–27). NOB and NOV values were significantly different (31 [14–52] versus 36 [20–59] ppb; P = 0.020) and strongly correlated (r = 0.92). An equation to convert NOB values into NOV values was derived using linear regression as follows: log NOV = 0.7329 × log NOB + 0.4704; NOB for 20, 40, 58, 80 and 100 ppb corresponded to NOV for 27, 44, 59, 73 and 86 ppb. Thus, NOB < 58 ppb suggested NOB < NOV, whereas NOB > 58 ppb suggested NOB > NOV.

Conclusions

NOB and NOV values were strongly correlated. Participants whose FeNO values were relatively low represented NOB < NOV, whereas those whose FeNO values were relatively high represented NOB > NOV.

INTRODUCTION

Bronchial asthma is pathophysiologically characterized by chronic airway inflammation, which induces airway hyper-responsiveness. Persistent airway inflammation causes structural changes in the bronchus, which leads to irreversible airway obstruction and promotion of bronchial hypersensitivity. Therefore, it is important to evaluate the severity of airway inflammation at an early stage.1 Fractional exhaled nitric oxide (FeNO) has now been developed as a useful marker for eosinophilic airway inflammation, particularly in children, because of its convenience and noninvasiveness of the method.2345678 However, some studies have reported that there are differences in FeNO levels obtained using different devices.9101112 Therefore, the interpretation of FeNO results requires careful consideration of the compatibility of devices.
In Japan, as of July 2017, 3 devices are used for the measurement of FeNO and are covered by insurance, namely, NIOX MINO®, NIOX VERO® (NOV; Aerocrine, Solna, Sweden) and NObreath® (NOB; Bedfont, Kent, UK). These devices were assessed based on the National Institute for Health and Clinical Excellence (NICE) guideline.13 NOV is a new device that will replace NIOX MINO®, and the use of NOV was previously limited owing to its high cost. However, after being approved for coverage by the national health insurance in March 2015, the use of NOV has increased. Because NOV has not been used for many years in clinical practice, few studies have compared FeNO values obtained using NOV and other devices; one study has reported such a comparison in adults, but no studies in children have been reported.12 Notably, FeNO levels increase with age; therefore, further studies on FeNO analyses in children are needed.14
Moreover, although some studies have shown the conversion equation for FeNO values between different devices, no study has confirmed the accuracy of the conversion equation and the repeatability of the FeNO analysis in validation studies in additional participants.
Accordingly, in this study, we compared FeNO values obtained using NOB and NOV and derived a correction equation for values obtained using these 2 devices.

MATERIALS AND METHODS

Patients

This cross-sectional study was conducted on outpatients with bronchial asthma who visited the Sagamihara National Hospital between January and April of 2017 (Fig. 1). Participants were recruited prospectively.
Fig. 1

Study flow chart. Eighty-eight participants (outpatients; ages 7–15 years) who were diagnosed with atopic bronchial asthma were subjected to FeNO measurement using NObreath® and NIOX VERO®.

aair-10-478-g001
Inclusion criteria were as follows: 1) diagnosis of atopic bronchial asthma, 2) age 7–15 years, 3) being able to undergo spirometry and FeNO measurement, and 4) providing informed consent to participate in the study. FeNO values obtained using NOB and NOV were compared.
The diagnosis of bronchial asthma was based on application of the Japanese Pediatric Guideline for the Treatment and Management of Asthma 2012,15 which referred to international guidelines, the Global Initiative for Asthma (GINA)16 and Expert Panel Report 3 (EPR3).17 Each participant underwent a standard clinical assessment in accordance with the guideline, including history and physical examination performed by an experienced pediatrician. Treatment was then chosen as appropriate. We defined atopic asthma as the presence of allergen-specific immunoglobulin E (IgE) antibodies to antigens in accordance with the guideline.
Participants were excluded if they visited the hospital twice during the survey or had wheezing or a cold. Participants who could not undergo FeNO measurement using both devices, for whatever reason, were also excluded. Moreover, for both NOB and NOV, the concentration range was set at 5–300 ppb, and participants having FeNO values lower than 5 ppb or higher than 300 ppb were excluded.
Patients with a past diagnosis of atopic dermatitis (AD) or allergic conjunctivitis (AC) were assigned to the AD or AC groups. Patients presenting symptoms of allergic rhinitis (AR) at FeNO measurement were assigned to the AR group.
A sample size of 84 was used based on power analysis in which the alpha level was fixed at 0.05, the anticipated effect size (r) was 0.3, and the desired statistical power level was 0.8, using R version 3.4.1 (The R Foundation, Vienna, Austria). We then estimated that approximately 20% of participants would be excluded, leading to a total calculated sample size of 100.

Measurement of FeNO and lung function

All participants underwent FeNO measurement before spirometry. FeNO was recorded by trained physicians using NOB and NOV. The first challenge device was set alternately on a weekly basis. Both FeNO and lung function measurements were recorded during the period from 15:00 to 17:00. Instruction sheets for the physicians were prepared in order to unify the verbal instructions and explanations of the measurements as described below.

FeNO measurement using NOB

Participants underwent the measurement in a sitting position, holding the monitor upright at all times. After inhaling to total lung capacity, participants then exhaled through the mouthpiece, ensuring that the ball in the flow indicator was held in the middle of the white band.12 The exhalation time was approximately 10 seconds for patients aged less than 12 years of age and 12 seconds for patients 12 years and older. All participants were asked to repeat the measurement 3 times in order to verify the repeatability of the device.

FeNO measurement using NOV

The participants were asked to empty their lungs and then inhale deeply through the filter to total lung capacity. Next, the patients exhaled slowly through the filter and regulated their exhaled flow rate through assistance by an animation display.12 The exhalation time was adjusted to 10 seconds for all participants. Measurements were repeated until one acceptable value was obtained, as judged by the machine. This value was used as the NOV measurement.

Comparison between NOB and NOV

The FeNO values were compared between NOB and NOV. The obtained median value was used as the NOB measurement. Subsequently, we assessed the relationship and differences between NOB and NOV. We also investigated the relationship between NOB/NOV and clinical parameters such as scores for the Asthma Control Test (ACT) or Childhood ACT (C-ACT), and the results of lung function tests. Additionally, we compared the FeNO values obtained for participants who had symptoms of AR and those who did not.

Measurement of lung function

Lung function was measured using an Autospiro model AS-407 (Minato, Osaka, Japan). Examination was performed on the participants wearing a nose clip. We asked the participants to expire as hard and fast in the spirometer as possible and obtained several acceptable values; the highest value was used. The parameters examined in this study were forced vital capacity (FVC), forced expiratory volume in 1 second (FEV1), flow at 50% forced vital capacity (50) and flow at 25% forced vital capacity (25).

Visual analog scale (VAS)

After measurement of FeNO, patients rated the difficulty to undergo the experiment using the NOB and NOV devices, based on the VAS. The VAS consisted of a horizontal ruler without any marks; a patient made a mark on the horizontal ruler based on the difficulty of the measurement, with the left side being “not difficult to undergo” and the right side being “difficult to undergo.” There were lines on the ruler every 100 mm, and the distance from the left side in mm was measured to evaluate the difficulty of the methods.

ACTs

Asthma control was assessed using the Japanese version of the ACT for patients aged older than 12 years and the C-ACT for patients aged less than 12 years of age.18 C-ACT included questions for parents because it is used for younger children. The highest possible scores for the ACT and C-ACT are 25 and 27, respectively. A cutoff score of 20 or more was identified in patients with well-controlled asthma.

Validations

After the investigation, we continued measuring FeNO using NOB and NOV to confirm the accuracy of our results, by a validation study. We recruited additional individuals who did not participate in the investigation conducted between January and April of 2017 for the validation study. The additional investigation was conducted from June to July 2017. With the exception of recruiting additional participants, the methods involving the inclusion and exclusion criteria were the same as in our prior investigation.

Statistical analysis

Statistical analysis was performed using GraphPad Prism 7J (GraphPad Software, Inc., La Jolla, CA, USA). The data are described as medians, quartiles, and 95% confidence intervals. The relationships between values obtained using NOB and NOV were estimated using Spearman's correlation coefficients. To analyze differences between results obtained using NOB and NOV, Wilcoxon tests were performed, and P values of less than 0.05 were considered to indicate statistical significance. An equation to convert values obtained using NOB into those obtained using NOV was derived by linear regression analysis. The agreement between the 2 methods was assessed by the method of differences from the averages, as reported by Altman and Bland.19
We calculated the coefficient of determination (R2) in both the primary and validation date sets to deny overfitting of the model. Furthermore, we examined root mean squared error (RMSE) to confirm the reliability of the model.
Since the FeNO values showed a lognormal distribution, we analyzed all the FeNO values using a logarithmic conversion.

Ethical considerations

All procedures performed in this study were in accordance with the ethical standards of the Institutional Review Board of Sagamihara National Hospital and with the 1964 Declaration of Helsinki and its later amendments. Children and their parents were provided with oral and written explanation of the objectives of the study, and written informed consent to participate was obtained from each child.

RESULTS

Two -hundred -one participants were initially recruited to our study, and 88 participants were included in the final analysis. The clinical characteristics and lung function of the participants are summarized in Table 1. The median age of the participants was 11.5 years, and the scored ACT and C-ACT were 25 (24–25 [median, quartile]) and 26 (24–27), respectively. Of the recruited 88 participants, 69 (78%) were treated with inhaled corticosteroids (ICSs) at 100–200 μg/day (fluticasone equivalent).
Table 1

Characteristics of participants

aair-10-478-i001
Variables Values
Total, No. 88
Male 57 (65)
Age (yr) 11.5 (10.4–13.7)
Complications AD 46 (52)
AR 61 (69)
AC 42 (48)
ACT* score 25 (24–25)
C-ACT score 26 (24–27)
Treatment ICS 69 (78)
Leukotriene receptor antagonist 26 (30)
Dose of ICS (µg/day, fluticasone equivalent) 100 (100–200)
FVC (% pred.) 97 (89–105)
FEV1 (% pred.) 96 (85–102)
FEV1/FVC (% pred.) 86.8 (83.7–89.6)
V˙aair-10-478-i00350 (% pred.) 85 (70–103)
V˙aair-10-478-i00325 (% pred.) 80 (61–92)
Values are presented as number (%) or median (quartile).
AD, atopic dermatitis; AR, allergic rhinitis; AC, allergic conjunctivitis; ACT, Asthma Control Test; C-ACT, Childhood Asthma Control Test; ICS, inhaled corticosteroid; % pred., % of predicted value; FVC, forced vital capacity; FEV1, forced expiratory volume in 1 second; V˙aair-10-478-i00350, flow at 50% forced vital capacity; V˙aair-10-478-i00325, flow at 25% forced vital capacity.
*From 36 subjects aged ≥ 12 years; From 51 subjects aged < 12 years.
A comparison of values obtained using the NOB and NOV systems is shown in Fig. 2. The median values using NOB and NOV systems were 31 (14–52) and 36 (20–59) ppb, respectively, and that obtained using NOV was significantly higher than that obtained using NOB (P = 0.020).
Fig. 2

FeNO values obtained using NObreath® and NIOX VERO® devices.

FeNO, fractional exhaled nitric oxide.
*Wilcoxon test.
aair-10-478-g002
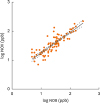
The correlations between the NOB and NOV measurements are shown in Fig. 3. The measurements obtained using the 2 devices were highly correlated (r = 0.92). An equation to convert the value obtained using NOB into that obtained using NOV is shown in Table 2; this equation was derived by linear regression analysis as follows: log NOV = 0.7329 × log NOB + 0.4704. According to the conversion chart between NOB and NOV, NOB measurements of 20, 40, 58, 80 and 100 ppb corresponded to NOV measurements of 27, 44, 58, 73 and 86 ppb, respectively. Thus, according to this analysis, NOB < 58 ppb suggested NOB < NOV, whereas NOB > 58 ppb suggested NOB > NOV.
Fig. 3

Correlation between log NOB and log NOV. The x-axis represents log NOB (ppb), and the y-axis represents log NOV (ppb). r = 0.92, the continuous and dotted lines represent linear regression and the range of the 95% confidence interval, respectively.

NOB, NObreath®; NOV, NIOX VERO®.
aair-10-478-g003
Table 2

Conversion chart for NOB and NOV values

aair-10-478-i002
NOB (ppb) NOV (ppb)
- 10
10 16
15 21
20 27
25 31
30 36
35 40
40 44
45 48
50 52
58 58
60 59
65 63
70 66
75 70
80 73
85 77
90 80
95 83
100 86
Conversion equation: log NOV = 0. 7329 × log NOB + 0.4704. According to this table, NOB < 58 ppb suggests NOB < NOV, whereas NOB > 58 ppb suggests NOB > NOV. The boundary point was set at NOB=58 ppb.
NOB, NObreath®; NOV, NIOX VERO®.
Agreement between the values obtained using the NOB and NOV systems was reflected in Altman-Bland plots and used to compare the interdevice mean with the interdevice difference (Fig. 4). The results showed that the FeNO value tended to be associated with the differences between NOB and NOV measurements.
Fig. 4

Altman-Bland plots showing differences between log NOB and log NOV. Agreement between NOB and NOV values was determined using Altman-Bland plots comparing the interdevice mean with the interdevice difference.

NOB, NObreath®; NOV, NIOX VERO®; SD, standard deviation.
aair-10-478-g004
A comparison of the counts needed for acceptable measurement of NOV values and the age at measurement is shown in Fig. 5. The median ages of patients who were able to undergo acceptable NOV measurements on the first attempt or after many attempts were 12.6 (11.1–14.4) and 10.9 (9.9–10.9) years, respectively; these values were significantly different (P = 0.002).
Fig. 5

Comparison of the ages of participants who were able to undergo acceptable NIOX VERO® measurements on the first attempt or after many attempts.

*Mann-Whitney test.
aair-10-478-g005
We assessed the repeatability of FeNO measurements performed using NOB (Supplementary Fig. S1). The first, second and third FeNO values were 29 (13–41), 32 (14–52) and 28 (15–55) ppb, respectively. The differences between the first and second measurements and between the first and third measurements were significant (P = 0.008 and 0.009, respectively).
Next, we investigated the relationship between NOB/NOV and clinical parameters (Supplementary Table S1). There were no significant correlations between the NOB or NOV devices and any clinical parameters.
We also compared FeNO values obtained by participants who had symptoms of AR or did not. Although participants with AR tended to have higher FeNO values than those without, there were no significant differences between the NOB and NOV systems (P = 0.988 and 0.751, Supplementary Fig. S2).
Additionally, we evaluated VASs (Fig. 6). The median VAS obtained using NOB and NOV systems were 33 (12–48) and 38 (21–57), respectively; there were no significant differences in VASs between the NOB and NOV systems (P = 0.055; Fig. 6).
Fig. 6

Comparison of VASs obtained using NObreath® and NIOX VERO® devices. The difficulty in using each device was assessed using VAS.

VAS, visual analog scales.
aair-10-478-g006
Notably, there were no significant differences in VAS depending on the order of the devices used (data not shown).
Finally, we confirmed the accuracy of our results by a validation study. Between June and July 2017, we recruited another 34 subjects who did not participate in the prior investigation. The added FeNO data from the 34 participants are shown in Supplementary Fig. S3. The backgrounds of these subjects were as follows (medians): age, 12.3 years; percentage of the scored ACT or C-ACT/total score, 100%; FVC (%predicted), 93%; FEV1 (%predicted), 87%; NOB, 43 ppb; and NOV, 31 ppb. We confirmed that the additional participants (red dots, n = 34) were similar to the prior participants (black dots, n = 88), and the equation was derived by linear regression analysis.
Model validation with data-splitting was performed to assess the accuracy and repeatability of the conversion equation. R2 in the validation samples (0.89) was similar to that in the training set (0.86); hence, our model was considered valuable. The RMSE in the validation set was 0.12, indicating the reliability of the proposed model.

DISCUSSION

In this study, we found that when we focused on populations with high FeNO levels (e.g., NOB >58 ppb), the devices showed higher FeNO values, with inversion between NOB and NOV; that is, NOB showed higher values than NOV.
In previous studies, investigators were not entirely in agreement with regard to differences in FeNO values between devices (Supplementary Table S2).9101112 To explain this, we considered the possibility that these differences could depend on the FeNO levels of the target populations. In studies by Pisi et al.9 and Tsuburai et al.,12 the participants showed relatively low median FeNO values of 22/24 ppb for NOB/NIOX MINO® and 24/35 ppb for NOB/NOV, respectively. Although Kapande et al.10 did not clarify the FeNO levels, the participants may have shown relatively low FeNO values, as supported by the fact that the median FeNO value was 11 ppb in the population. These 3 studies concluded that NIOX devices showed higher FeNO values than the NOB device. In contrast, Fukuhara et al. 11 reported that NOB yielded higher values than NIOX MINO® in participants whose mean FeNO level was relatively high. Since the study by Fukuhara et al.11 was the only one that focused on high-FeNO populations, to the best of our knowledge, we could not make concrete conclusions from our data either.
We speculated that various devices may show different FeNO values based on the FeNO level of the population. Based on this hypothesis and consistent with previous reports, we found that NIOX devices (e.g., NIOX®, NIOX MINO® and NOV) showed higher FeNO values in the low-FeNO population, whereas NOB showed higher values in the high-FeNO population. In summary, the effectiveness of the device appeared to be controlled by the FeNO level in the target population. This could explain why the investigators were unable to reach a conclusion in the previous study. Such discrepancies often confuse clinicians. Therefore, our study has the potential to provide new information to clinicians and assist them in better assessing asthma.
According to the official ATS Clinical Practice Guideline, the FeNO value, which indicates eosinophilic inflammation, is defined as 20-35 ppb in children.20 Even if the NOB level was less than 20 ppb, the NOV level could be higher than 20 ppb. In these cases, individuals may not always be assessed well or have their asthma easily controlled. Although it is difficult to clarify the significance of this gap in FeNO levels in clinical practice, there were obvious differences between results obtained using the NOB and NOV systems in our study. Therefore, FeNO values should be interpreted cautiously and with reference to the clinical context. It is not adequate to assess asthma control based on the obtained FeNO value only because FeNO is an auxiliary diagnostic tool for asthma.620 Finally, whether asthma is controlled or not should be assessed comprehensively in the clinical context.
NOB reports FeNO values from technically poor performance, whereas NOV will display an error message and not report an FeNO value if the user does not perform the steps correctly. Accordingly, it is recommended that NOB measurement be performed several times and that the median FeNO value be recorded.610 Although we observed variability between attempts, these differences were not expected to be clinically relevant. Thus, we considered that a single breath was relatively sufficient if the procedure was correctly carried out.
The difficulty in using these devices should be recognized before use to improve the efficiency of FeNO measurement, particularly for children. There were no significant differences in VASs between the NOB and NOV devices; thus, these findings suggested that the difficulty in using NOB and NOV was similar. In contrast, participants who required several attempts for NOV measurement were younger than those who succeeded on the first attempt. From this result, we speculate that in younger children, NOV measurement may sometimes be time-consuming, even if it does not seem difficult. Because the VAS is a subjective score, it is not easy to evaluate accurately. However, in these cases, several NOB measurements can be recommended.
There are several limitations to this study. First, the FeNO data were obtained from patients visiting a single facility. Second, the asthma in most of our participants was relatively well controlled by ICSs. Third, since the research period was short and limited (from winter to spring), it is still unclear whether these conclusions are applicable to all seasons; FeNO values or lung function test results may vary with season. However, our data on mean FeNO and lung function values showed no differences between months. Furthermore, we confirmed the accuracy of our results by model validation in an additional investigation. Although we revealed the reliability of our proposed model, the data may not be sufficient for evaluation of other populations. Thus, further studies are needed to overcome these limitations.
In conclusion, NOB and NOV values were found to be strongly correlated; however, there were differences between them. Higher FeNO values could be caused by inversion between NOB and NOV values, and the boundary point was set as NOB = 58 ppb. Further prospective studies are needed to verify the validity of the equations in another cohort.

ACKNOWLEDGMENTS

We are grateful to all of the pediatricians and nurses at Sagamihara National Hospital for supporting our study. There is no funding to report for this study.
M. Ebisawa has received research support from J-Milk and from the Nipponham Foundation for the Future of Food. M. Ebisawa is a member of the DBV Technologies Scientific Advisory Board.

Notes

Disclosure There are no financial or other issues that might lead to conflict of interest.

References

1. Pohunek P, Warner JO, Turzíková J, Kudrmann J, Roche WR. Markers of eosinophilic inflammation and tissue re-modelling in children before clinically diagnosed bronchial asthma. Pediatr Allergy Immunol. 2005; 16:43–51.
crossref
2. Smith AD, Cowan JO, Filsell S, McLachlan C, Monti-Sheehan G, Jackson P, et al. Diagnosing asthma: comparisons between exhaled nitric oxide measurements and conventional tests. Am J Respir Crit Care Med. 2004; 169:473–478.
3. Smith AD, Cowan JO, Brassett KP, Filsell S, McLachlan C, Monti-Sheehan G, et al. Exhaled nitric oxide: a predictor of steroid response. Am J Respir Crit Care Med. 2005; 172:453–459.
4. Knuffman JE, Sorkness CA, Lemanske RF Jr, Mauger DT, Boehmer SJ, Martinez FD, et al. Phenotypic predictors of long-term response to inhaled corticosteroid and leukotriene modifier therapies in pediatric asthma. J Allergy Clin Immunol. 2009; 123:411–416.
crossref
5. Pijnenburg MW, Hofhuis W, Hop WC, De Jongste JC. Exhaled nitric oxide predicts asthma relapse in children with clinical asthma remission. Thorax. 2005; 60:215–218.
crossref
6. American Thoracic Society, European Respiratory Society. ATS/ERS recommendations for standardized procedures for the online and offline measurement of exhaled lower respiratory nitric oxide and nasal nitric oxide, 2005. Am J Respir Crit Care Med. 2005; 171:912–930.
7. Kim HB, Eckel SP, Kim JH, Gilliland FD. Exhaled NO: determinants and clinical application in children with allergic airway disease. Allergy Asthma Immunol Res. 2016; 8:12–21.
crossref
8. Yoon J, Choi YJ, Lee E, Cho HJ, Yang SI, Kim YH, et al. Allergic rhinitis in preschool children and the clinical utility of FeNO. Allergy Asthma Immunol Res. 2017; 9:314–321.
crossref
9. Pisi R, Aiello M, Tzani P, Marangio E, Olivieri D, Chetta A. Measurement of fractional exhaled nitric oxide by a new portable device: comparison with the standard technique. J Asthma. 2010; 47:805–809.
crossref
10. Kapande KM, McConaghy LA, Douglas I, McKenna S, Hughes JL, McCance DR, et al. Comparative repeatability of two handheld fractional exhaled nitric oxide monitors. Pediatr Pulmonol. 2012; 47:546–550.
crossref
11. Fukuhara A, Saito J, Sato S, Sato Y, Nikaido T, Saito K, et al. Validation study of asthma screening criteria based on subjective symptoms and fractional exhaled nitric oxide. Ann Allergy Asthma Immunol. 2011; 107:480–486.
crossref
12. Tsuburai T, Kamide Y, Nakamura Y, Tomita Y, Hamada Y, Watai K, et al. Differences in fraction of exhaled nitric oxide values measured by two hand-held analyzers (NO breath® and NIOX Vero®). Arerugi. 2017; 66:204–208.
13. National Institute for Health and Care Excellence. NICE Guidance [Internet]. London: National Institute for Health and Care Excellence;2017. cited 2017 Aug 16. Available from: https://www.nice.org.uk/Guidance.
14. Buchvald F, Baraldi E, Carraro S, Gaston B, De Jongste J, Pijnenburg MW, et al. Measurements of exhaled nitric oxide in healthy subjects age 4 to 17 years. J Allergy Clin Immunol. 2005; 115:1130–1136.
crossref
15. Hamasaki Y, Kohno Y, Ebisawa M, Kondo N, Nishima S, Nishimuta T, et al. Japanese pediatric guideline for the treatment and management of bronchial asthma 2012. Pediatr Int. 2014; 56:441–450.
crossref
16. Global Initiative for Asthma (GINA). Global strategy for asthma management and prevention: NHLBI_WHO workshop report. National Heart, Lung, and Blood Institute, National Institutes of Health [Internet]. place unknown: Global Initiative for Asthma;2009. cited 2009. Available from: http://www.ginasthma.org.
17. Expert Panel Report 3 (EPR3): Guidelines for the Diagnosis and Management of Asthma. National Heart, Lung and Blood Institute, National Institutes of Health;2007. NIH Publication Number 08-5846.
18. Nathan RA, Sorkness CA, Kosinski M, Schatz M, Li JT, Marcus P, et al. Development of the asthma control test: a survey for assessing asthma control. J Allergy Clin Immunol. 2004; 113:59–65.
19. Bland JM, Altman DG. Statistical methods for assessing agreement between two methods of clinical measurement. Lancet. 1986; 1:307–310.
crossref
20. Dweik RA, Boggs PB, Erzurum SC, Irvin CG, Leigh MW, Lundberg JO, American Thoracic Society Committee on Interpretation of Exhaled Nitric Oxide Levels (FENO) for Clinical Applications, et al. An official ATS clinical practice guideline: interpretation of exhaled nitric oxide levels (FENO) for clinical applications. Am J Respir Crit Care Med. 2011; 184:602–615.
crossref

SUPPLEMENTARY MATERIALS

Supplementary Table S1

Correlations between NOB and NOV devices with the clinical parameters

Supplementary Table S2

Comparison of FeNO measurements derived from different analyzers

Supplementary Fig. S1

Repeatability of NOB. We repeated the measurements three times to investigate the repeatability of FeNO values obtained using NObreath®.

Supplementary Fig. S2

FeNO values in participants with or without AR. We compared FeNO values obtained from participants with (n = 61) or without AR (n = 27).

Supplementary Fig. S3

Correlation between log NOB and log NOV in an additional investigation. We confirmed the accuracy and repeatability of the conversion equation obtained from Fig. 3.
TOOLS
ORCID iDs

Yoko Inoue
https://orcid.org/0000-0002-7044-9060

Sakura Sato
https://orcid.org/0000-0003-3674-0759

Tetsuharu Manabe
https://orcid.org/0000-0002-3184-2142

Eishi Makita
https://orcid.org/0000-0001-9356-2704

Masako Chiyotanda
https://orcid.org/0000-0003-2611-4586

Kyohei Takahashi
https://orcid.org/0000-0003-1220-7386

Hitoshi Yamamoto
https://orcid.org/0000-0003-3892-3081

Noriyuki Yanagida
https://orcid.org/0000-0001-9643-744X

Motohiro Ebisawa
https://orcid.org/0000-0003-4117-558X

Similar articles