

 PDF
PDF ePub
ePub Citation
 Print
Print


Introduction
Materials and Methods
1. Study design
2. Data collection
3. Radiological evaluation
4. Statistical analysis
Results
1. DVT within 1 month after PE
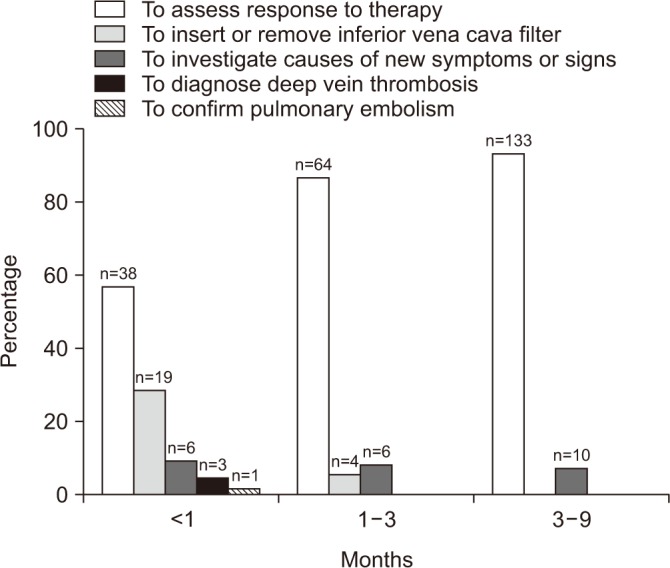 | Figure 1Reasons of follow-up computed tomographic venography. The most common reason why the patients undergo after pulmonary embolism is for assessment of response to treatment.
|
Table 1
Baseline characteristics of patients with follow-up CT venography within 1 month (n=67)
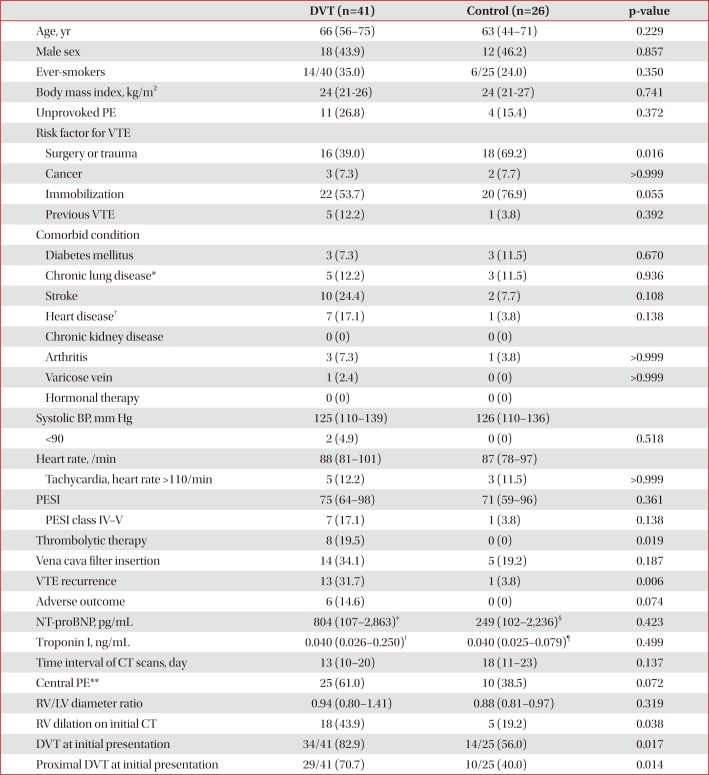
Values are presented as median (interquartile range) or number (%).
CT: computed tomography; DVT: deep vein thrombosis; PE: pulmonary embolism; VTE: venous thromboembolism; BP: blood pressure; PESI: pulmonary embolism severity index; NT-proBNP: N-terminal-pro-B-type natriuretic peptide; RV: right ventricle; LV: left ventricle.
*Chronic lung disease includes chronic obstructive pulmonary disease, asthma, bronchiectasis, idiopathic pulmonary fibrosis, pneumoconiosis, and tuberculosis-destroyed lung. †Heart disease includes ischemic heart disease, congestive heart failure, and atrial fibrillation. ‡n=22. §n=12. ‖n=31. ¶n=17. **Central pulmonary arteries mean right or left pulmonary artery or more proximal location.
![]()
2. DVT at 1–3 months after PE
Table 2
Baseline characteristics of patients with follow-up CT venography at 1–3 months (n=74)
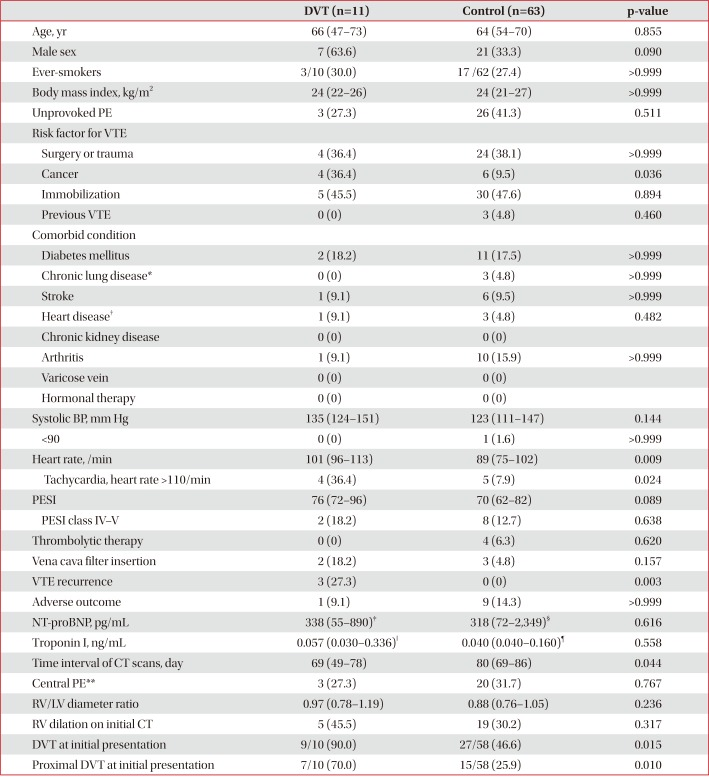
Values are presented as median (interquartile range) or number (%).
CT: computed tomography; DVT: deep vein thrombosis; PE: pulmonary embolism; VTE: venous thromboembolism; BP: blood pressure; PESI: pulmonary embolism severity index; NT-proBNP: N-terminal-pro-B-type natriuretic peptide; RV: right ventricle; LV: left ventricle.
*Chronic lung disease includes chronic obstructive pulmonary disease, asthma, bronchiectasis, idiopathic pulmonary fibrosis, pneumoconiosis, and tuberculosis-destroyed lung. †Heart disease includes ischemic heart disease, congestive heart failure, and atrial fibrillation. ‡n=9. §n=44. ‖n=9. ¶n=51. **Central pulmonary arteries mean right or left pulmonary artery or more proximal location.
![]()
3. DVT at 3-9 months after PE
Table 3
Baseline characteristics of patients with follow-up CT venography at 3–9 months (n=143)
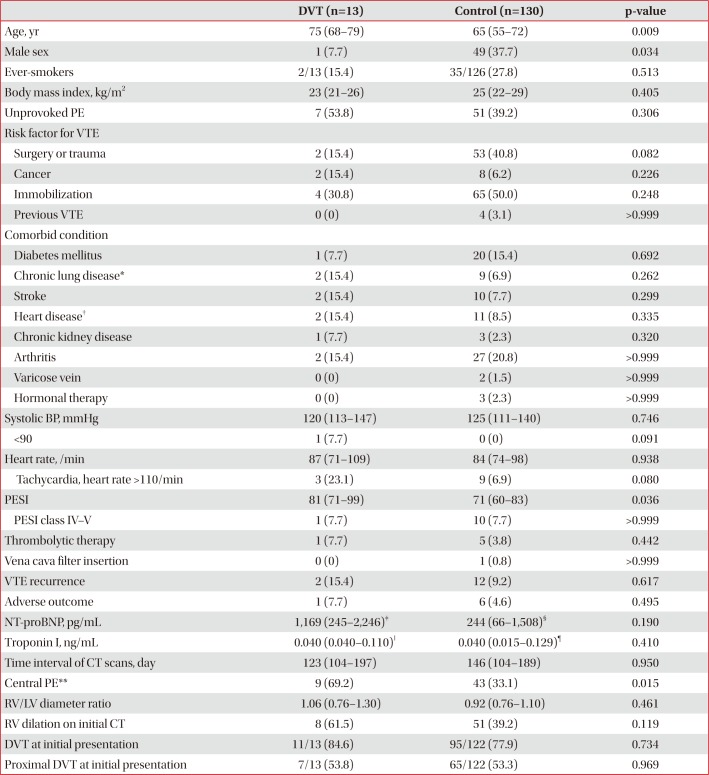
Values are presented as median (interquartile range) or number (%).
CT: computed tomography; DVT: deep vein thrombosis; PE: pulmonary embolism; VTE: venous thromboembolism; BP: blood pressure; PESI: pulmonary embolism severity index; NT-proBNP: N-terminal-pro-B-type natriuretic peptide; RV: right ventricle; LV: left ventricle.
*Chronic lung disease includes chronic obstructive pulmonary disease, asthma, bronchiectasis, idiopathic pulmonary fibrosis, pneumoconiosis, and tuberculosis-destroyed lung. †Heart disease includes ischemic heart disease, congestive heart failure, and atrial fibrillation. ‡n=10. §n=85. ‖n=11. ¶n=103. **Central pulmonary arteries mean right or left pulmonary artery or more proximal location.
![]()
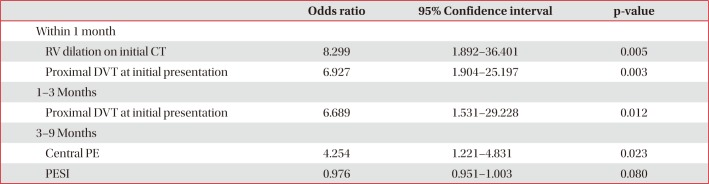
4. Predictors of DVT by CT venography during each time period
Table 4
Multivariate analysis for predictors of deep vein thrombosis on follow-up CT
![]()
5. Factors related to the recurrence of VTE
Table 5
Comparison of clinical parameters between VTE recurrence and non-recurrence groups (n=284)
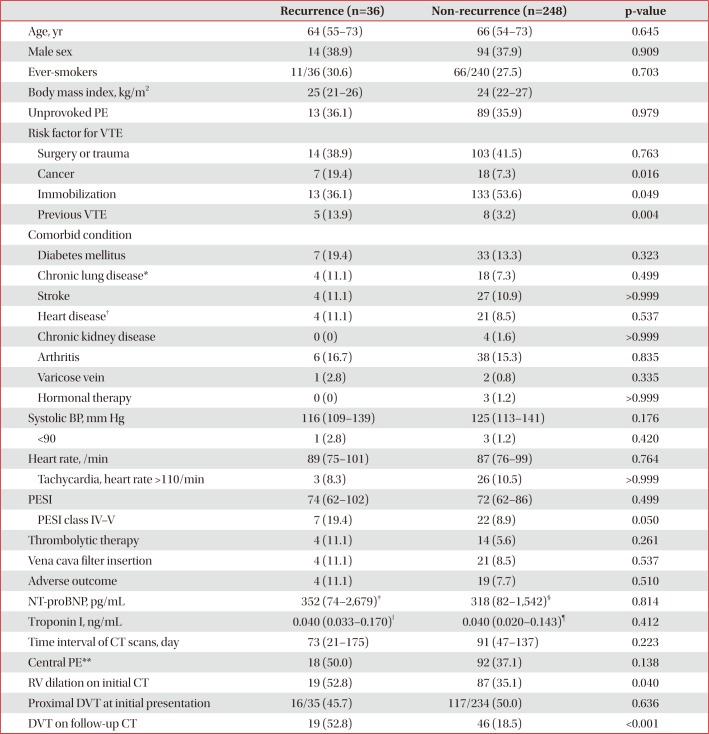
Values are presented as median (interquartile range) or number (%).
VTE: venous thromboembolism; PE: pulmonary embolism; BP: blood pressure; PESI: pulmonary embolism severity index; NT-proBNP: Nterminal-pro-B-type natriuretic peptide; CT: computed tomography; RV: right ventricle; DVT: deep vein thrombosis.
*Chronic lung disease includes chronic obstructive pulmonary disease, asthma, bronchiectasis, idiopathic pulmonary fibrosis, pneumoconiosis, and tuberculosis-destroyed lung. †Heart disease includes ischemic heart disease, congestive heart failure, and atrial fibrillation. ‡n=26. §n=156. ‖n=32. ¶n=190. **Central pulmonary arteries mean right or left pulmonary artery or more proximal location.
![]()

 XML Download