

 PDF
PDF ePub
ePub Citation
 Print
Print


INTRODUCTION
Energy intake (EI) is associated with many chronic diseases such as obesity, diabetes and cardiovascular disease (CVD); however, accurately measurement of it is difficult and considered as one of the major problems in epidemiological studies of nutrition [12]. Examining the correlation between nutrition status and diseases, researchers realized that under and over reporting might lead to systematic errors in studies [3]. The common methods to nutritional assessment include 24-hour recall (24HR) and food frequency questionnaire (FFQ). It is required that the strengths and weaknesses of each of these methods to be examined and then the most appropriate methods to be selected [4].
The doubly labeled water (DLW) technique is known as the golden standard for EI evaluation in free living individuals. In this method isotopic tracers (oxygen-18 and deuterium [18O and D2
18O]) was used that it was evaluated carbon dioxide production and then it can measure EI accurately [5]; however, it is not often used in epidemiological studies due to its complicated and costly technique [3]; therefore, a simple method was proposed the ratio of EI to basal metabolism rate (BMR) (EI/BMR) that it was used to determine the plausible reporting of EI [6]. This ratio has a positive correlation with the ratio EI/energy expenditure (EE) using the DLW. Therefore; it is a useful indicator for EI under and over-reporting analysis in epidemiological investigations [7]. BMR includes the minimum amount of energy needed to maintain body function and the largest part of the total daily energy expenditure (TDEE). It should be noted that resting metabolism rate (RMR) is often used instead of BMR in clinical and daily calculations, which its value is 10%–20% higher than that of BMR [8]. RMR is used as energy used for essential activity to maintain normal body function and homeostasis [7]. Measurement of RMR can be performed through indirect calorimetry (IC). The IC estimates the amount of EE in resting mode by measuring the amount of oxygen consumed, and the carbon dioxide produced by the body over a given period. The facilities of this method were varying, and the person usually breathed into a mouthpiece or hood, and the amount of respiratory gases is measured [8].
As unrealistic estimation of dietary intake results in an incorrect understanding of the relationship between nutritional factors and diseases; therefore, evaluating the accuracy of nutritional questionnaires are essential to determine the correct relationship between a diet and disease; therefore, it can provide proper nutritional recommendations [9]. This questionnaire needs to be validated in target population based on the dietary habits of ethnicities and races [10]. The current study was conducted to determine comparison of 3 nutritional questionnaires to determine EI accuracy in adults.
MATERIALS AND METHODS
Study design and population
This cross-sectional study was conducted on participants of food frequency questionnaire (FFQ)'s validation study of Ravansar Non-Communicable Chronic Disease (RaNCD). RaNCD study was designed by Persian cohort in 2014 for identify non-communicable chronic diseases. In this study, FFQ was developed that added native food to its. For evaluating the validity of FFQ, the sample size was 176 by using randomized sampling method among participant of RaNCD. We conducted our study on participants of FFQ's validation study by using the convenient sampling method in 2017. In our study, sample size was considered with 99% confidence and 95% power 124 of participants of FFQ validation study.
The inclusion criteria of this study included complete satisfaction for participating in the study and living in Ravansar city. The exclusion criteria included those participants who were unable to wear a calorimetric mask due to respiratory diseases and problems in head and neck, as well as those who could not stand on the body composition analysis device due to disabilities. Overall 118 were included in the current study. The participants were invited by phone call one day before of study, and they were explained that they should not ate at least 12 hours before IC test, and avoid using smoking and alcohol and caffeinated drinks such as, tea also, they should not have intense physical activity before day.
Ethics statement
This study was approved at the Ethical board of the Research Council of Kermanshah University of Medical Sciences (No. KUMS.REC.1395.520). Written consent was obtained from the participants before the start of the study. To protect the privacy and security of their information, participants were ensured that the information would remain confidential.
In the beginning of the study, demographic information of participants was recorded and then participants were going to anthropometric room.
Height measurement
Using the automatic height meter BSM 370 (Biospace Co., Seoul, Korea), the height was measured in a standing position without shoes. The hand of measurement device was automatically lowered slowly over the head of the participant and it was asked to breathe slowly. Height size was recorded with precision of about 0.1 cm.
Weight measurement and body composition
The weight was measured with the lowest clothing and without shoes using the Inbody 770 (Inbody Co., Seoul, Korea) device, while the participant was in a standing position. The weight was recorded a kg with precision of 100 g by the device. This device can measure body composition such as, body fat mass (BFM), percentage of body fat (PBF), and fat free mass (FFM) by using bioimpedance analysis of body; therefore, body composition was recorded by Inbody 770. Body mass index (BMI) was calculated using the weight (kg) divided by a square of the height (m2). We considered BMI < 18.5 kg/m2 as underweight, BMI between 18.5 to 24.99 kg/m2 were considered as individuals with normal BMI, 25–29.9 kg/m2 as overweight, and ≥ 30 kg/m2 as obese [11].
IC
For measurement RMR was used IC by using Fitmate (Cosmed Co., Roma, Italy) device. This device is a portable with dimensions of 20 × 24 cm. It measures the amount of consumed oxygen and EE of the participant in a rest and exercise mode using a mask placed on the nose and mouth. This device measures the ventilation value using one turbine and measures the ratio of oxygen ratio of the exhalation air using an oxygen-sensitive galvanic receptor. RMR was calculated by the Weir equation [12]:
Weir equation (RMR) = (O2 consumption [L] × 3.941) + (CO2 produced [L] × 1.11) × 1.440 min/day.
For IC test, the participant was placed in the sitting mode by using the armchair and in a neutral location in terms of environment temperature and without sounds. Calorimetry was lasted 15 minutes. The first 5 minutes were not counted from measurement time and the next 10 minutes were recorded to calculate EE at rest mode [1314].
EI of 3 food questionnaires
To determine the accuracy of EI, 3 nutritional questionnaires (including Persian cohort FFQ, food habits questionnaire [FHQ], and 24HR) were completed in face to face interview that performed by experienced and trained nutritionist. In order to show the portion size of each of the food items, we used standard images and dishes or the amount that was more familiar to public people for example, the portion size of yogurt is one bowl.
According to the Persian cohort instruction, the questionnaire of each couple was simultaneously completed. However, the separate questionnaire was completed for each participant. The reason was lack of sufficient information by men about of the amount of oil, salt, etc. used in the cooking.
FFQ
The FFQ was a list of common foods used in Kermanshah Province based on the Willett questionnaire structure [15]. This questionnaire was divided into 10 sections: 1, Bread and grains; 2, Beans; 3, Meat and its products; 4, Milk and dairy; 5, Vegetables; 6, Fruits; 7, Types of oils, oilseeds, and butter; 8, Sugars; 9, Other; 10, Spices.
For each of food item it was asked 4 options of daily, weekly, monthly, and yearly. The coefficients of seasonal food, such as, fruits were estimated according to the number of seasons in which the food is available. The FFQ was asked by the RaNCD cohort experts once a year.
Energy and nutrient assessment of FFQ and 24HR
The amount of energy and nutrients received from the 2 questionnaires (FFQ and 24HR) was evaluated by N4 software (based on the United States Department of Agriculture [USDA] food composition adjusted for Iranian foods) [16].
FHQ
The questionnaire includes 160 Iranian foods. In this questionnaire, the food frequency of consumption of each food items was as followed: never or less than once per month, 1 to 3 times per month, once per week, 2 to 4 times per week, 5 to 6 times per week, once per day, 2 to 3 times per day, 4 to 5 times per day, 6 times or more per day. Portion size was categorized 3 options including: small (half of average consumption share), medium (average share of consumption), and large (more than the average share of consumption). Participants were asked to report the frequency and portion size of consumed foods during the previous month.
Nutrient evaluation of FHQ
Specific multi-function (SMF) software was used to reduce the error. First, all pages of each questionnaire were scanned by a HP Scanjet 300 (Hewlett-Packard Development Company, L.P., Houston, TX, USA) and then evaluated using SMF software; finally, this software was used to extract the value of EI in Excel program. This questionnaire and related software were developed by Mashhad University of Medical Sciences [17].
EI reporting
In current study, EI/RMR ratio was used to determine the EI reporting status. This ratio is appropriate for evaluating the accuracy of plausible reporting of FFQ and 24HR. If this ratio was less than and equal to 1.34, it would be considered as EI under-reporting, if it was between 1.34–2.39, the reporting would be considered plausible, and if this ratio is equal to or greater than 2.4, it would be considered as EI over-reporting [18].
Statistical analysis
Data were analyzed using SPSS 20 software (IBM Corp., Chicago, IL, USA). Descriptive statistics (frequency and mean tables) were used to describe the participants' characteristics. Normality of variables was determined by KS test. In order to determine the plausible EI reporting of nutritional questionnaires, we used the EI/RMR cut off. For this purpose, the EI obtained from each of the questionnaires was divided by RMR measured by the IC. Chi square test was used for determined difference of EI reporting status and BMI and demographic data including, gender, educational level and occupation and macronutrient intake. Binary logistic regression in crude and adjusted model was used to assess the association between EI reporting status and anthropometric indices and body composition. In adjusted model, age (continuous), gender (categorical), and physical activity level (categorical) were controlled. Significant level was considered p < 0.05.
RESULTS
In this study 50.8% of participants were men and rest of them were women. 63.6% of participants had the diploma and less educational level. The mean ± standard deviation (SD) of their age were 44.13 ± 6.46 and 43.74 ± 5.25 respectively. According to BMI, 29 of women (50%) and 16 of men (26.7%) were obese (BMI > 30 kg/m2). The mean ± SD of their BFM were 23.21 ± 8.05 (kg) and 33.47 ± 10.29 (kg), respectively. Anthropometric indices and body composition of participants were presented in Table 1.
Table 1
Anthropometric indices and body composition of participants in RaNCD study
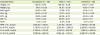
All values are means ± standard deviations.
RaNCD, Ravansar Non-Communicable Chronic Disease; BMI, body mass index; BFM, body fat mass; FFM, fat free mass; PBF, percent body fat; WHR, waist-hip ratio; RMR, resting metabolic rate; IC, indirect calorimetry; EI, energy intake; FFQ, food frequency questionnaire; 24HR, 24-hour recall; FHQ, food habits questionnaire.
![]()
Regarding EI/RMR, the highest frequency of plausible report of EI was related to the FFQ (67.8%) and the lowest plausible report of EI was related to FHQ (36.4%). The lowest plausible report of EI was related to FHQ (56.8%). Characteristics of participants based on EI reporting status by using 3 nutritional questionnaires were presented in Table 2. Using χ2 test, it was observed that significant difference between gender, educational level and BMI variables with EI of 24 HR questionnaire (p = 0.003, 0.001, and 0.005, respectively), but there was no significant difference between occupation and EI of 24HR questionnaire (p = 0.182). Also, these variables had no significant difference with EI of FFQ and FHQ (Table 2).
Table 2
Characteristics of participants by reporting status on questionnaires in RaNCD study
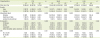
The p value was calculated χ2 test.
RaNCD, Ravansar Non-Communicable Chronic Disease; FFQ, food frequency questionnaire; 24HR, 24-hour recall; FHQ, food habits questionnaire; LR, low reporting; PR, plausible reporting; HR, high reporting; BMI, body mass index.
![]()
Multivariable-adjusted odds ratios and 95% confidence intervals for implausible EI reporting across anthropometric indices and body composition of participants were indicated in Table 3. We observed that a significant association between EI underreporting of 24HR and weight, BMI and BFM in crude and adjusted model (adjusted for age, gender and physical activity) (Figure 1) but no significant association between EI underreporting of 24HR and other presented variable in Table 3 even after adjusted for age, gender and physical activity. Also, no significant association was seen between anthropometric indices and body composition of participants and EI underreporting of 2 other questionnaires (FFQ and FHQ). No significant association was found with stunting after adjusting for confounders (Table 3).
Table 3
Multivariable-adjusted odds ratios and 95% confidence intervals for EI underreporting across anthropometric indices and body composition
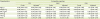
FFQ, food frequency questionnaire; 24HR, 24-hour recall; FHQ, food habits questionnaire; LR, low reporting; PR, plausible reporting; HR, high reporting; BMI, body mass index; BFM, body fat mass; FFM, fat free mass; WHR, waist-hip ratio.
*In adjusted model, age, gender and physical activity were controlled.
![]()
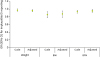 | Figure 1Multivariable-adjusted ORs and 95% CIs for EI underreporting of 24HR across weight, BMI, and BFM. In adjusted model, age, gender, and physical activity were controlled.OR, odds ratio; CI, confidence interval; EI, energy intake; 24HR, 24-hours recall; BMI, body mass index; BFM, body fat mass.
|
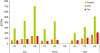
Our finding about macronutrients (protein, fat, and carbohydrate) showed that there was a significant association between EI reporting and macronutrients intake (p < 0.001). Based on these finding under reporters consumed fewer macronutrients and over reporters consumed more macronutrients (Figure 2).
DISCUSSION
In our study, we observed among the 3 nutritional questionnaires, FFQ had more accuracy for estimating the EI. The EI underreporting of FFQ was less than 2 questionnaires (24HR and FHQ). Also, Jian et al. [19] by using the EI/BMR, the EI plausible reporting was 76%, and they introduced that the developed questionnaire was appropriated for EI evaluation. Another study by Markussen et al. [3], despite lower rate of EI under-reporting compared to other studies (18%), they have considered EI under-reporting effective in the relationship between diet and diseases. Because many investigators for determine this relationship, did not consider plausible EI reporting in their study; therefore; it can cause incorrect result in many studies.
Rate of EI under-reporting in Shaneshin et al. [7] and Mirmiran et al. [20] studies was higher than our study which could be due to the greater confidence of people in RaNCD study and more accurate and more realistic answers to questions. Face to face questioning and using standardized images and containers to show the portion size of each food item can increase the report accuracy of EI intake in studies.
In our study, EI under-reporting rate of FHQ developed by Mashhad University of Medical Sciences was higher compared to 2 other nutritional questionnaires. Consist of our finding Nematy et al. [17] who examined the validity of this questionnaire. In their study, they reported that the FHQ has been validated just for report of carbohydrate intake. Using of food items, which are not commonly used in Kermanshah Province and the lack of foods, used customary in this province can lead to EI underreporting of FHQ. Underreporting usually occurs by using nonnative nutritional questionnaires [20]. As items of this questionnaire are cooked food, difference in the method of cooking is also effective in this regard; therefore, this questionnaire cannot be used to estimate the plausible EI in our province, while the method of analysis of this questionnaire is favorable and the error rate for data entry is reduced.
EI underreporting of 24HR was high in our study. This questionnaire did not show EI over reporting. In consistent with these results Hare et al. [21] showed that EI under-reporting of 24HR increased by 48% at the beginning of the study, 61% at month 12, and 66% at month 24, and EI underreporting was high in participants with obesity and overweight.
Also, in the study conducted by Tooze et al. [2], they investigated the EI underreporting in 24HR questionnaire and 3 FFQs developed on 94 participants in the United States. It was found that the EI underreporting rate of 24HR was higher than FFQs (43% in men and 40% in women) and EI underreporting showed significant association with obesity and overweight (p < 0.05).
Our findings observed that EI underreporter of 24HR were likely overweight, and they had low educational level. The high age and low level of education can effect on reminding that lead to EI underreporting and non-realistic estimation of diet intake [2]. In many studies, obesity has been reported as one of the most effective factors in underreporting. In addition, low socioeconomic status, smoking, education level, and those who have a weight loss diet were also reported as other related factors [22122].
In this study, it was showed that EI implausible reporters effect on their macronutrient intake. Most people with obesity and overweight tend to underreport of EI and hide the intake of unhealthy foods, such as fat intake and refined carbohydrates [2324].
Regarding the association of many chronic diseases with obesity, researchers will be confused to find the correct relationship between diet and chronic diseases [20]; therefore, to evaluate the diet status and its association with health and disease, more reliable and accurate tool is required. Our findings showed that the FFQ, developed by the RaNCD cohort and native foods were added to it, therefore; it was an appropriate approach for EI determination.
One of the main advantages of using FFQ is the relative ease in the implementation of large cohort studies. This questionnaire can be used to assess the usual food intake over a longer period, and its completion is more cost effective in terms of cost and time [125].
Our study suffered from some limitations, including the impossibility of direct calorimetry due to financial restrictions and the need for special skills. Also, limiting access to the participants, which were limited the number of referrals, non-coordination and precision of the participants to time and date of referral to the center, which caused disorder in sampling and prolongation of the study period.
CONCLUSION
Based on this study results, it seems that FFQ is a useful tool to report EI in this population. FHQ and 24HR questionnaires are not recommended due to the high rate of EI underreporting in this study. Regarding the desirable method used to evaluate the FHQ, it is recommended to use the method used in the FHQ to minimize errors when entry of the information to evaluate the FFQ information. In addition, online applications and software can be used rather than face-to-face interviews to reduce implausible reporting errors of 24HR; therefore, the evaluated participants describe their intake situation more accurately.
 XML Download