

 PDF
PDF ePub
ePub Citation
 Print
Print


INTRODUCTION
International migration to Korea has been increasing rapidly in recent years. There were 6,945 cases of marriage between Korean men and foreign women in 2000, and this number increased by 214% to 14,869 cases in 2017. Vietnamese women account for the second most international marriages to Korean men after Chinese women, with 38,872 marriages to Korean men recorded in 2016 [1].
Lifestyle and dietary habits change in response to a shift in residence [2]. This may be because immigrants are responsible for housework and preparing meals, and have less access to food than in their home country [2]. Vietnamese immigrants may find it difficult to adapt to the dietary habits of Koreans because cooking methods and eating patterns are complicated relative to those in Vietnamese culture. In addition, Vietnamese usually prepare 2 meals a day, whereas Koreans prepare 3 meals a day [3].
Therefore, Vietnamese women who migrate to Korea have been found to have poor nutrient intake [2]. A previous study reported that Vietnamese women immigrants consumed only 1,490 kcal a day, which is lower than recommended by both Vietnamese and Korean dietary guidelines. Furthermore, more than 50% of the Vietnamese women immigrants were found to consume lower levels of calcium, iron, vitamin A, vitamin B2, vitamin C, and folic acid according to Korean dietary guidelines [4]. Consequently, Vietnamese woman immigrants to Korea face the nutritional problems of malnutrition, obesity, metabolic syndrome, in addition to other chronic diseases [2]. Only a few studies, however, have investigated changes in the dietary quality of Vietnamese women immigrants and how the dietary quality of these immigrants compares to that of Korean women. Moreover, the relationship between dietary quality and body fat in Vietnamese women immigrants has not been explored.
Here, we compared dietary intake information of Vietnamese women immigrants with that of Korean women. We also examined changes in dietary quality before and after immigration of Vietnamese women.
MATERIALS AND METHODS
Subjects
Fifty-six Vietnamese women immigrants and 56 age-matched Korean women were recruited from the central office for multicultural family support in Seoul and self-help-Vietnamese women immigrants groups from October to November 2009. All participants provided written informed consent.
General characteristics and anthropometric measurements
Information regarding the general characteristics of participants (age, occupation, length of residence in Korea, level of linguistic competence [Korean], monthly income, living status, smoking, alcohol, exercise) was collected by a trained researcher. We classified immigrants into 3 groups based on their length of residence in Korea: short length, ≤ 1 year; medium length, 2–3 years; and long length, ≥ 4 years. Height, weight, body fat percent, and waist-hip circumferences (waist to hip ratio [WHR]) were measured using INBODY 720 (Biospace Co., Seoul, Korea).
Dietary assessment
Dietary intake of Vietnamese immigrants before and after immigration to Korea as well as that of Korean women was assessed using 24-hour recall. Dietary data were coded by a trained dietitian and nutrient analysis was carried out using the Computer Aided Nutritional analysis program 4.0 (Korean Nutrition Society, Seoul, Korea). If food items were not available, food ingredients were searched for in the United States Department of Agriculture (USDA) Food Search database, and Pacific Islands food composition tables were used.
Measurements of diet quality
Diet quality was measured from 24-hour recalls. To assess diet quality, the modified diet quality index-international (DQI-I) was used [5]. DQI-I is composed of 4 categories: variety (overall food group variety and protein source variety; range, 0–20 points), adequacy (consumption of vegetables, fruits, grains, fiber, protein, iron, calcium, and vitamin C; range, 0–40 points), moderation (consumption of total fat, saturated fat, cholesterol, sodium, and empty calorie foods; range, 0–30 points), and overall balance (macronutrient ratio and polyunsaturated fatty acids [PUFA]:monounsaturated fatty acids [MUFA]:saturated fatty acids [SFA] ratio; range, 0 to 10 points). To determine DQI-I, values of each component were summarized in the 4 main categories. Then all values were added together to calculate the DQI-I score (range, 0–100).
Nutrient density was assessed using the index of nutritional quality (INQ), which is the ratio of the nutrient-to-calorie content of foods. We calculated the INQ of each nutrient using the following formula [6]: INQ = consumed amount of a nutrient per 1,000 kcal/recommended nutrient intake (RNI) or adequate intake (AI) of that nutrient per 1000 kcal as part of the dietary reference intakes (DRIs).
To use diet diversity as an indicator of dietary quality, a dietary diversity score (DDS) and GMVDF were calculated. DDS is the number of food groups (dairy, meat, grain, fruit, and vegetable) consumed in a day (range, 1–5) [6]. GMVDF reflects the pattern of food groups eaten (grain, meat, vegetables, dairy, and fruit) where 1 = food group present and 0 = food group absent. For example, GMCDF = 11111 donates that all 5 food groups are present [7]. Reference amount of solid foods such as cereals, fish, vegetables, fruits was 30 g, that of solid dairy products (cheese, etc.) was 15 g, and that of liquid dairy products, fruits, and vegetables was 60 g per day [6].
Dietary habits
Dietary habits were assessed using a questionnaire that evaluates 4 key dietary factors: 1) prudent dietary habits, reflecting general nutrition balance; 2) calorie control dietary habits related to weight loss and gain; 3) fat control dietary habits referring to moderation of cholesterol in the diet; and 4) sodium or salt control dietary habits, which affect blood pressure. Each category comprises 6 items worth 4 points (total of 24 points). The worse the dietary habit, the higher the score. The standard cutoff values were as follows: 6–8: excellent; 9–12: good; 13–16: fair; 17–20: poor; 21–24: very poor. Higher total score indicates a worse nutrition assessment state [8].
Statistical analysis
Statistical analyses were performed using Statistical Package for the Social Sciences (SPSS version 20.0; SPSS Inc., Chicago, IL, USA) software. Initial analyses included Student's t-test to compare means of continuous data (socio-demographic data, anthropometric data, and dietary data) between groups and are expressed as means ± standard deviations (SDs). To assess the effect of length of residence in Korea on the INQ of Vietnamese women immigrants, one-way analysis of variance (ANOVA) and Duncan's multiple range test were used. Proportions were compared using χ2 tests. Pearson correlation analyses was conducted between the INQ of nutrients and body fat percent in Vietnamese women immigrants. A p value < 0.05 was considered significant.
RESULTS
Socio-demographic characteristics and health behaviors
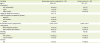
The socio-demographic characteristics and heath behaviors of the subjects are shown in Table 1. The mean age of Vietnamese woman immigrants was 26.8 ± 6.7 years. Most (80%) of the Vietnamese woman immigrants were housewives, whereas 90% of the Korean woman were office workers. Mean length of residence in Korea was 2.3 ± 1.4 years. Eighty-four percent of Vietnamese woman immigrants could speak Korean at an intermediate level. Mean monthly income (USD 1,870 ± 374.3) of Vietnamese women was significantly lower than that of Korean women (USD 3,035 ± 712.5).
Table 1
Socio-demographic characteristics and health related behaviors of Vietnamese women immigrants and Korean women
Anthropometric measurements
Anthropometric measurements are shown in Table 2. Vietnamese women immigrants weighed less and were shorter than Korean women (154.9 ± 5.6 cm and 53.9 ± 7.8 kg vs. 160.2 ± 1.8 cm and 57.2 ± 8.7 kg, respectively; p < 0.05 for both). Body weight gain after immigration in Vietnamese women was 5.1 ± 4.9 kg. There were no differences in body mass index (BMI) according to groups; 5.4% of Vietnamese women immigrants were underweight and 48.2% were overweight, whereas there were no underweight Korean women, and 25% were overweight. Vietnamese women immigrants had higher waist and hip circumferences, WHR, and body fat percentages than Korean women (p < 0.001).
Table 2
Anthropometric measurements in Vietnamese women immigrants and Korean women
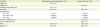
Values are means ± standard deviation or number (%).
BMI, body mass index; WHR, waist to hip ratio.
Significantly different between groups by Student's t-test, and χ2 test for categorical variables at *p < 0.05, at †p < 0.01, ‡p < 0.001; §Changes in body weight before and after immigration were based on self-report.
Nutrient intake
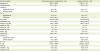
A comparison of the nutrient intake of Vietnamese women immigrants and Korean women is presented in Table 3. Mean energy intake values of Vietnamese women immigrants and Korean women were 1,570.0 ± 223.6 kcal/d and 1,664.7 ± 112.1 kcal/d, respectively, which was not a statistically significant difference. Dietary protein to energy ratio of Vietnamese women was 78.4% of that of Korean women. Vietnamese women immigrants consumed less vegetable proteins (28.9 ± 8.1 g/d), vegetable fats (9.9 ± 4.1 g/d), cholesterol (171.7 ± 93.2 g/d), vitamin A (429.7 ± 230.0 μgRE/d), vitamin B6 (1.5 ± 0.5 mg/d), folate (149.5 ± 37.1 μg/d), vegetable calcium (185.8 ± 51.9 g/d), sodium (3,210.3 ± 918.6 mg/d), potassium (1,765.1 ± 390.0 mg/d), fiber (13.1 ± 2.8 g/d), vitamin C (50.4 ± 21.2 mg/d), and vitamin E (7.6 ± 2.7 mg/d) than Korean women (p < 0.05).
Table 3
Nutrient intake of Vietnamese women immigrants and Korean women
Dietary quality
Dietary quality of Vietnamese women before and after immigration and those of Korean women are shown in Table 4. The DQI-I score of Vietnamese women decreased after immigration, particularly those who had been in the country for a medium amount of time (23.7 ± 3.8), although variety score increased after a medium length of stay in Korea (10.2 ± 4.9). The mean DQI-I score of Vietnamese women immigrants (45.1 ± 8.2) was significantly lower than that of Korean women, especially the variety (10.2 ± 4.9), adequacy (10.5 ± 3.5), and overall balance (0.6 ± 1.3) scores (p < 0.001).
Table 4
Dietary quality of Vietnamese women before and after immigration and that of Korean women
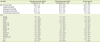
Values are means ± standard deviation.
DQI-I, diet quality index-international; INQ, index of nutritional quality.
Significantly different between Vietnamese women immigrants and Korean women by Student's t-test at *p < 0.01 and †p < 0.001; Significantly different before and after immigration among Vietnamese women by Student's t-test at ‡p < 0.05, §p < 0.01, and ∥p < 0.001; ¶DQI-I scores are the sum of the 4 categories used to assess diet quality; 0 (poor diet quality)–100 (excellent diet quality).
Vietnamese women after immigration had higher INQs for most nutrients except for vitamin B1 than before immigration (p < 0.001). However, Vietnamese women immigrants had lower INQs of most nutrients than Korean women (p < 0.001).
Diet diversity and dietary habits
The diet diversity and dietary habits of Vietnamese women before and after immigration and those of Korean women are shown in Table 5. The DDS score of Vietnamese women was lower after immigration than before immigration (p < 0.05). Vietnamese who consumed 5 food groups increased 2-fold, but who consumed 3 food groups increased sharply (by up to 4-fold) after immigration.
Table 5
Diet diversity and dietary habits of Vietnamese women before and after immigration and that of Korean women
Values are means ± standard deviation or number (%).
DDS, dietary diversity score; GMVDF, grain, meat, vegetables, dairy, fruit.
Significantly different between Vietnamese women immigrants and Korean women subjects by Student's t-test at *p < 0.05 and †p < 0.001; ‡DDS: Dietary diversity score counts the number of food groups consumed daily from major 5 food groups (grain, meat, vegetable, dairy, fruit); §1: Food group is present, 0: Food group is absent, i.e., GMVDF = 11111 donates that all 5 food groups are present; ‖Dietary habit assessed a questionnaire that involves 4 key dietary factors: prudent dietary habits reflecting general nutrition balance; calorie control dietary habits related to weight loss and gain; fat control dietary habits reflecting moderation of cholesterol in the diet; sodium or salt control dietary habits, which affect blood pressure. Score are ranging from 6 (excellent) to 24 (very poor). As dietary habits were not assessed for Vietnamese women before migration, it could not compared before and after migration.
In Vietnamese women, 7.1% of women before immigration and 32.1% of women after immigration did not consume milk and fruit (GMVDF = 11100), respectively, while 21.4% of Korean women did not consume milk and fruits. As shown in Table 5, Vietnamese women immigrants had a higher prudent diet score (22.5 ± 1.2) and calorie control score (15.5 ± 1.1) than Korean women, but a lower fat control score (10.4 ± 1.6) and sodium control score (6.2 ± 1.1) than Korean women (p < 0.05). As dietary habits were not assessed in Vietnamese women before migration, it could not compared before and after migration.
Dietary quality of Vietnamese women immigrants according to length of residence in Korea
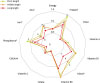
The dietary quality of Vietnamese women immigrants according to length of residence in Korea is shown in Figure 1. Those immigrants who had lived longer in Korea had lower INQ values for protein (short stay: 1.4 ± 0.2, medium length stay: 1.2 ± 0.2, and long length stay: 1.0 ± 0.2) niacin (short stay: 1.1 ± 0.4, medium length stay: 1.0 ± 0.3, and long length stay: 0.7 ± 0.2), phosphorus (short stay: 1.1 ± 0.1, medium length stay: 1.0 ± 0.2, and long length stay: 0.8 ± 0.1), iron (short stay: 0.7 ± 0.1, medium length stay: 0.6 ± 0.1, and long length stay: 0.5 ± 0.1), zinc (short stay: 0.9 ± 0.1, medium length stay: 0.9 ± 0.1, and long length stay: 0.7 ± 0.1) (p < 0.05).
Figure 1
Index of nutritional quality of Vietnamese women immigrants according to length of residence in Korea. Immigrants were classified into 3 groups based on length of residence in Korea: short length group, ≤ 1 year; medium length group, 2–3 years, long length group, ≥ 4 years.
ANOVA, analysis of variance.
Significantly different among groups by ANOVA and Duncan's multiple range test at *p < 0.05, †p < 0.01, and ‡p < 0.001; Superscript uppercase letters indicate values that were significantly different between groups (p < 0.05).
Correlations between INQ and percent body fat
Results of correlation analyses between INQ and percent body fat are reported in Table 6. INQ values for protein, fiber, vitamin A, vitamin B1, B6, folate, vitamin C, and phosphorus were negatively related to percent body fat in Vietnamese women immigrants (γ = −0.204, −0.310, −0.231, −0.341, −0.417, −0.310, −0.233, and −0.243, respectively; p < 0.05).
Table 6
Correlations between INQ and percent body fat among Vietnamese women immigrants
DISCUSSION
We examined whether Vietnamese women immigrants have lower dietary quality after migration compared to before migration and compared findings in Vietnamese women immigrants to age-matched Korean women. Vietnamese women immigrants had lower DQI-I scores after immigration and relative to Korean women. In addition, Vietnamese women immigrants had higher INQ values for most nutrients after immigration than prior to immigration; however, their INQ values were significantly lower than those of Korean women. The longer the length of stay in Korea, the worse the INQs for protein, niacin, phosphorus, iron, and zinc. Moreover, we found that lower INQs of protein, fiber, vitamin A, vitamin B1, B6, folate, vitamin C, and phosphorus were related to higher percent body fat in Vietnamese women immigrants in Korea. The risk of obesity was found to be higher in Vietnamese women after immigration [4]; this trend can partially be explained by the decrease in dietary quality after immigration.
Our findings are consistent with other studies that reported a decrease in dietary quality after immigration [91011]. In the current study, Vietnamese women immigrants had decreased DQI-I and moderation scores, as well as a decreased DDS score, which indicates dietary adequacy, after immigration than before immigration, even though the variety score of DQI-I increased. A possible explanation for the increase in variety score may be that the quality of protein intake was included, even though overall diet quality decreased with immigration in Korea.
An earlier study reported less acculturated South Asian Americans had a lower diet quality and greater incidence of metabolic syndromes than more accultured South Asian Americans [10]. A previous study reported that Vietnamese women immigrants have little opportunity to eat Vietnamese food and more than 80% of subjects consume Korean dishes at every meal [11]. It is possible that diet diversity and dietary quality in food insecure immigrant households may be compromised by limited access to favored Vietnamese foods, financial difficulties, and circumstances requiring the consumption of unfamiliar Korean foods, which may lead to poorer health outcomes [911]. Food insecurity remains an important public health issue in immigrant households [9].
To our knowledge, few previous studies have investigated differences in the nutritional intake and dietary habits of Vietnamese women before and after immigration, or compared the nutritional intake and dietary habits of Vietnamese women immigrants in Korea with those of Korean women. Our results suggest that Korean women have better nutritional intake overall than immigrant Vietnamese women. In addition, our study revealed that Vietnamese women immigrants need to balance their diet and control calorie intake to maintain weight gain, although these women showed better fat and sodium control than Korean women. These results are consistent with less intake of sodium by Vietnamese women than Korean women, as well as lower consumption of vegetable fat and cholesterol than Korean women.
Our results are consistent with a previous study that reported that most Vietnamese women immigrants experience dietary changes after immigrations, and that energy, calcium, iron, vitamin A, vitamin B2, vitamin C, and folic acid intake is lower than recommended by the Vietnamese and Korean nutritional guidelines [4]. When we evaluated INQ after immigration, we found that consumption of several nutrients such as fiber, vitamin A, folate, vitamin C, calcium, iron, and zinc were low, even though intake of most nutrients increased significantly after immigration. Our findings suggest that Vietnamese immigrants experience favorable changes in INQs of most nutrients and that they consume a greater variety of food types (overall food group variety and within-group variety in protein source) after immigration. However, the decrease in total DQI-I score and DDS score, which reflects a decrease in overall diet quality and food group diversity indicates some unfavorable changes despite the improvement in nutritional quality and food group variety.
INQs of protein, iron, zinc, phosphorus, vitamin B6, and niacin decreased according to length of residence, which contrasts with what was found in previous research [4]. This discrepancy may have been due to our use of INQ as a tool, which allowed us to modify nutrient intake based on energy intake for more accurate comparison between groups. The longer the period of residence in Korea, the poorer the dietary quality became. Thus, strong attention should be paid to good nutrition in Vietnamese women immigrants in Korea.
The correlations between INQ and percent body fat in Vietnamese women immigrants suggests that obesity in Vietnamese women immigrants could be related to diet quality. Vietnamese immigrants had significantly greater WHRs and body fat percentages than Korean subjects, similar to what was reported for percent body fat of married immigrants in Daegu [12]. A previous study reported that the prevalence of being overweight or obese and of chronic diseases is increasing in immigrants due to changes in dietary habits [2]. Therefore, early prevention is required [13].
This is the first study to examine changes in dietary quality using DQI-I, INQ, DDS, and other tools in Vietnamese women before and after their immigration to Korea, and to compare these findings with those of age-matched Korean women. Another strength of our study is that diet quality, percent body fat, and the relationship between these variables were assessed, which is crucial when translating these findings into clinical care of Vietnamese women.
The present study had several limitations. First, it was a cross-sectional study, which precluded inference of causation. Second, dietary intake was estimated based on single or 2 day 24-hour recall, which might not have been representative of a subject's typical intake. Third, lack of data in the food composition database may have resulted in underestimation of intake. Fourth, we recruited age-matched subjects but could not match subjects for other factors such as occupation and income between groups. Furthermore, all comparisons were analyzed without adjustment for confounding variables. Lastly, present study had limitation to the interpretation of results for changes in variables before and after immigration because it was statistically compared as 2 groups, and the data access is limited at the present time.
In conclusion, dietary quality of Vietnamese immigrants decreased after immigration, and dietary intake was inadequate compared with that of Korean women. Prudent diet habits and calorie control habits of Vietnamese women immigrants were poorer than those of Korean women, although fat and sodium control habits were better. Dietary quality of Vietnamese decreased with length of residence in Korea. Lower dietary quality was related to higher percent body fat among Vietnamese women immigrants. Finding from this study may help improve diet quality and decrease obesity in Vietnam women immigrants. Further studies should investigate associations between dietary quality and health-related factors. Registered dietitians and public health nutritionists should provide Vietnamese women immigrants with advice not only on individual nutrient intake and health, but also foods that can improve their diet quality.
 XML Download