

 PDF
PDF ePub
ePub Citation
 Print
Print


Abstract
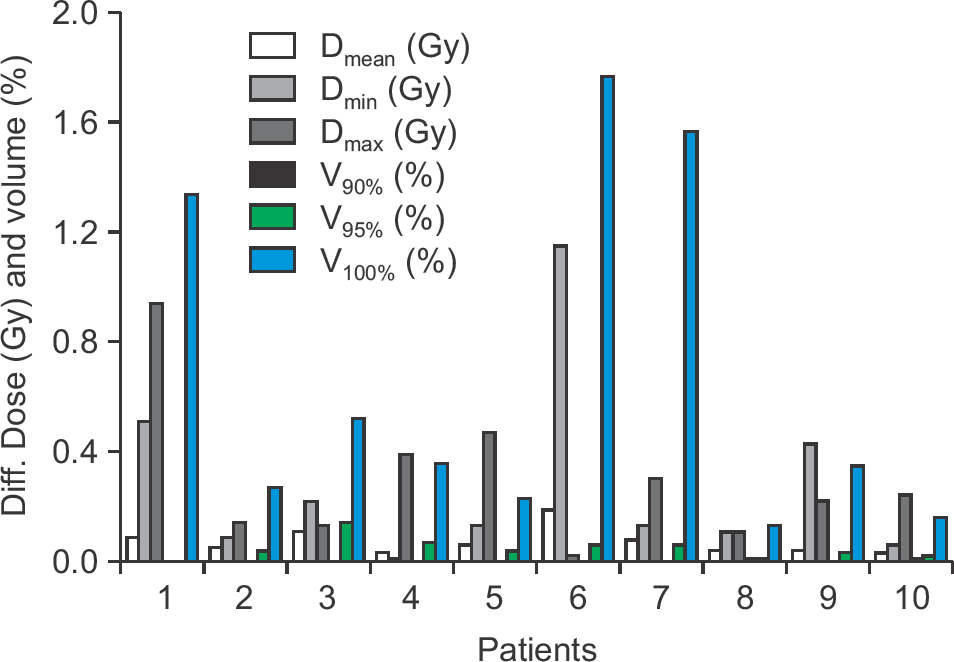
To investigate the effect of low magnetic field on dose distribution in SABR plans for liver cancer, we calculated and evaluated the dose distribution to each organ with and without magnetic fields. Ten patients received a 50 Gy dose in five fractions using the ViewRay® treatment planning system. For planning target volume (PTV), the results were analyzed in the point minimum (Dmin), maximum (Dmax), mean dose (Dmean) and volume receiving at least 90% (V90%), 95% (V95%), and 100% (V100%) of the prescription dose, respectively. For organs at risk (OARs), the duodenum and stomach were analyzed with D0.5cc and D2cc, and the remained liver except for PTV was analyzed with Dmean, Dmax, and Dmin. Both inner and outer shells were analyzed with the point Dmin, Dmax, and Dmean, respectively. For PTV, the maximum change in volume due to the presence or absence of the low magnetic field showed a percentage difference of up to 0.67±0.60%. In OAR analysis, there is no significant difference for the magnetic field. In both shell structure analyses, although there are no major changes in dose distribution, the largest value of deviation for Dmax in the outer shell is 2.12±2.67 Gy. The effect of low magnetic field on dose distribution by a Co-60 beam was not significantly observed within the body, but the dose deposition was only appreciable outside the body.
Go to : 
References
1. Torre LA, Bray F, Siegel RL, Ferlay J, Lortet‐Tieulent J, Jemal A. Global cancer statistics, 2012. CA: a cancer journal for clinicians. 2015; 65(2):87–108.

2. Huang K, Dahele M, Senan S, et al. Radiographic changes after lung stereotactic ablative radiotherapy (SABR)-can we distinguish recurrence from fibrosis? A systematic review of the literature. Radiotherapy and Oncology. 2012; 102(3):335–42.
3. Finkelstein SE, Timmerman R, Mcbride WH, et al. The confluence of stereotactic ablative radiotherapy and tumor immunology. Clinical and Developmental Immunology. 2011; 2011.
4. Myrehaug S, Sahgal A, Russo SM, et al. Stereotactic body radiotherapy for pancreatic cancer: recent progress and future directions. Expert review of anticancer therapy. 2016; 16(5):523–30.
5. Pidikiti R, Stojadinovic S, Speiser M, et al. Dosimetric characterization of an imageguided stereotactic small animal irradiator. Physics in Medicine & Biology. 2011; 56(8):2585.
6. Palma DA, Haasbeek CJ, Rodrigues GB, et al. Stereotactic ablative radiotherapy for comprehensive treatment of oligometastatic tumors (SABR-COMET): study protocol for a randomized phase II trial. BMC cancer. 2012; 12(1):305.
7. Mutic S, Dempsey JF. The ViewRay system: Magnetic resonance-guided and controlled radiotherapy. Seminars in radiation oncology: Elsevier. 2014. 196–99.
8. Yang Y, Cao M, Sheng K, et al. Longitudinal diffusion MRI for treatment response assessment: Preliminary experience using an MRI‐guided tri‐cobalt 60 radiotherapy system. Medical physics. 2016; 43(3):1369–73.
9. Wooten HO, Rodriguez V, Green O, et al. Benchmark IMRT evaluation of a Co-60 MRI-guided radiation therapy system. Radiotherapy and Oncology. 2015; 114(3):402–5.
10. Burke B, Ghila A, Fallone B, Rathee S. Radiation induced current in the RF coils of integrated linac‐MR systems: The effect of buildup and magnetic field. Medical physics. 2012; 39(8):5004–14.
11. Rubinstein AE, Liao Z, Melancon AD, et al. A Monte Carlo study of magnetic‐field‐induced radiation dose effects in mice. Medical physics. 2015; 42(9):5510–16.
12. Kirkby C, Stanescu T, Fallone B. Magnetic field effects on the energy deposition spectra of MV photon radiation. Physics in Medicine & Biology. 2008; 54(2):243.
13. Raaijmakers AJ, Raaymakers BW, Lagendijk JJ. Integrating a MRI scanner with a 6 MV radiotherapy accelerator: dose increase at tissue-air interfaces in a lateral magnetic field due to returning electrons. Phys Med Biol. 2005; 50(7):1363–76.
14. Raaijmakers AJ, Raaymakers BW, Van Der Meer S, Lagendijk JJ. Integrating a MRI scanner with a 6 MV radiotherapy accelerator: impact of the surface orientation on the entrance and exit dose due to the transverse magnetic field. Phys Med Biol. 2007; 52(4):929–39.
15. Kim JI, Park SY, Lee YH, Shin KH, Wu H-G, Park JM. Effect of low magnetic field on dose distribution in the partial-breast irradiation. Progress in Medical Physics. 2015; 26(4):208–14.
16. Esmaeeli A, Pouladian M, Monfared A, Mahdavi S, Mosle-mi D. Effect of uniform magnetic field on dose distribution in the breast radiotherapy. International Journal of Radiation Research. 2014; 12(2):161.
Go to :
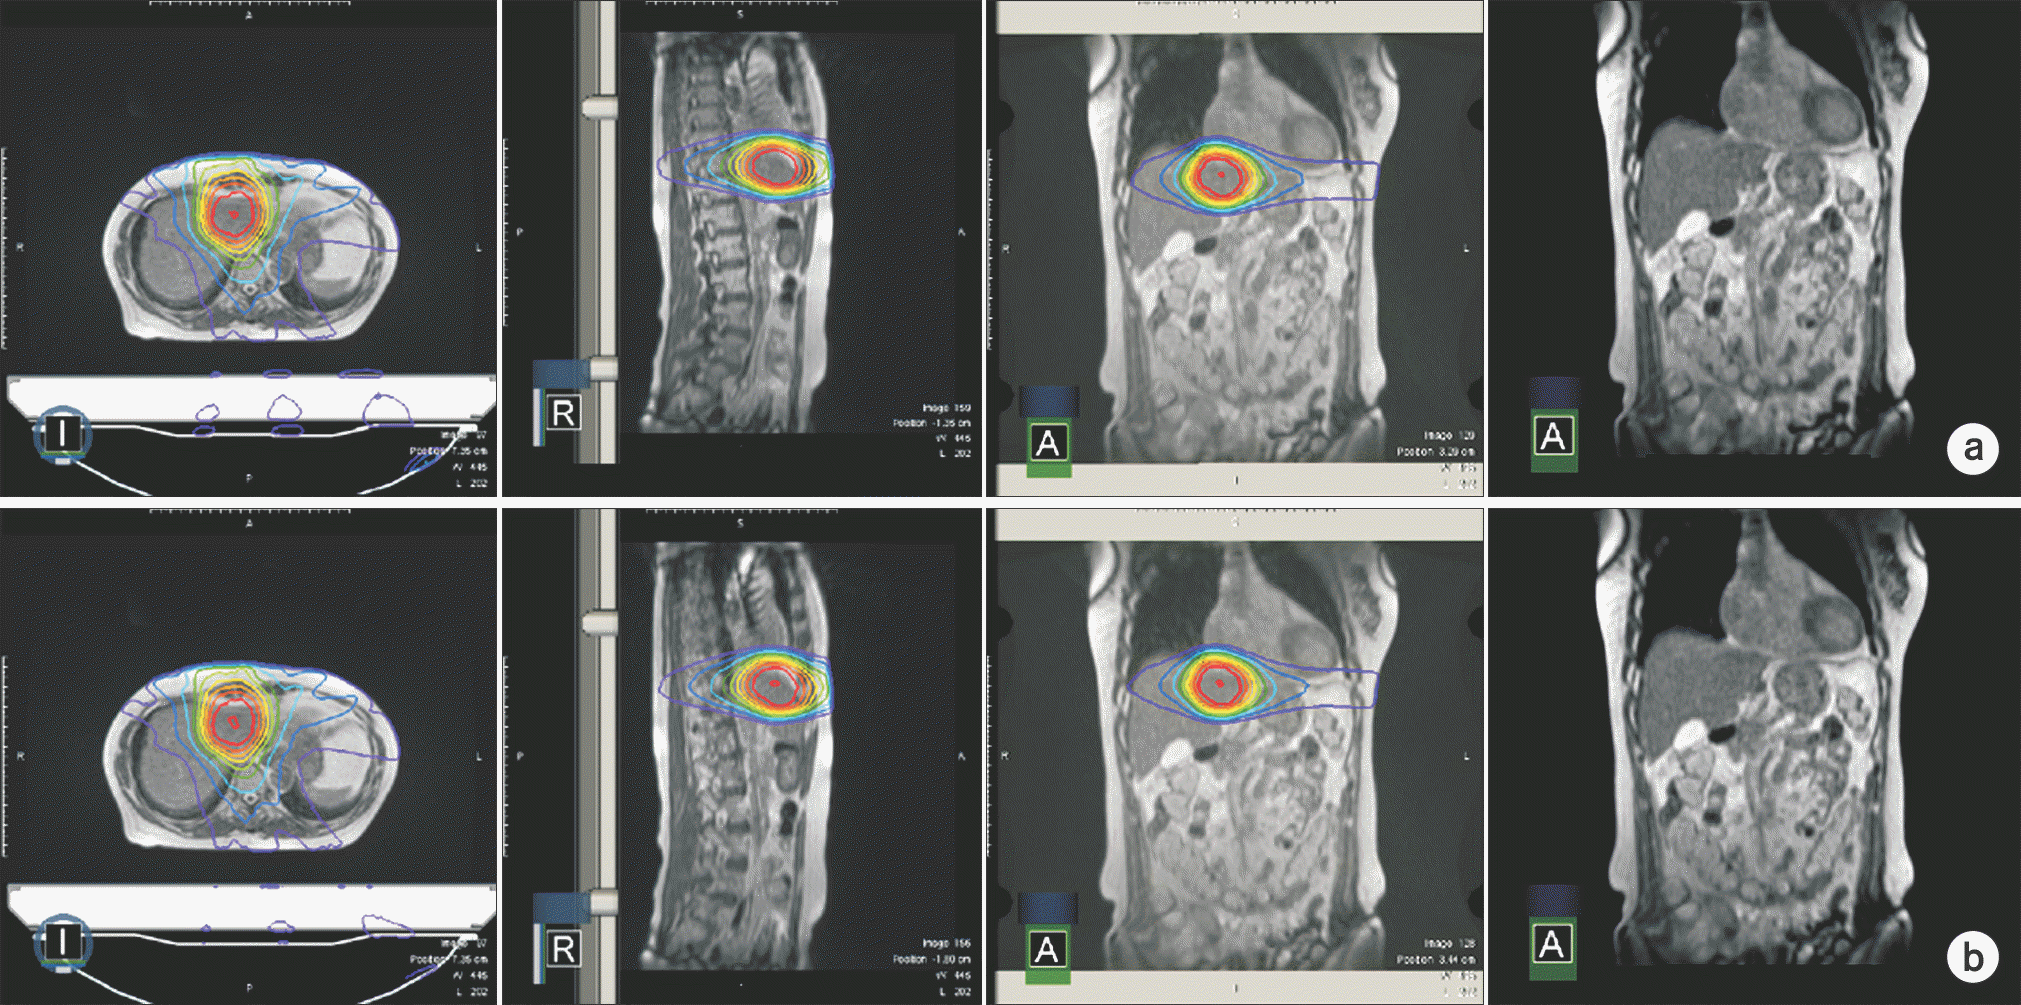 | Fig. 1.The comparison of dose distribution (a) with magnet and (b) without magnet field in the case of liver SABR with a magnet field (B0). |
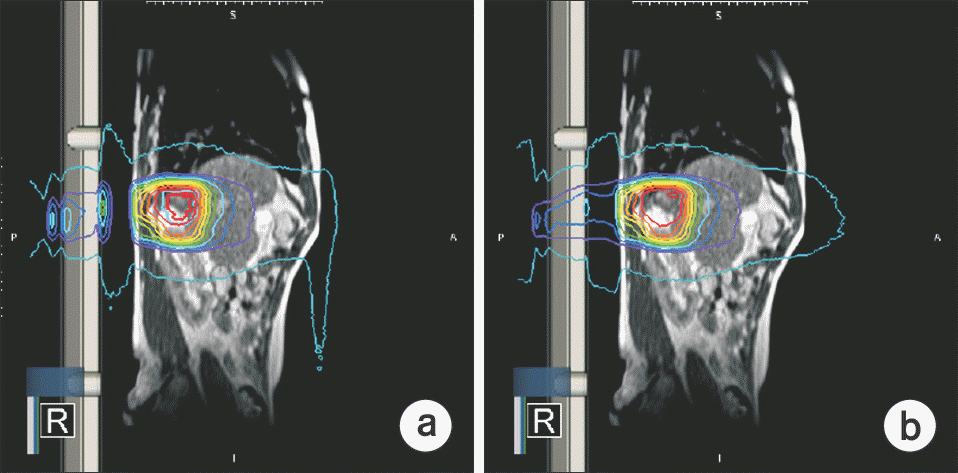 | Fig. 3.The dose distribution in sagittal image between (a) with magnet field (B0) and (b) without magnet field. |
Table 1.
The average dosimetric parameter analysis for PTV.
Table 2.
The average dosimetric parameter analysis for organs at risk (OARs).
Table 3.
The average dosimetric parameter analysis for shell structures.
 XML Download