Abstract
Objective
This study examined the relationship between neutrophil-to-lymphocyte ratio (NLR), platelet-to-lymphocyte ratio (PLR), mean platelet volume (MPV), and rheumatoid arthritis (RA), to establish a correlation among the NLR, PLR, and MPV and RA activity.
Methods
Medline, Embase, and Cochrane were searched, and a meta-analysis was performed to compare the NLR, PLR, and MPV between RA patients and healthy controls. The correlation coefficients between NLR, PLR, and MPV and the Disease Activity Score 28 (DAS28) in the RA patients were examined.
Results
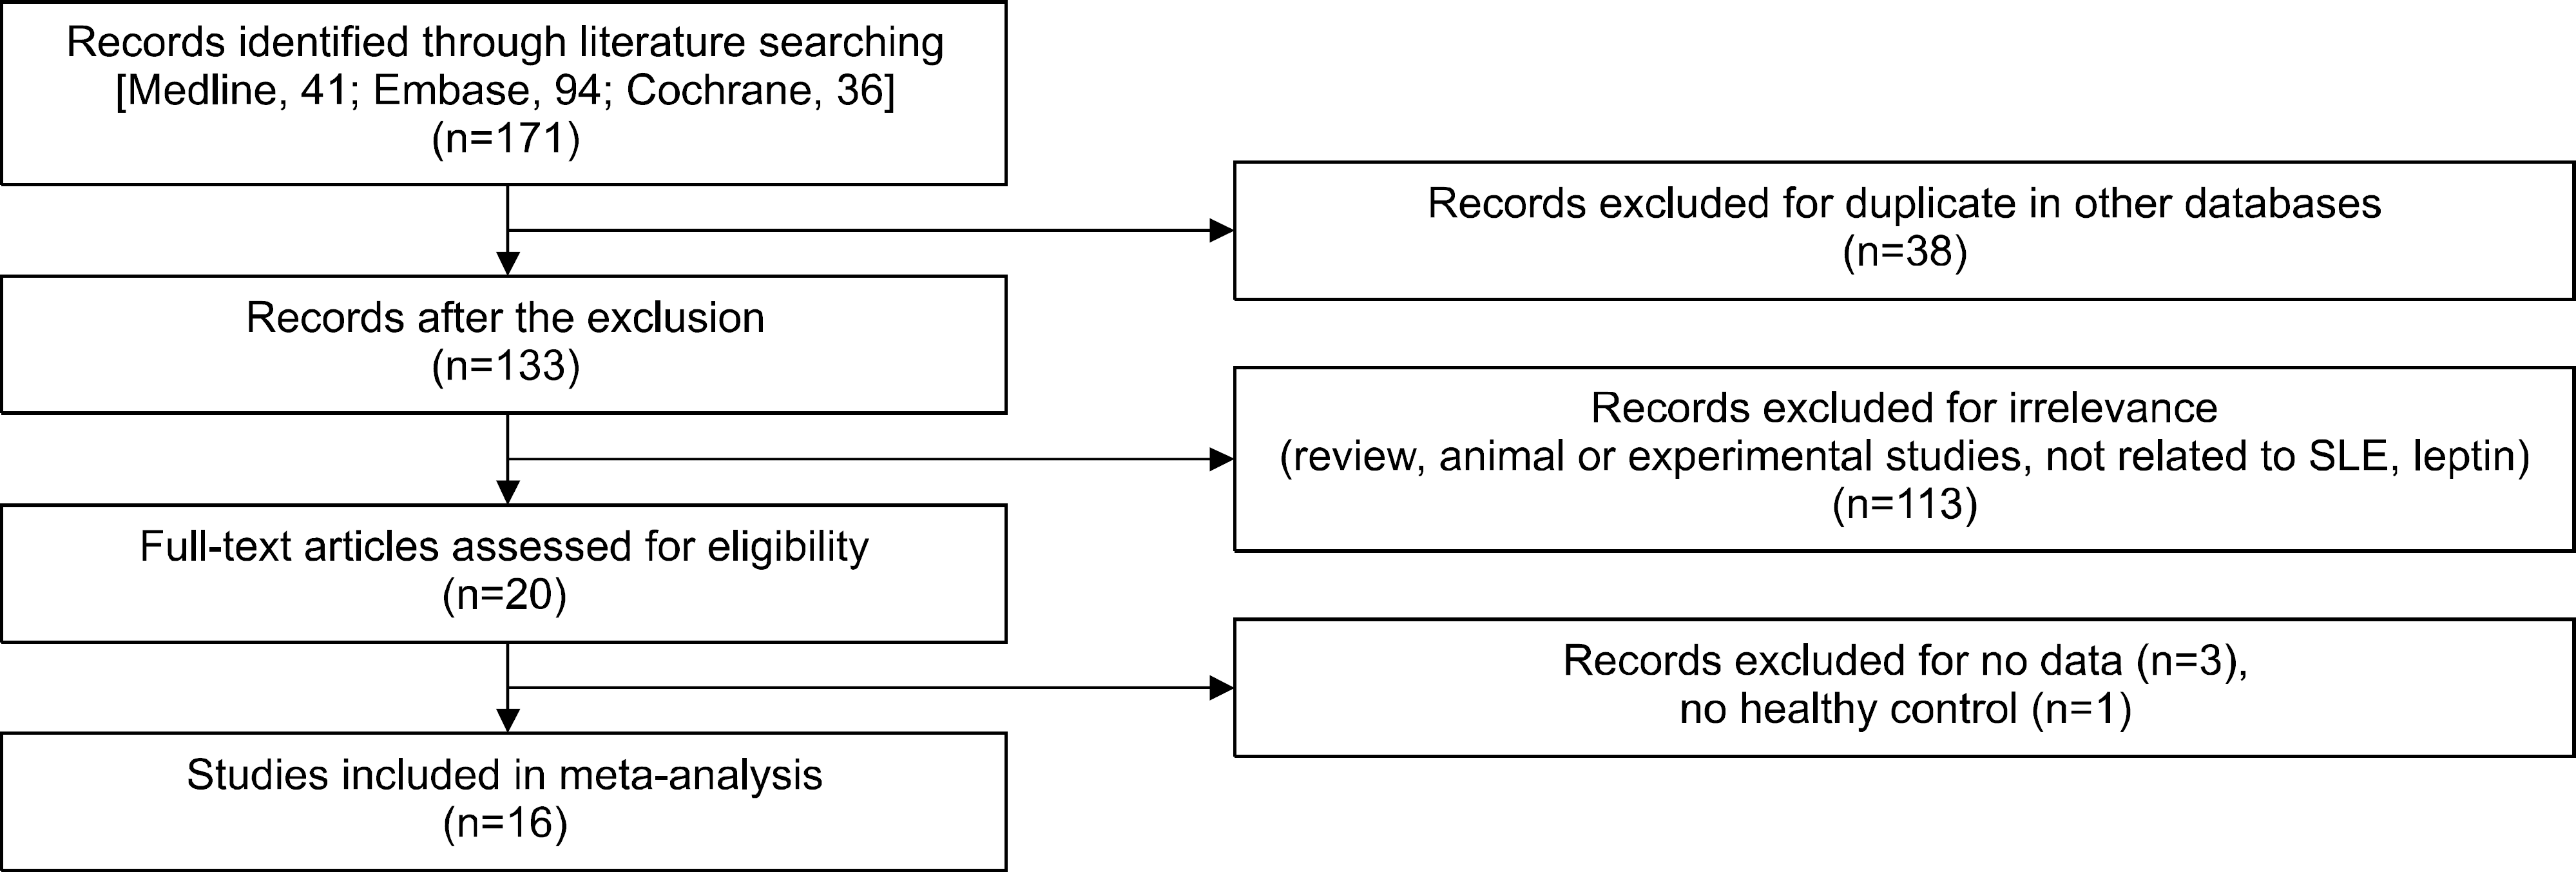
Sixteen studies were included in this meta-analysis. NLR was significantly higher in the RA group (standardized mean difference [SMD], 0.800; 95% confidence interval [CI], 0.542∼1.058; p<0.001). Stratification according to ethnicity revealed a significantly elevated NLR in the RA group in Asian and Turkish populations (SMD, 95% CI: 0.994, 0.418∼1.519, p=0.001 and 0.695, 0.443∼0.948, p<0.001, respectively). Subgroup analysis revealed a significantly high NLR in RA, independent of the data type and adjustment for age and/or sex. PLR was also significantly higher in the RA group (SMD, 0.708; 95% CI, 0.401∼0.995; p<0.001), regardless of ethnicity, data type, and adjustment for age and/or sex. In addition, NLR and PLR were positively associated with the RA activity based on the DAS28 (correlation coefficient, 95% CI: 0.277, 0.190∼0.359, p<0.001 and 0.318, 0.197∼0.430, p<0.001, respectively). However, MPV showed no correlation with the RA activity (correlation coefficient, −0.095; 95% CI, −0.435 to 0.269; p=0.615).
Go to : 
REFERENCES
1. Harris ED Jr. Rheumatoid arthritis. Pathophysiology and implications for therapy. N Engl J Med. 1990; 322:1277–89.
3. Talstad I, Scheie P, Dalen H, Röli J. Influence of plasma proteins on erythrocyte morphology and sedimentation. Scand J Haematol. 1983; 31:478–84.

4. van Leeuwen MA, van Rijswijk MH, van der Heijde DM, Te Meerman GJ, van Riel PL, Houtman PM, et al. The acutephase response in relation to radiographic progression in early rheumatoid arthritis: a prospective study during the first three years of the disease. Br J Rheumatol. 1993; 32(Suppl 3):9–13.

5. Plant MJ, Williams AL, O'Sullivan MM, Lewis PA, Coles EC, Jessop JD. Relationship between time-integrated C-reactive protein levels and radiologic progression in patients with rheumatoid arthritis. Arthritis Rheum. 2000; 43:1473–7.

6. Gabay C, Kushner I. Acute-phase proteins and other systemic responses to inflammation. N Engl J Med. 1999; 340:448–54.

7. Yolbas S, Yildirim A, Gozel N, Uz B, Koca SS. Hematological indices may be useful in the diagnosis of systemic lupus erythematosus and in determining disease activity in behçet's disease. Med Princ Pract. 2016; 25:510–6.

8. Mercan R, Bitik B, Tufan A, Bozbulut UB, Atas N, Ozturk MA, et al. The association between neutrophil/lymphocyte ratio and disease activity in rheumatoid arthritis and ankylosing spondylitis. J Clin Lab Anal. 2016; 30:597–601.

9. Liu JF, Ba L, Lv H, Lv D, Du JT, Jing XM, et al. Association between neutrophil-to-lymphocyte ratio and differentiated thyroid cancer: a meta-analysis. Sci Rep. 2016; 6:38551.

10. Leader A, Pereg D, Lishner M. Are platelet volume indices of clinical use? A multidisciplinary review. Ann Med. 2012; 44:805–16.

11. Okyay GU, Inal S, Oneç K, Er RE, Paş aoğlu O, Paş aoğlu H, et al. Neutrophil to lymphocyte ratio in evaluation of inflammation in patients with chronic kidney disease. Ren Fail. 2013; 35:29–36.

12. Turkmen K, Erdur FM, Ozcicek F, Ozcicek A, Akbas EM, Ozbicer A, et al. Platelet-to-lymphocyte ratio better predicts inflammation than neutrophil-to-lymphocyte ratio in end-stage renal disease patients. Hemodial Int. 2013; 17:391–6.

13. Bath PM, Butterworth RJ. Platelet size: measurement, physiology and vascular disease. Blood Coagul Fibrinolysis. 1996; 7:157–61.
14. Tekeoğlu İ, Gürol G, Harman H, Karakeçe E, Çiftçi İ H. Overlooked hematological markers of disease activity in rheumatoid arthritis. Int J Rheum Dis. 2016; 19:1078–82.

15. Zengin O, Onder ME, Kalem A, Bilici M, Türkbeyler IH, Ozturk ZA, et al. New inflammatory markers in early rheumatoid arthritis. Z Rheumatol. 2018; 77:144–50.

16. Uslu AU, Küçük A, Şahin A, Ugan Y, Yılmaz R, Güngör T, et al. Two new inflammatory markers associated with Disease Activity Score-28 in patients with rheumatoid arthritis: neutrophil-lymphocyte ratio and platelet-lymphocyte ratio. Int J Rheum Dis. 2015; 18:731–5.

17. Fu H, Qin B, Hu Z, Ma N, Yang M, Wei T, et al. Neutrophil- and platelet-to-lymphocyte ratios are correlated with disease activity in rheumatoid arthritis. Clin Lab. 2015; 61:269–73.

18. Tecer D, Sezgin M, Kanık A, İncel NA, Çimen ÖB, Biçer A, et al. Can mean platelet volume and red blood cell distribution width show disease activity in rheumatoid arthritis? Biomark Med. 2016; 10:967–74.

19. Talukdar M, Barui G, Adhikari A, Karmakar R, Ghosh UC, Das TK. A study on association between common haematological parameters and disease activity in rheumatoid arthritis. J Clin Diagn Res. 2017; 11:EC01–4.
20. Yazici S, Yazici M, Erer B, Erer B, Calik Y, Ozhan H, et al. The platelet indices in patients with rheumatoid arthritis: mean platelet volume reflects disease activity. Platelets. 2010; 21:122–5.

21. Kisacik B, Tufan A, Kalyoncu U, Karadag O, Akdogan A, Ozturk MA, et al. Mean platelet volume (MPV) as an inflammatory marker in ankylosing spondylitis and rheumatoid arthritis. Joint Bone Spine. 2008; 75:291–4.

22. Gasparyan AY, Stavropoulos-Kalinoglou A, Toms TE, Douglas KM, Kitas GD. Association of mean platelet volume with hypertension in rheumatoid arthritis. Inflamm Allergy Drug Targets. 2010; 9:45–50.

23. Maden M, Pamuk GE, Pamuk ÖN. Development of atherosclerotic cardiovascular mortality in gouty arthritis and rheumatoid arthritis patients: are they associated with mean platelet volume and neutrophil-lymphocyte ratio? A comparative study. Arch Rheumatol. 2017; 32:39–45.

24. Zhang YY, Yin YM, Kuai SG, Shan ZB, Pei H, Wang J. Combination of neutrophil to lymphocyte ratio and platelet to lymphocyte ratio as diagnostic biomarker for rheumatoid arthritis. Int J Clin Exp Med. 2016; 9:22076–81.
25. Gökmen F, Akbal A, Reşorlu H, Binnetoglu E, Cevizci S, Gökmen E, et al. Mean platelet volume and neutrophil lymphocyte ratio as related to inflammation markers and an-ti-CCP in rheumatoid arthritis. Aktuel Rheumatol. 2016; 41:488–91.

26. Cakır L, Aktas G, Mercimek OB, Enginyurt O, Kaya Y, Mercimek K. Are red cell distribution width and mean platelet volume associated with rheumatoid arthritis? Biomed Res. 2016; 27:292–4.
27. Yildirim A, Karabiber M, Surucu GD, Türkbeyler IH, Karakoyun A, Selkuc MY, et al. The changes of mean platelet volume and platelet distribution width in patients with rheumatoid arthritis and their correlation with disease activity. Arch Sicil Med Chir 4 Acta Med Mediterr. 2015; 31:1105–11.
28. Lee YH, Woo JH, Choi SJ, Ji JD, Song GG. Induction and maintenance therapy for lupus nephritis: a systematic review and meta-analysis. Lupus. 2010; 19:703–10.

29. Lee YH, Woo JH, Choi SJ, Ji JD, Song GG. Association of programmed cell death 1 polymorphisms and systemic lupus erythematosus: a meta-analysis. Lupus. 2009; 18:9–15.

30. Lee YH, Woo JH, Choi SJ, Ji JD, Song GG. Associations between osteoprotegerin polymorphisms and bone mineral density: a meta-analysis. Mol Biol Rep. 2010; 37:227–34.

31. Moher D, Liberati A, Tetzlaff J, Altman DG. PRISMA Group. Preferred reporting items for systematic reviews and meta-analyses: the PRISMA statement. PLoS Med. 2009; 6:e1000097.

32. Hozo SP, Djulbegovic B, Hozo I. Estimating the mean and variance from the median, range, and the size of a sample. BMC Med Res Methodol. 2005; 5:13.

33. Ridout KK, Ridout SJ, Price LH, Sen S, Tyrka AR. Depression and telomere length: A meta-analysis. J Affect Disord. 2016; 191:237–47.

35. Higgins JP, Thompson SG. Quantifying heterogeneity in a meta-analysis. Stat Med. 2002; 21:1539–58.

36. Egger M, Davey Smith G, Schneider M, Minder C. Bias in meta-analysis detected by a simple, graphical test. BMJ. 1997; 315:629–34.

37. Guyatt G, Oxman AD, Sultan S, Brozek J, Glasziou P, Alonso-Coello P, et al. GRADE guidelines: 11. Making an overall rating of confidence in effect estimates for a single outcome and for all outcomes. J Clin Epidemiol. 2013; 66:151–7.

38. Rodríguez-Carrio J, Alperi-López M, López P, Alonso-Castro S, Carro-Esteban SR, Ballina-García FJ, et al. Red cell distribution width is associated with endothelial progenitor cell depletion and vascular-related mediators in rheumatoid arthritis. Atherosclerosis. 2015; 240:131–6.

39. Milovanovic M, Nilsson E, Järemo P. Relationships between platelets and inflammatory markers in rheumatoid arthritis. Clin Chim Acta. 2004; 343:237–40.

40. Chandrashekara S, Rajendran A, Bai Jaganath A, Krishnamurthy R. Neutrophil-lymphocyte ratio, pain perception, and disease activity score may serve as important predictive markers for sustained remission in rheumatoid arthritis. Reumatismo. 2015; 67:109–15.

41. Harish R, Poorana PP. Changes in platelet indices in patients with Rheumatoid arthritis. Int J Pharma Bio Sci. 2015; 6:515–8.
42. Choy EH, Panayi GS. Cytokine pathways and joint inflammation in rheumatoid arthritis. N Engl J Med. 2001; 344:907–16.

43. Li J, Kim K, Barazia A, Tseng A, Cho J. Platelet-neutrophil interactions under thromboinflammatory conditions. Cell Mol Life Sci. 2015; 72:2627–43.

44. Wood KL, Twigg HL 3rd, Doseff AI. Dysregulation of CD8+ lymphocyte apoptosis, chronic disease, and immune regulation. Front Biosci (Landmark Ed). 2009; 14:3771–81.

45. Cassatella MA. The production of cytokines by polymorphonuclear neutrophils. Immunol Today. 1995; 16:21–6.

46. Qin B, Ma N, Tang Q, Wei T, Yang M, Fu H, et al. Neutrophil to lymphocyte ratio (NLR) and platelet to lymphocyte ratio (PLR) were useful markers in assessment of inflammatory response and disease activity in SLE patients. Mod Rheumatol. 2016; 26:372–6.

47. Koca TT. Does obesity cause chronic inflammation? The association between complete blood parameters with body mass index and fasting glucose. Pak J Med Sci. 2017; 33:65–9.

48. Meng X, Wei G, Chang Q, Peng R, Shi G, Zheng P, et al. The platelet-to-lymphocyte ratio, superior to the neutrophil-to-lymphocyte ratio, correlates with hepatitis C virus infection. Int J Infect Dis. 2016; 45:72–7.

49. Turhan O, Coban E, Inan D, Yalcin AN. Increased mean platelet volume in chronic hepatitis B patients with inactive disease. Med Sci Monit. 2010; 16:CR202–5.
Go to : 
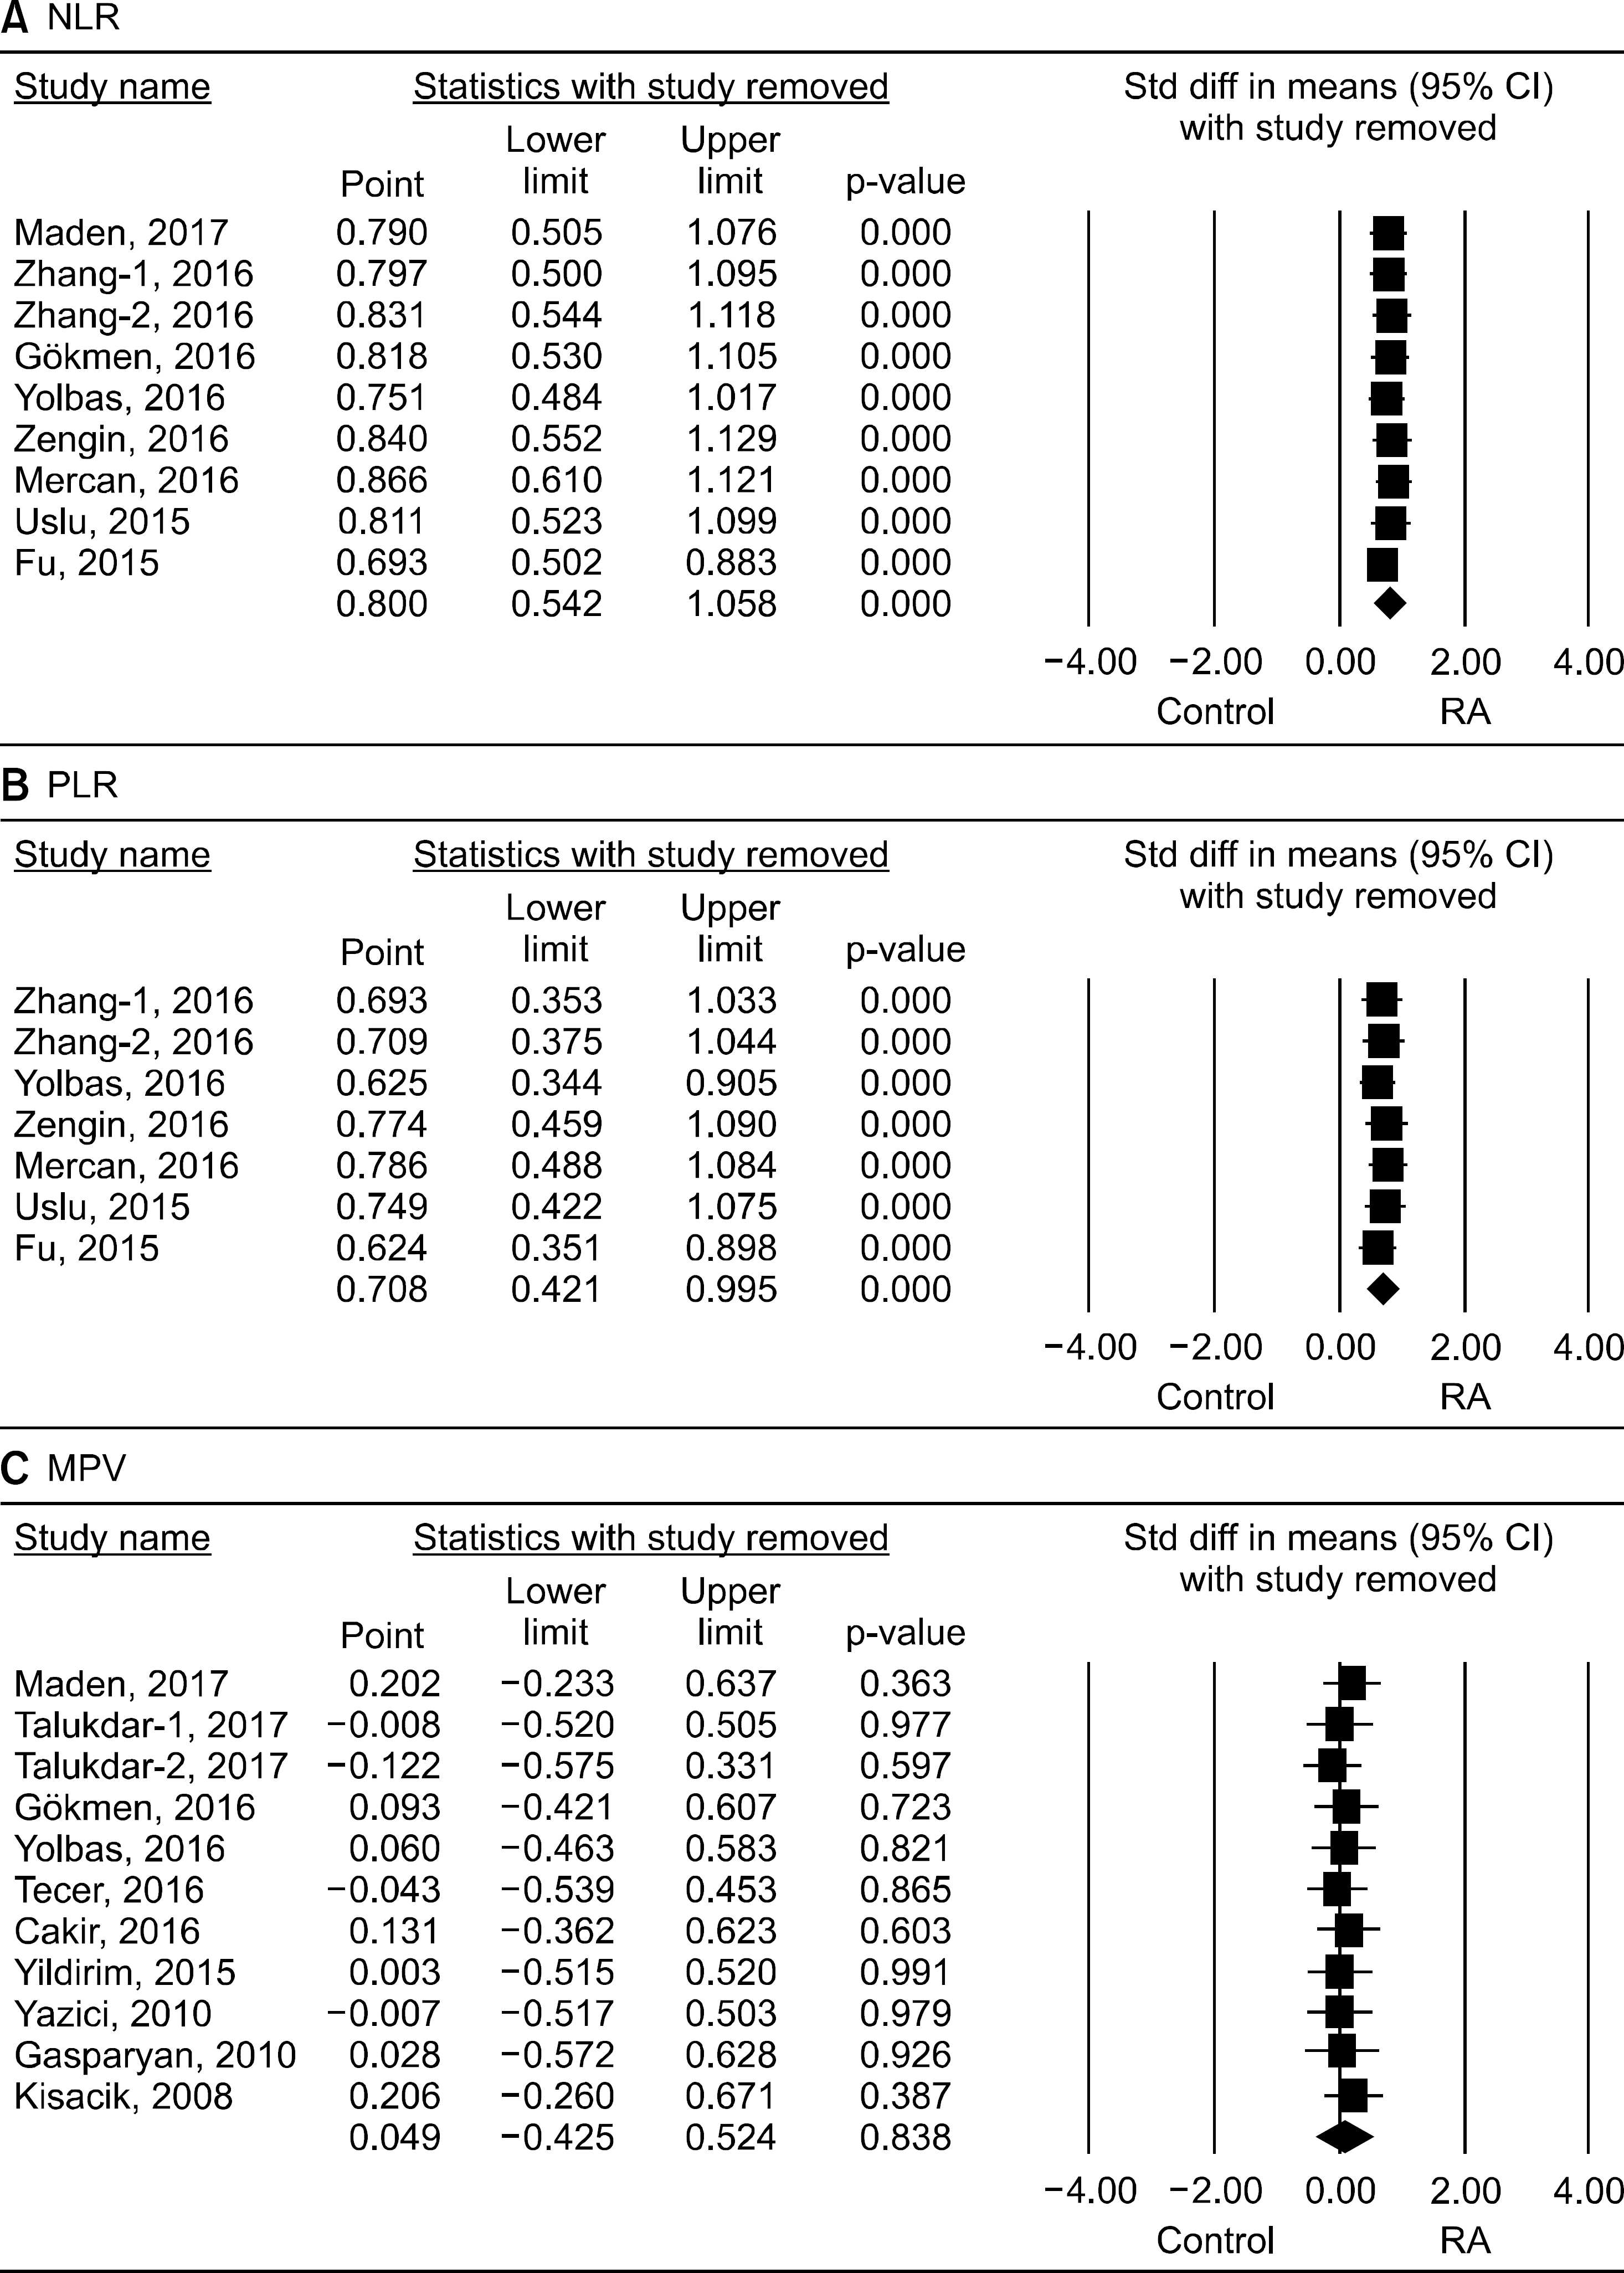
 | Supplementary Figure 1.Sensitivity analysis. NLR: neutrophil-to-lymphocyte ratio, PLR: platelet-to-lymphocyte ratio, MPV: mean platelet volume, Std diff: standard difference, CI: confidence interval, RA: rheumatoid arthritis. |
 | Supplementary Figure 2.Funnel plot of publication bias. NLR: neutrophil-to-lymphocyte ratio, PLR: platelet-to-lymphocyte ratio, MPV: mean platelet volume, Std diff: standard difference, Std Err: standard error. |
 | Figure 2.Meta-analysis of the relationship of (A) NLR, (B) PLR, and (C) MPV to RA and the correlation coefficients between (D) NLR, (E) PLR, and (F) MPV and DAS28. NLR: neutrophil-to-lymphocyte ratio, PLR: plate-let-to-lymphocyte ratio, MPV: mean platelet volume, RA: rheumatoid arthritis, DAS28: Disease Activity Score 28, Std diff: standard difference, CI: confidence interval. |
Table 1.
Characteristics of the individual studies included in the meta-analysis
| Test | Author | Country | Number | Matched | DAS28 | Result | |||
|---|---|---|---|---|---|---|---|---|---|
| Case | Control | SMD* | Magnitude* | p-value | |||||
| NLR | Maden, 2017 [23] | Turkey | 82 | 61 | NA | NA | 0.888 | Large | <0.001 |
| Zhang-1, 2016 [24] | China | 125 | 126 | Age, sex | NA | 0.831 | Large | <0.001 | |
| Zhang-2, 2016 [24] | China | 59 | 126 | Age, sex | NA | 0.557 | Medium | 0.001 | |
| Gökmen, 2016 [25] | Turkey | 84 | 60 | Age, sex | NA | 0.661 | Medium | <0.001 | |
| Yolbas, 2016 [7] | Turkey | 91 | 55 | NA | NA | 1.219 | Large | <0.001 | |
| Tekeoğ lu, 2016 [14] | Turkey | 102 | NA | NA | 0.193 | NA | NA | NA | |
| Zengin, 2016 [15] | Turkey | 205 | 104 | NA | NA | 0.505 | Medium | <0.001 | |
| Mercan, 2016 [8] | Turkey | 136 | 117 | NA | 0.310 | 0.300 | Small | 0.018 | |
| Uslu, 2015 [16] | Turkey | 104 | 51 | Age, sex | 0.345 | 0.715 | Medium | <0.001 | |
| Fu, 2015 [17] | China | 128 | 78 | Age, sex | 0.250 | 1.601 | Large | <0.001 | |
| PLR | Zhang-1, 2016 [24] | China | 125 | 126 | Age, sex | NA | 0.806 | Large | <0.001 |
| Zhang-2, 2016 [24] | China | 59 | 126 | Age, sex | NA | 0.711 | Medium | <0.001 | |
| Yolbas, 2016 [7] | Turkey | 91 | 55 | NA | NA | 1.248 | Large | <0.001 | |
| Zengin, 2016 [15] | Turkey | 205 | 104 | NA | NA | 0.338 | Small | 0.005 | |
| Mercan, 2016 [8] | Turkey | 136 | 117 | NA | NA | 0.264 | Small | 0.037 | |
| Uslu, 2015 [16] | Turkey | 104 | 51 | Age, sex | 0.352 | 0.461 | Small | 0.008 | |
| Fu, 2015 [17] | China | 128 | 78 | Age, sex | 0.290 | 1.199 | Large | <0.001 | |
| MPV | Maden, 2017 [23] | Turkey | 82 | 61 | NA | NA | 1.454 | Large | <0.001 |
| Talukdar-1, 2017 [19] | India | 48 | 80 | Age, sex | NA | 0.614 | Medium | 0.001 | |
| Talukdar-2, 2017 [19] | India | 32 | 80 | Age, sex | NA | 1.861 | Large | <0.001 | |
| Gokmen, 2016 [25] | Turkey | 84 | 60 | Age, sex | NA | 0.384 | Small | 0.024 | |
| Yolbas, 2016 [7] | Turkey | 91 | 55 | NA | NA | 0.064 | No effect | 0.708 | |
| Tekeoğ lu, 2016 [14] | Turkey | 102 | NA | NA | 0.316 | NA | NA | NA | |
| Tecer, 2016 [18] | Turkey | 100 | 100 | Age, sex | NA | 0.951 | Large | <0.001 | |
| Cakir, 2016 [26] | Turkey | 81 | 80 | Age, sex | NA | 0.749 | Medium | <0.001 | |
| Yildirim, 2015 [27] | Turkey | 90 | 52 | Age, sex | 0.231 | 0.506 | Medium | 0.004 | |
| Yazici, 2010 [20] | Turkey | 97 | 33 | Age, sex | 0.270 | 0.615 | Medium | 0.003 | |
| Gasparyan, 2010 [22] | UK | 400 | 360 | NA | NA | 0.231 | Small | 0.002 | |
| Kisacik, 2008 [21] | Turkey | 32 | 29 | Age | NA | 1.660 | Large | <0.001 | |
Table 2.
Meta-analysis of the association of NLR, PLR, and MPV with RA
| Group | Population | Study (n) | Test of association | Test of heterogeneity | ||||
|---|---|---|---|---|---|---|---|---|
| SMD* | 95% CI | p-value | Model | p-value | I2 | |||
| NLR | ||||||||
| Overall | 9 | 0.800 | 0.542∼1.058 | <0.001 | R | <0.001 | 84.8 | |
| Ethnicity | Asian | 3 | 0.994 | 0.418∼1.519 | 0.001 | R | <0.001 | 91.1 |
| Turkish | 6 | 0.695 | 0.443∼0.948 | <0.001 | R | 0.001 | 75.4 | |
| Data type | Original | 5 | 0.588 | 0.389∼0.787 | <0.001 | R | 0.063 | 55.2 |
| Calculated | 4 | 1.047 | 0.607∼1.488 | <0.001 | R | <0.001 | 87.5 | |
| Age/sex-matche | ed Yes | 5 | 0.874 | 0.517∼1.230 | <0.001 | R | <0.001 | 84.6 |
| No | 4 | 0.709 | 0.331∼1.086 | <0.001 | R | <0.001 | 84.9 | |
| PLR | ||||||||
| Overall | 7 | 0.708 | 0.401∼0.995 | <0.001 | R | <0.001 | 85.5 | |
| Ethnicity | Asian | 3 | 0.904 | 0.622∼1.185 | <0.001 | R | 0.062 | 64.0 |
| Turkish | 4 | 0.560 | 0.173∼0.947 | 0.005 | R | <0.001 | 85.9 | |
| Data type | Original | 3 | 0.335 | 0.182∼0.488 | <0.001 | F | 0.656 | 0 |
| Calculated | 4 | 0.980 | 0.720∼1.239 | <0.001 | R | 0.037 | 64.7 | |
| Age/sex-matched | Yes | 4 | 0.800 | 0.514∼1.087 | <0.001 | R | 0.013 | 72.0 |
| No | 3 | 0.599 | 0.075∼1.122 | 0.025 | R | <0.001 | 90.6 | |
| MPV | ||||||||
| Overall | 11 | 0.049 | 0.425∼0.524 | 0.838 | R | <0.001 | 95.9 | |
| Data type | Original | 9 | 0.116 | 0.525∼0.757 | 0.723 | R | <0.001 | 96.2 |
| Calculated | 2 | 0.248 | 1.208∼0.712 | 0.613 | R | <0.001 | 96.6 | |
| Age/sex-matched | Yes | 8 | 0.227 | 0.414∼0.868 | 0.487 | R | <0.001 | 95.8 |
| No | 3 | 0.418 | 1.356∼0.520 | 0.382 | R | <0.001 | 97.1 | |
Table 3.
Meta-analysis of the correlation coefficients between NLR, PLR, and MPV and RA activity (DAS28)
Table 4.
GRADE assessment of the meta-analysis results


 PDF
PDF ePub
ePub Citation
 Print
Print


 XML Download