

 PDF
PDF ePub
ePub Citation
 Print
Print


INTRODUCTION
Complete blood count (CBC) assessment is critical not only for diagnosing and managing hematologic diseases but also for assessing overall health. An individual's CBC is compared with a reference interval (RI) when making a medical diagnosis, therapeutic management decision, or other physiological assessment. The significant interregional and interlaboratory variations in CBC RIs have various causes, including variations in the characteristics of the reference population, the methods used to obtain RIs, and the instruments used to determine CBC [1]. Moreover, the RIs for CBC and differential counts vary not only with age and sex but also with race [23]. Several studies in North America and Southeast Asia have determined age- and sex-specific RIs for CBC parameters, but they did not cover all age ranges and were limited by the smallness of the included samples [234]. In addition, age- and sex-specific RIs for hematology are often lacking or incomplete across a broad age range, as studies tend to establish their RIs on select subsets of population, focusing on children [5].
A large reference population is required to determine the age- and sex-specific characteristics of CBC over a broad age range and to calculate the appropriate RIs. Although the CLSI recommends direct sampling from a healthy reference population [6], most laboratories experience difficulties recruiting large numbers of reference subjects, particularly pediatric or geriatric subjects.
We analyzed the pooled data of health examinees obtained from 16 health promotion centers in 13 cities across Korea that used Sysmex XE-2100 (Sysmex, Kobe, Japan) for determining CBC in order to establish age- and sex-specific RIs across pediatric, adult, and geriatric ages for CBC parameters. We also evaluated patterns of changes in CBC parameters according to age and sex.
METHODS
1. Data source
All CBC data were retrospectively obtained from health checkups of individuals aged 3–99 years performed at 16 health promotion centers in 13 cities across Korea (Seoul, Incheon, Suwon, Chuncheon, Chungju, Daejeon, Daegu, Jeonju, Gwangju, Woolsan, Busan, Changwon, and Jeju) between January 2014 and October 2015. These CBC data were collected in a central database and retrieved as required to calculate CBC RIs. Data were also collected on demographics and medical histories. We pre-excluded the following: pregnant or lactating women; smokers; those consuming three or more alcoholic drinks per day; those with or taking medication for hypertension, diabetes mellitus, or dyslipidemia; and those with renal dysfunction, obesity (body mass index >28 kg/m2), and certain types of cancer. A total of 804,623 reference subjects were enrolled. This study was reviewed and approved by the Institutional Review Board of the Korea Association of Health Promotion (Approval No. 130750-201608-HR-024).
The following CBC parameters were studied: Hct; Hb; red blood cell (RBC) count; RBC indices such as mean corpuscular volume (MCV), mean corpuscular Hb (MCH), mean corpuscular Hb concentration (MCHC), and RBC distribution width (RDW); white blood cell (WBC) count and differential count; platelet count; platelet distribution width (PDW); mean platelet volume; and plateletcrit (PCT). All CBCs were performed using Sysmex XE-2100.
2. Statistical analysis and calculation of RIs
A total of 804,623 health examinees were initially enrolled: 66,611 aged 3–17 years, 564,280 aged 18–59 years, and 173,732 aged 60–99 years. We excluded 22,766 examinees after outlier testing. A total of 781,857 examinees were finally used to calculate the RIs. CBC data were analyzed according to the CLSI C28-A3 guidelines [6]. Scatter and distribution plots were generated and used to inspect the data. Age and sex partitions were determined by visually inspecting the distribution and scatter plots for overall trends. The data in each partition were transformed using the Box-Cox transformation method. The Tukey test was used to remove outliers. The combined application of exclusion criteria and outlier exclusion made it possible to remove erroneous and unhealthy subjects' data. We then decided whether partitioning the RI could be statistically justified, using the Harris and Boyd method [7]. RIs for all the partitions were calculated using non-parametric methods (the 2.5th and 97.5th percentiles). To represent the variations in CBC parameters according to age and sex, box plots were generated. The Wilcoxon rank sum test and Kruskal-Wallis test were performed to compare parameters according to sex and age groups, respectively. Statistical analyses were performed using SAS version 9.4 (SAS Institute Inc., Cary, NC, USA), and P<0.05 was considered statistically significant.
3. Variations by age and sex
To analyze the variations in CBC parameters according to age and sex, the parameters for each sex were grouped into the following age groups: 3–5, 6–8, 9–11, 12–14, 15–17, 18–45, 46–59, 60–75, and 76–99 years. We categorized the age range as follows: 3–14 as childhood, 15–17 as puberty, 18–59 as adulthood, and 60–99 as elderly.
RESULTS
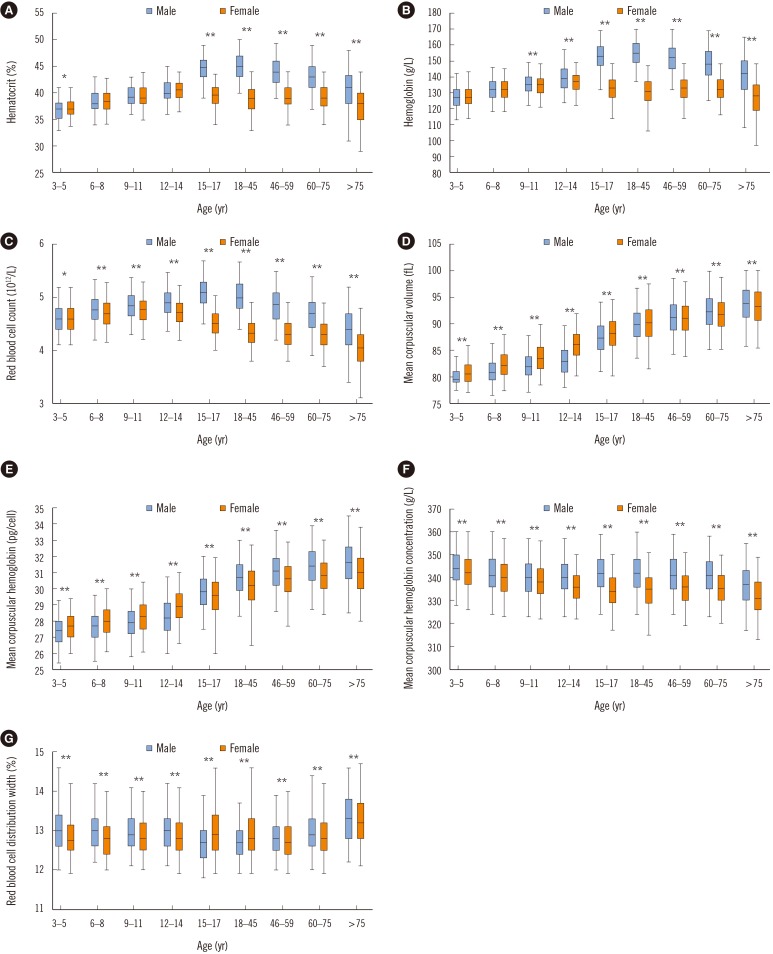
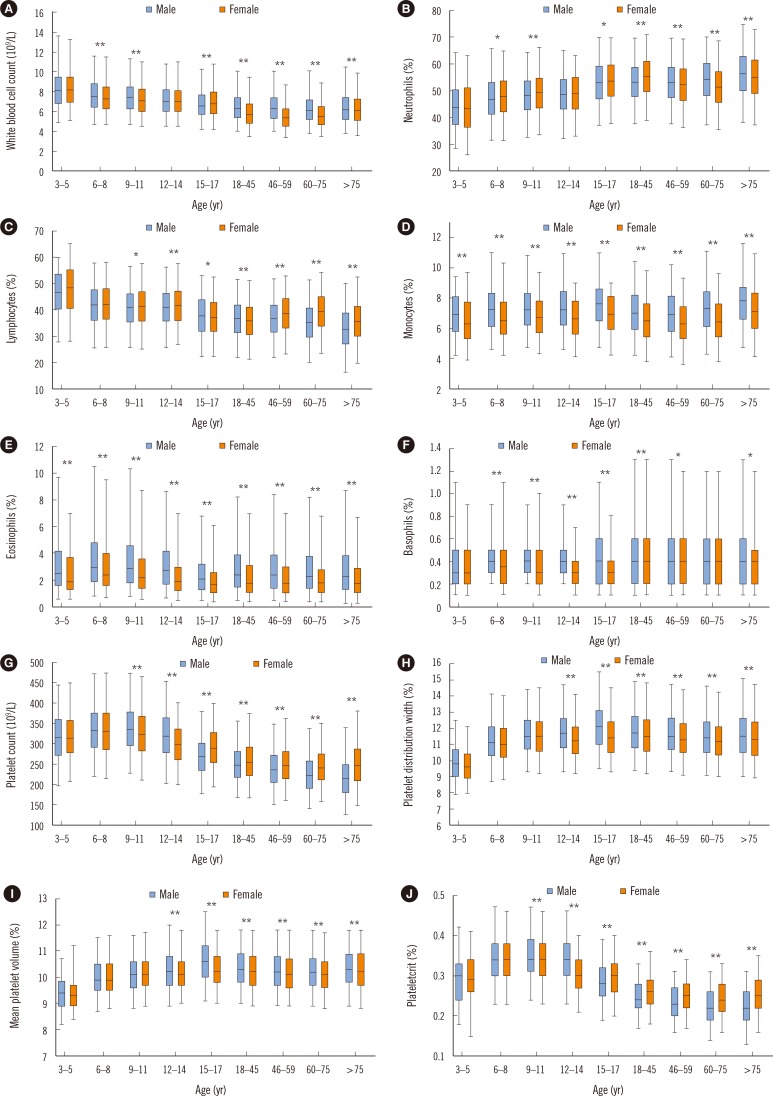
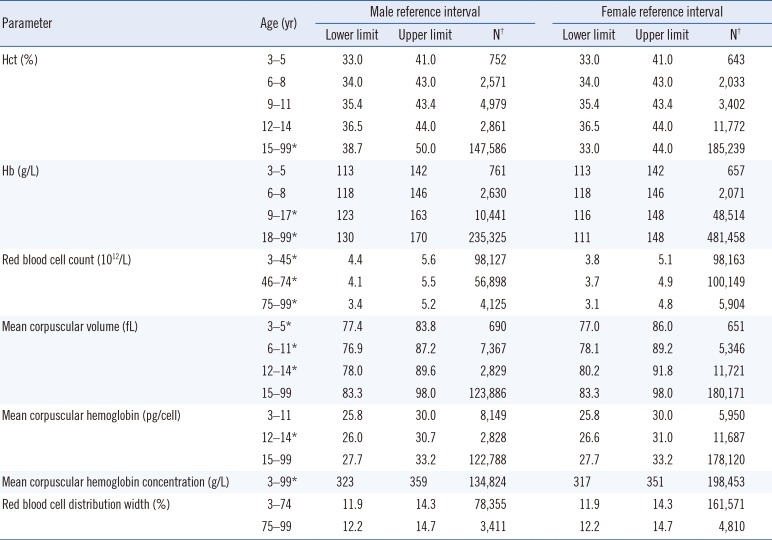
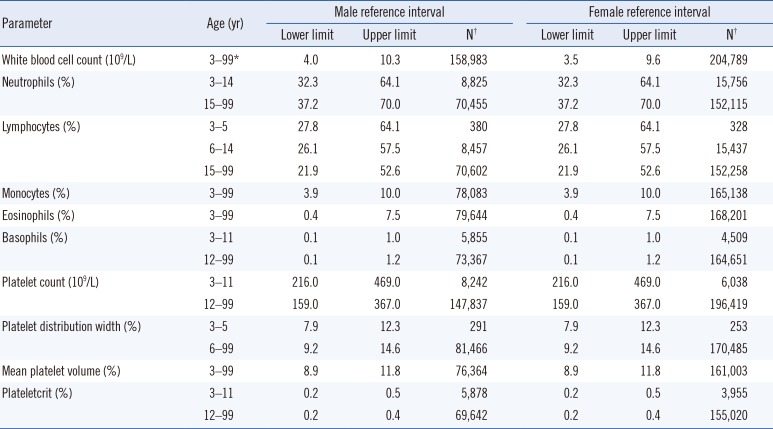
Scatter plots of Hb, RBC count, WBC count, and platelet count are shown in Fig. 1. Age- and sex-specific RIs for RBC, WBC, and platelet parameters are shown in Tables 1 and 2.
1. Partitioning
1) RBC parameters
The RBC count, Hb, and Hct required several age partitions, particularly for Hb and Hct within childhood and adolescence. Sex-related differences were observed for the RBC count, Hb, and Hct during puberty and adulthood. Age and sex partitions were required for MCV, MCH, and RDW, but not for MCHC, among the RBC parameters.
2) WBC parameters
WBC count differed with sex but not with age; in contrast, neutrophil, lymphocyte, and basophil counts showed age-, but not sex-related differences. In particular, the lymphocyte count needed additional partitions during childhood. Monocyte and eosinophil counts did not show age- and sex-related differences.
2. Age- and sex-related findings
The CBC parameters varied with both sex and age, and most of them needed to be partitioned by both sex and age (Fig. 2 and 3). Sex-related differences were observed in most of CBC parameters (P<0.05). The Hct, Hb, and RBC count increased with age until late childhood (12–14 years) in both sexes, but sex-related differences were noted from puberty (15–17 years). In males, the Hct, Hb, and RBC count increased until adulthood (45 years) and then decreased in geriatric age. In females, these parameters decreased from puberty (15–17 years). RDW was higher in males (except during puberty and adulthood) (P<0.005), and highest in those older than 75 years in both sexes. WBC and platelet counts were the highest in early childhood, and both decreased with age (P<0.001). Sex difference in each age group was noted in the WBC and platelet counts. The WBC count was higher in males than in females during adulthood. The platelet count was higher in females than in males during puberty, adulthood, and geriatric age (P<0.001). The neutrophil count was the lowest in early childhood and increased with age, whereas the lymphocyte count was the highest in early childhood and decreased with age (P<0.001). The eosinophil count was the highest in childhood and higher in males than in females. The monocyte count was also higher in males than in females (P<0.001).
DISCUSSION
We obtained updated RIs spanning from early childhood to a late geriatric age in a very large population, and identified changes in CBC parameters throughout the lifespan. The Hct, Hb, and RBC counts showed similar variations throughout the lifespan. These parameters were similar between males and females, and increased slowly until late childhood (12–14 years). However, sex-related differences became evident after 14 years. This finding supports the hypothesis that testosterone, which activates erythropoiesis by stimulating erythropoietin production in males, increases the RBC count in males during puberty [8]. Meanwhile, the much lower Hb levels in females were attributed to decreased metabolic demand, decreased muscle mass, and lower iron stores due to menstruation [9]. Anemia is considered present if the Hb level or Hct is below the lower limit of the corresponding 95% RIs according to the individual's age, sex, and geographic location (altitude) [10]. The WHO Hb cutoff for mild anemia is 130 g/L and 120 g/L for men (15 years and above) and non-pregnant women (15 years and above), respectively [1112]. The WHO Hb cutoffs do not coincide with our findings of the lower limits for those older than 60 years (125 and 116 g/L in males and females, respectively) and particularly for those older than 75 years (108 and 97 g/L in males and females, respectively). The WHO's lower limit for a healthy Hb level applies to subjects aged 59 years and younger. The decrease in Hb level in the elderly could be due to either insufficient diagnostic evaluation of certain diseases or the aging process itself [1314]. This supports the need for age-specific RIs for Hb rather than adopting generalized RIs and anemia cutoffs for the elderly.
The WBC count was the highest in early childhood, and then decreased until adulthood, consistent with the pattern found in previous studies [34]. The lymphocyte count was the highest in early childhood and then decreased with age, which was in contrast to the trend for the neutrophil count. This pattern seems to reflect the development of acquired and adaptive immune responses after early childhood as the immune system is increasingly exposed to pathogens and nonself-antigens from the environment. There was also a sex-related difference in the neutrophil count, which was higher in females during puberty and adulthood. Verthelyi [15] reported that sex hormones act as immunomodulators: estrogen increases immunologic responses, whereas testosterone suppresses the response to infection. This supports our finding of the neutrophil count being higher in females during puberty and adulthood. For monocytes, sex-related differences were observed across all age groups, although partitioning was not needed. Previous studies have found sex-related differences in adulthood only [3] or have not observed such differences [16].
We found that the platelet count was higher in females (except in childhood) and decreased with age in both sexes. Thrombopoietin, a hormone that regulates platelet production, peaks after birth and gradually decreases until adulthood [17]. This could explain why we observed higher platelet counts in early childhood. The higher platelet count for females from puberty could be explained by estrogen promoting platelet production [18]. Moreover, the reduction in body iron stores could also be related to the higher platelet count in females, because moderate iron deficiency has been shown to stimulate platelet production [1920]. The lower RI limit for platelet count for males in our study was 140×109/L in males older than 60 years, and 140×109/L and 126×109/L for those aged 60–75 and over 75 years, respectively. Many laboratories use 140×109/L or 150×109/L as the lower limit for platelet count. However, these values were proposed many years ago [2122], and RIs for the platelet count in the elderly may need to be adjusted.
This study has some limitations. The CLSI recommends using a direct sampling technique to select healthy individuals. We obtained data from a database covering health promotion centers. Although our data were derived from routine health checkups, and examinees were excluded on the basis of medical histories and other test results, results from unhealthy examinees may have been included. Further, we analyzed the WBC differential count instead of the absolute count because the former was the only information available in the database used. Finally, we could not include individuals younger than three years in our study population.
The strengths of this study include the use of the same instruments with identical operational settings for obtaining CBC results. We analyzed the pooled data of health examinees aged three to 99 years obtained from 16 health promotion centers in 13 cities across Korea. It allowed us to identify not only age- and sex-specific RIs of CBC, representative of the Korean population, but also dynamic hematologic changes from early childhood to the late geriatric age. The age- and sex-specific RIs for CBC would be applicable to any laboratory using the Sysmex XE-2100 or other instruments with the same method. In addition, the age- and sex-specific RIs for CBC may contribute to accurate monitoring of pediatric, adult, and geriatric patients.

 XML Download