Abstract
Purpose:
To investigate the quality of rabbit kidney computed tomography (CT) images obtained using a small contrast volume and iterative reconstruction (IR).
Materials and Methods:
Twenty sedated rabbits were used. Four milliliters of contrast material and the IR technique were used for the study group. In the control group, 6 mL of contrast and the filtered back projection (FBP) technique were used. The image quality was evaluated by two radiologists in consensus. For qualitative image assessment, the sharpness, noise, texture, and streak artifacts were rated. For quantitative analysis, the CT attenuation values, image noise, signal-to-noise ratios (SNR), contrast-to-noise ratios (CNR), and figures of merit (FOM) were calculated.
Results:
Images obtained from the study group were sharper and contained less noise and fewer streak artifacts (all, p < 0.05) compared to those obtained from the control group. However, the texture of images from the study group was worse (p < 0.05). Although the CT attenuation values were comparable between the study and control groups, the image noise was considerably lower for the study group than that for the corresponding control group (all, p < 0.05). Thus, the SNR, CNR, and FOM were higher in the study group (all, p < 0.05) than in the control group.
Go to : 
REFERENCES
1.Tao SM., Wichmann JL., Schoepf UJ., Fuller SR., Lu GM., Zhang LJ. Contrast-induced nephropathy in CT: incidence, risk factors and strategies for prevention. Eur Radiol. 2016. 26:3310–3318.

2.Maeder M., Klein M., Fehr T., Rickli H. Contrast nephropathy: review focusing on prevention. J Am Coll Cardiol. 2004. 44:1763–1771.

3.Chertow GM., Burdick E., Honour M., Bonventre JV., Bates DW. Acute kidney injury, mortality, length of stay, and costs in hospitalized patients. J Am Soc Nephrol. 2005. 16:3365–3370.

5.Morcos SK., Thomsen HS., Webb JA. Contrast-media-induced nephrotoxicity: a consensus report. Contrast Media Safety Committee, European Society of Urogenital Radiology (ESUR). Eur Radiol. 1999. 9:1602–1613.
6.McDonald RJ., McDonald JS., Bida JP., Carter RE., Fleming CJ., Misra S, et al. Intravenous contrast material–induced nephropathy: causal or coincident phenomenon? Radiology. 2013. 267:106–118.

7.Stacul F., Van der Molen AJ., Reimer P., Webb JA., Thomsen HS., Morcos SK, et al. Contrast induced nephropathy: updated ESUR contrast media safety committee guidelines. Eur Radiol. 2011. 21:2527–2541.

8.Xu J., Mahesh M., Tsui BM. Is iterative reconstruction ready for MDCT? J Am Coll Radiol. 2009. 6:274–276.

9.Brown KM., Zabic S., Koehler T. Acceleration of ML iterative algorithms for CT by the use of fast start images. SPIE. 2012. 8313:831339.

10.Mehta D., Thompson R., Morton T., Dhanantwari A., Shefer E. Iterative model reconstruction: simultaneously lowered computed tomography radiation dose and improved image quality. Med Phys Int J. 2013. 2:147–155.
11.Nakaura T., Nakamura S., Maruyama N., Funama Y., Awai K., Harada K, et al. Low contrast agent and radiation dose protocol for hepatic dynamic CT of thin adults at 256–detector row CT: effect of low tube voltage and hybrid iterative reconstruction algorithm on image quality. Radiology. 2012. 264:445–454.

12.Itatani R., Oda S., Utsunomiya D., Funama Y., Honda K., Katahira K, et al. Reduction in radiation and contrast medium dose via optimization of low-kilovoltage CT protocols using a hybrid iterative reconstruction algorithm at 256-slice body CT: phantom study and clinical correlation. Clin Radiol. 2013. 68:e128–e135.

13.Namimoto T., Oda S., Utsunomiya D., Shimonobo T., Morita S., Nakaura T, et al. Improvement of image quality at low-radiation dose and low-contrast material dose abdominal CT in patients with cirrhosis: intraindividual comparison of low tube voltage with iterative reconstruction algorithm and standard tube voltage. J Comput Assist Tomogr. 2012. 36:495–501.
14.Jung SC., Kim SH., Cho JY. A comparison of the use of contrast media with different iodine concentrations for multidetector CT of the kidney. Korean J Radiol. 2011. 12:714–721.

15.Strauss KJ., Goske MJ., Kaste SC., Bulas D., Frush DP., Butler P, et al. Image gently: ten steps you can take to optimize image quality and lower CT dose for pediatric patients. Am J Roentgenol. 2010. 194:868–873.

16.Iyama Y., Nakaura T., Yokoyama K., Kidoh M., Harada K., Tokuyasu S, et al. Impact of knowledge-based iterative model reconstruction in abdominal dynamic CT with low tube voltage and low contrast dose. Am J Roentgenol. 2016. 206:687–693.

17.Hwang I., Cho JY., Kim SY., Oh SJ., Ku JH., Lee J, et al. Low tube voltage computed tomography urography using low-concentration contrast media: comparison of image quality in conventional computed tomography urography. Eur J Radiol. 2015. 84:2454–2463.

18.Yanaga Y., Awai K., Funama Y., Nakaura T., Hirai T., Roux S, et al. Low-dose MDCT urography: feasibility study of low-tube-voltage technique and adaptive noise reduction filter. Am J Roentgenol. 2009. 193:W220–W229.

19.Von Falck C., Bratanova V., Rodt T., Meyer B., Waldeck S., Wacker F, et al. Influence of sinogram affirmed iterative reconstruction of CT data on image noise characteristics and low-contrast detectability: an objective approach. PLoS One. 2013. 8:e56875.

20.Kröpil P., Bigdeli AH., Nagel HD., Antoch G., Cohnen M. Impact of increasing levels of advanced iterative reconstruction on image quality in low-dose cardiac CT angiography. Rofo. 2014. 186:567–575.
21.Singh S., Kalra MK., Hsieh J., Licato PE., Do S., Pien HH, et al. Abdominal CT: comparison of adaptive statistical iterative and filtered back projection reconstruction techniques. Radiology. 2010. 257:373–383.

22.Nelson RC., Feuerlein S., Boll DT. New iterative reconstruction techniques for cardiovascular computed tomography: how do they work, and what are the advantages and disadvantages? J Cardiovasc Comput Tomogr. 2011. 5:286–292.

23.Yuh BI., Cohan RH., Francis IR., Korobkin M., Ellis JH. Comparison of nephrographic with excretory phase helical computed tomography for detecting and characterizing renal masses. Can Assoc Radiol J. 2000. 51:170–176.
24.Edward HR. Breast MRI: fundamentals and technical aspects. 1st ed. New York: Springer. 2008. 93.
25.Marin D., Nelson RC., Schindera ST., Richard S., Youngblood RS., Yoshizumi TT, et al. Low-tube-voltage, high-tube-current multidetector abdominal CT: improved image quality and decreased radiation dose with adaptive statistical iterative reconstruction algorithm—initial clinical experience. Radiology. 2010. 254:145–153.

26.Wang R., Schoepf UJ., Wu R., Reddy RP., Zhang C., Yu W, et al. Image quality and radiation dose of low dose coronary CT angiography in obese patients: sinogram affirmed iterative reconstruction versus filtered back projection. Eur J Radiol. 2012. 81:3141–3145.

27.Leschka S., Stolzmann P., Schmid FT., Scheffel H., Stinn B., Marincek B, et al. Low kilovoltage cardiac dual-source CT: attenuation, noise, and radiation dose. Eur Radiol. 2008. 18:1809–1817.

28.Goo HW. CT radiation dose optimization and estimation: an update for radiologists. Korean J Radiol. 2012. 13:1–11.

29.Kaza RK., Platt JF., Al-Hawary MM., Wasnik A., Liu PS., Pandya A. CT enterography at 80 kVp with adaptive statistical iterative reconstruction versus at 120 kVp with standard reconstruction: image quality, diagnostic adequacy, and dose reduction. AJR Am J Roentgenol. 2012. 198:1084–1092.

30.Seyal AR., Arslanoglu A., Abboud SF., Sahin A., Horowitz JM., Yaghmai V. CT of the abdomen with reduced tube voltage in adults: a practical approach. Radiographics. 2015. 35:1922–1939.

31.Pan X., Sidky EY., Vannier M. Why do commercial CT scanners still employ traditional, filtered back-projection for image reconstruction? Inverse Probl. 2009. 25:1230009.

32.Dong J., Hayakawa Y., Kannenberg S., Kober C. Metal-induced streak artifact reduction using iterative reconstruction algorithms in x-ray computed tomography image of the dentoalveolar region. Oral Surg Oral Med Oral Pathol Oral Radiol. 2013. 115:e63–e73.

Go to : 
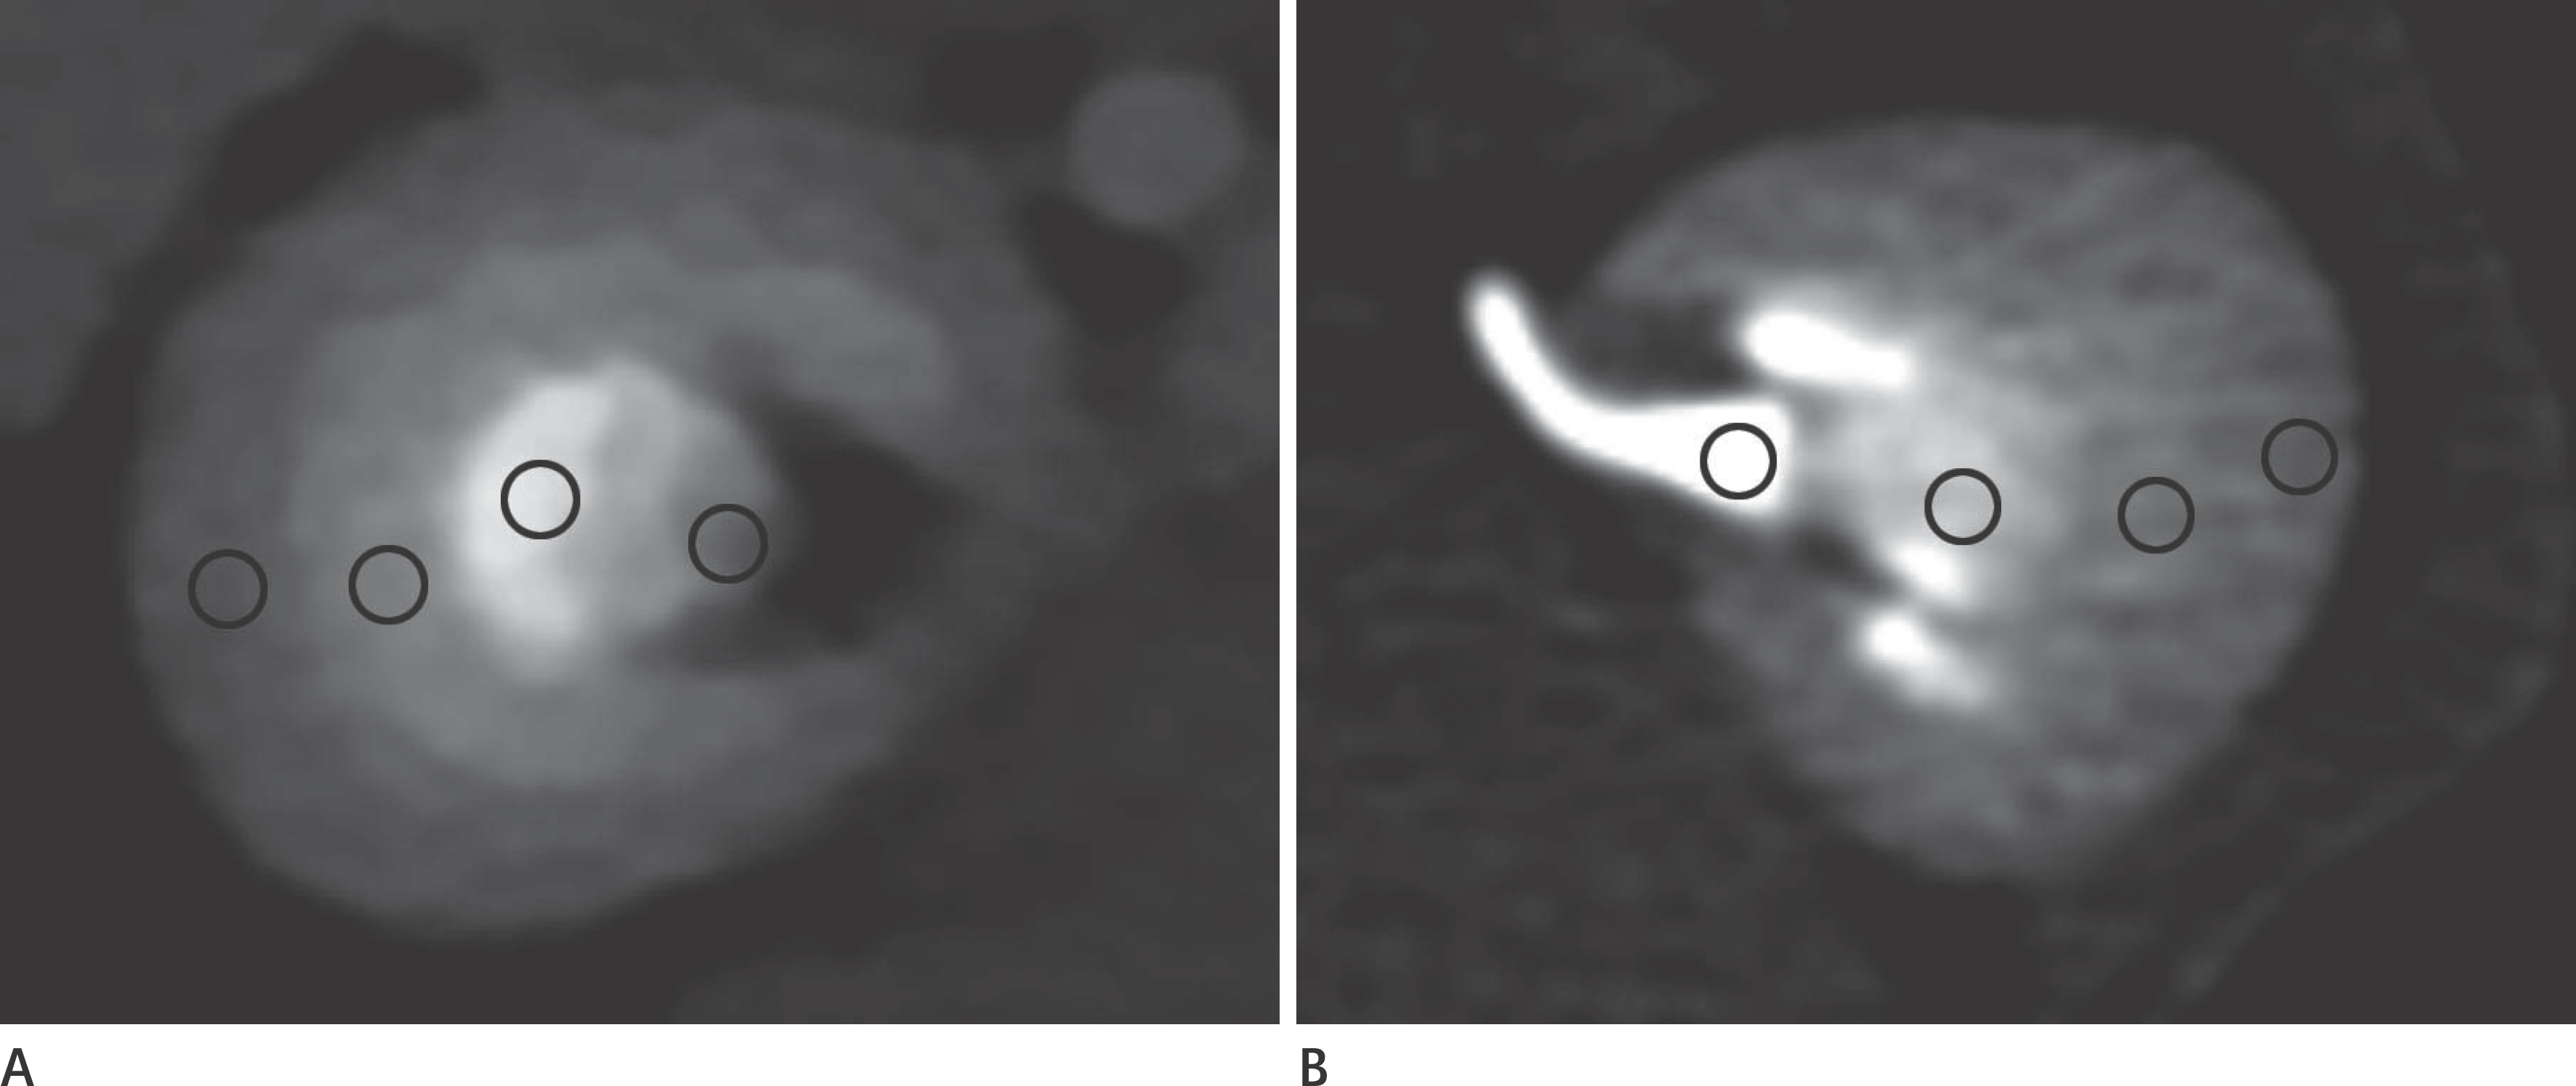
 | Fig. 1Representative axial images showing four region-of-interest circles inside kidney at 35 s (A) and 65 s (B). The CT attenuation values were measured at the renal cortex, outer medulla, inner medulla, and renal pelvis. The 35 s (A) image is displayed at the window width of 900 HU and level of 450 HU and the 65 s (B) image is displayed at the window width of 500 HU and level of 350 HU. HU = Hounsfield units |
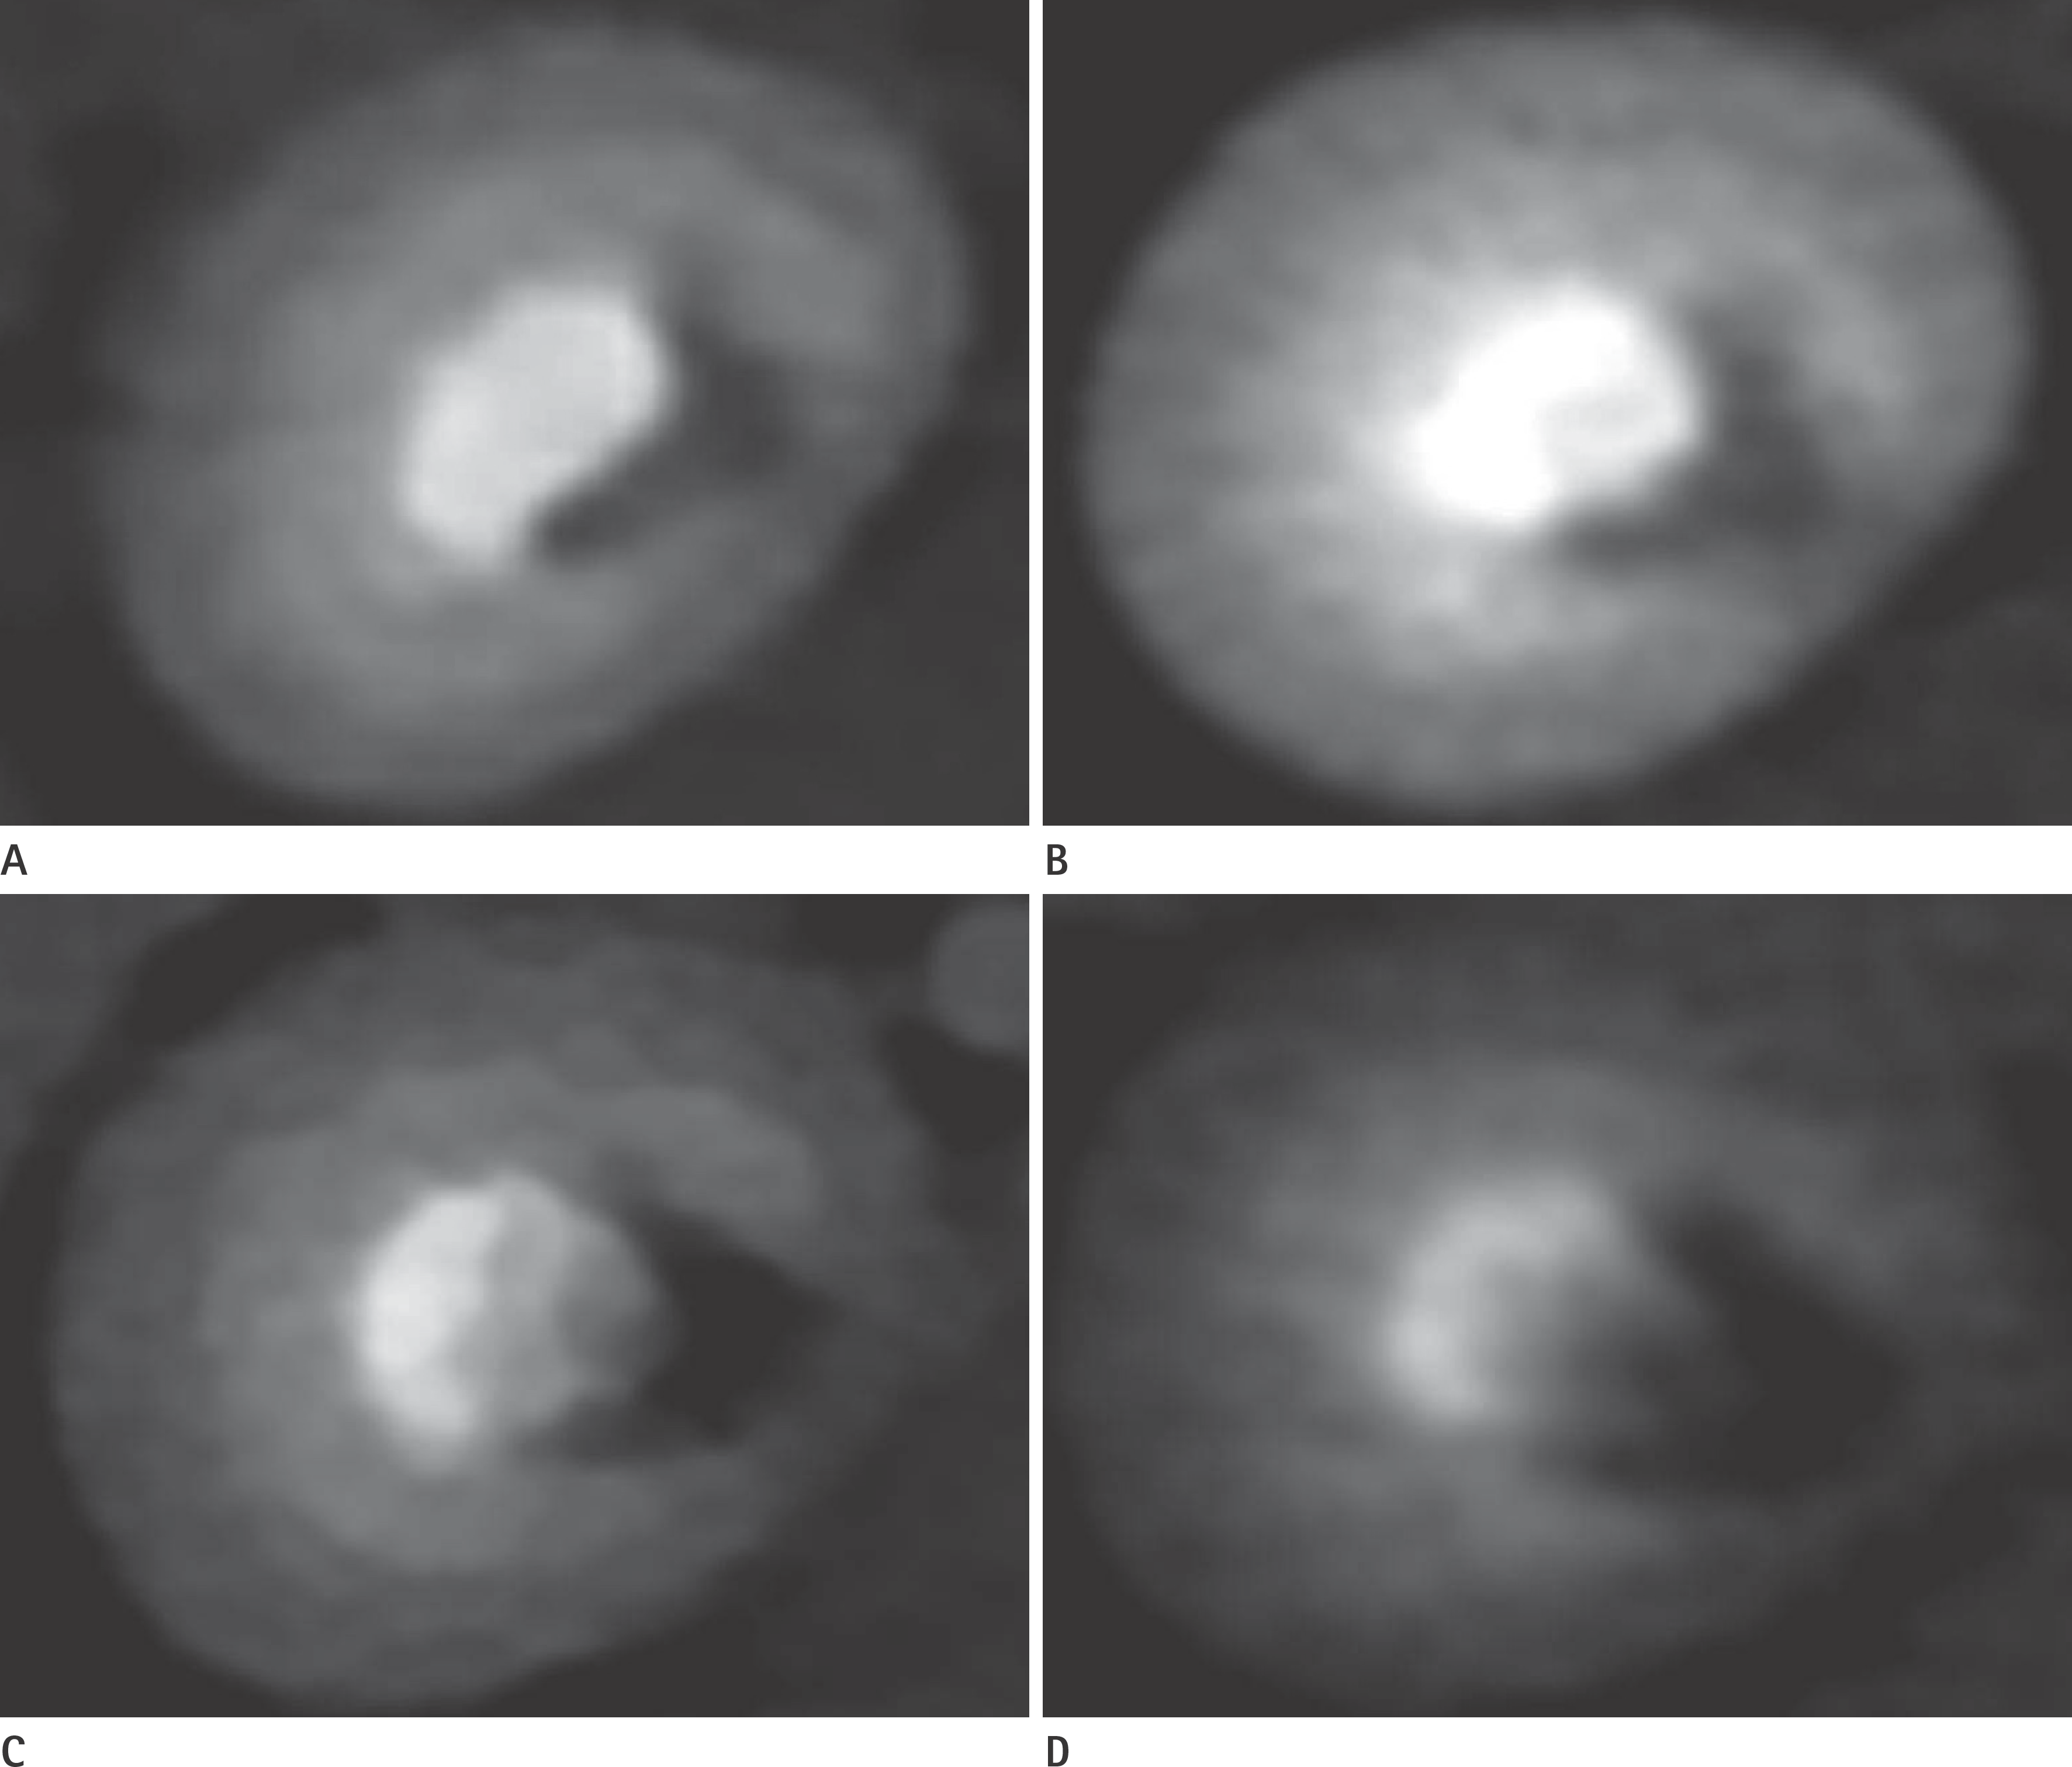
 | Fig. 2.Representative axial images of right kidney obtained at 35 s for each group. Between the groups given the 350 mgI/mL contrast material, the overall quality of the image of the study group (A) is better than that of the control group (B), although the image texture is worse in the study group (blocky appearance). Similarly, between the groups given 240 mgI/mL contrast material, the qualitative image quality of the study group (C) is better than that of the control group (D), despite worse image texture of the study group. All of the images are displayed at the same window width of 900 HU and level of 450 HU settings. HU = Hounsfield units |
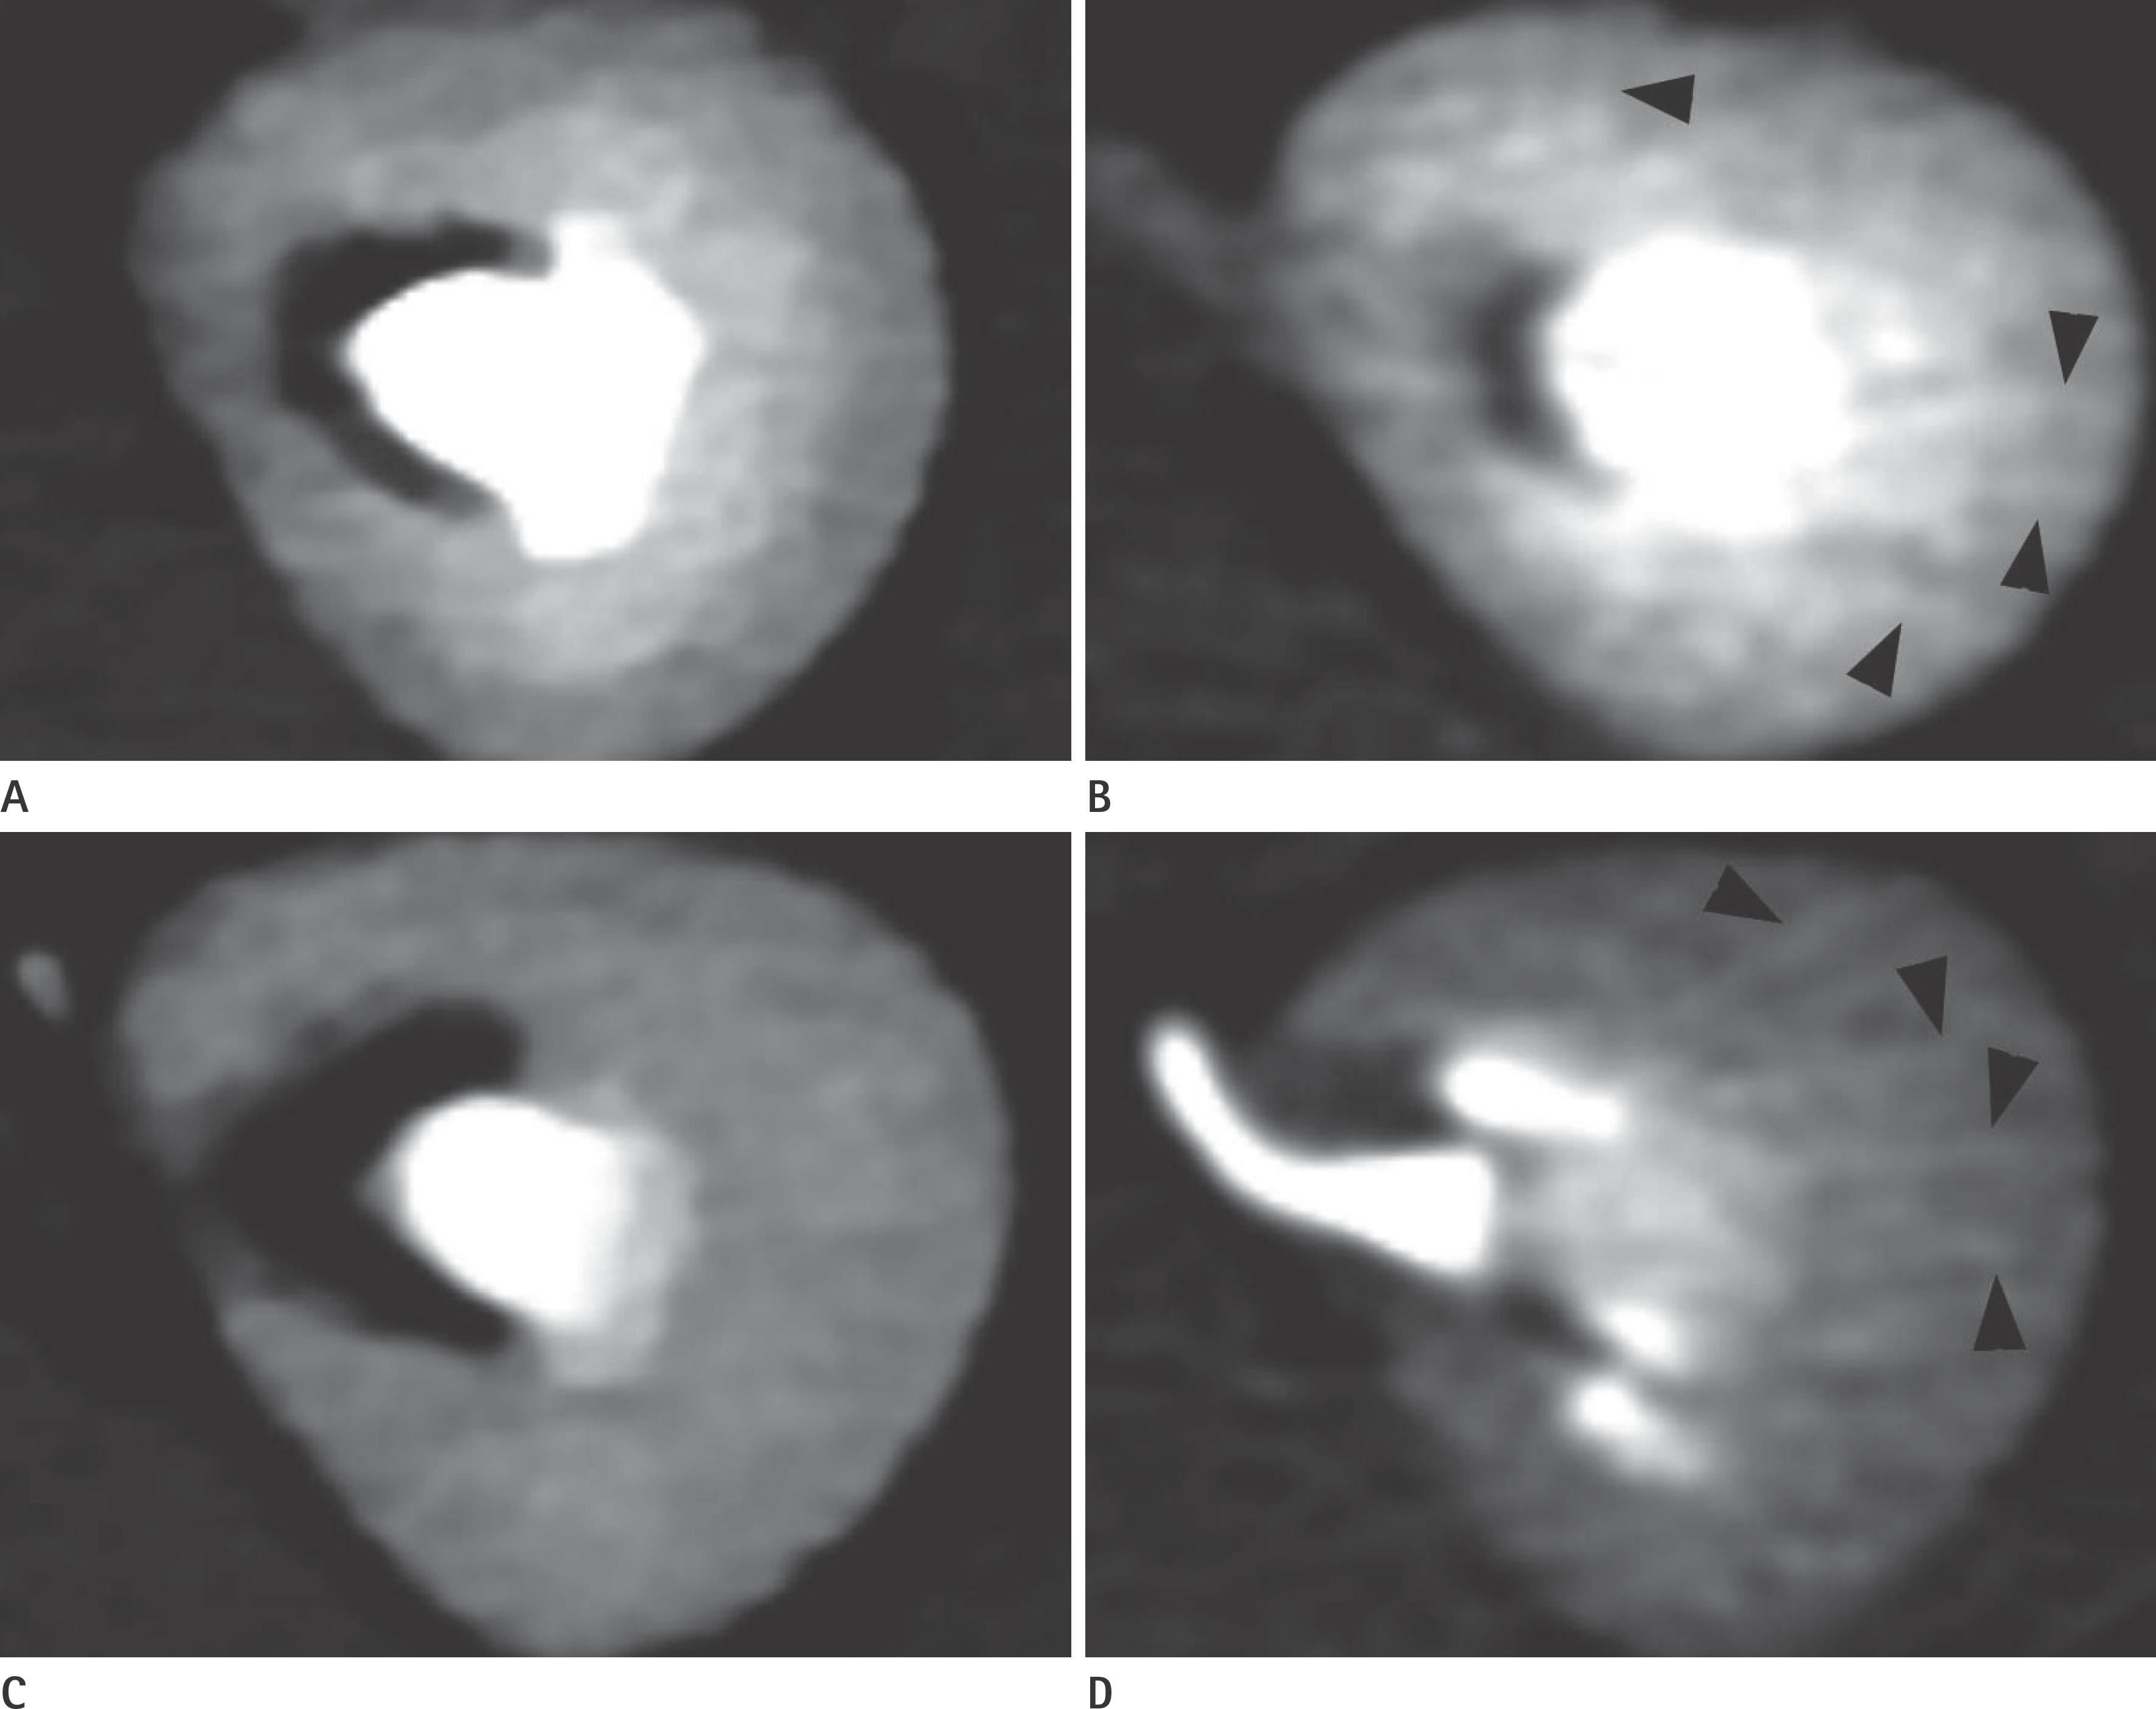
 | Fig. 3Representative axial images of left kidney obtained at 65 s for each group. The images of the control groups given 350 mgI/mL contrast material (B) and 240 mgI/mL contrast material (D) show noticeable streak artifacts that extend to the periphery of the kidney parenchyma (arrowheads). However, the images of the study groups given 350 mgI/mL contrast material (A) and 240 mgI/mL contrast material (C) depict well-defined boundaries of intrarenal structures and negligible streak artifacts. All of the images are displayed with the same window width of 500 HU and level of 350 HU settings. HU = Hounsfield units |
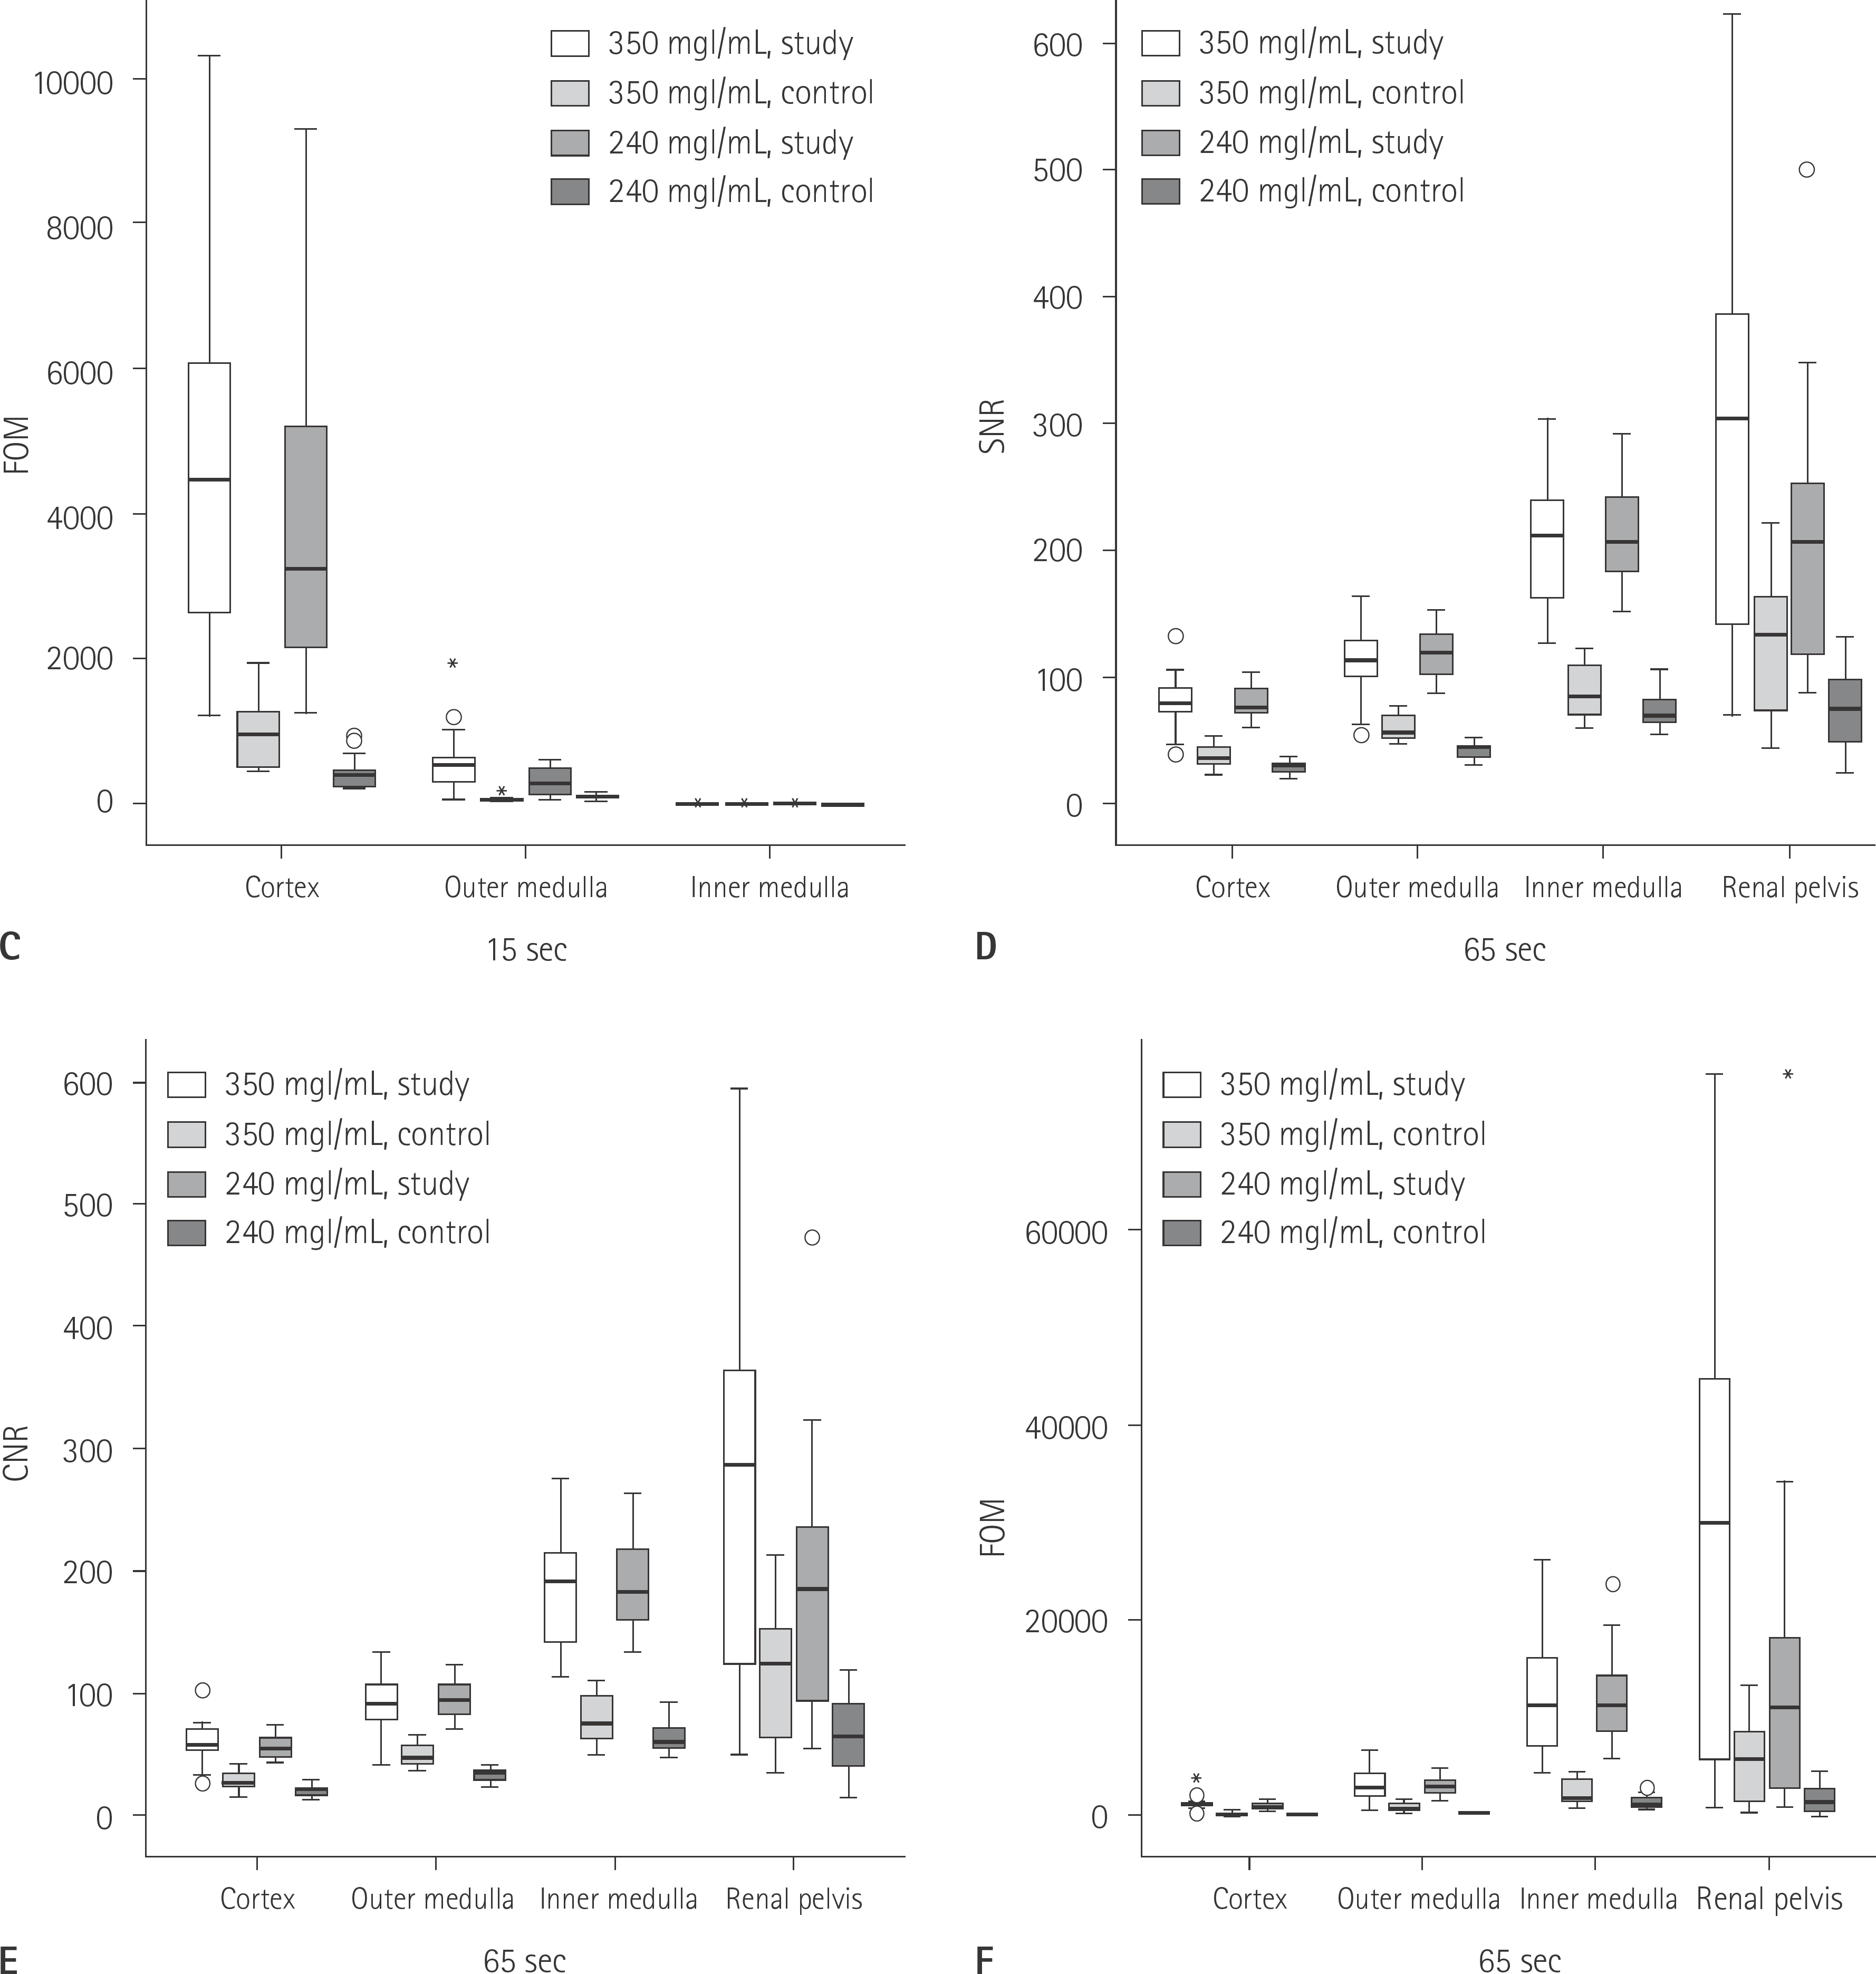
 | Fig. 4Box-and-whisker plots show comparisons of the SNR, CNR, and FOM values of each intrarenal structure according to dynamic phase and contrast material concentration. Ends of boxes are 25th and 75th quartiles and lines across middles of boxes are medians. Maximum and minimum values are displayed with whiskers connecting points to center box. During the corticomedullary phase of 15 s, the median values of SNR (A), CNR (B), and FOM (C) at each intrarenal structure are higher in the study group than in the control group, regardless of contrast material concentration. During subsequent nephrographic phase of 65 s, the quantitative image parameters of SNR (D), CNR (E), and FOM (F) are better in the study group than in the control group for both contrast material concentration. CNR = contrast-to-noise ratio, FOM = figure of merit, SNR = signal-to-noise ratio |
Table 1.
Comparison of Qualitative Image Quality for Each Contrast Material Concentration
| Qualitative Parameters | 350 mgI/mL | 240 mgI/mL | p-Value 1∗ | p-Value 2† | p-Value 3‡ | ||
|---|---|---|---|---|---|---|---|
| Study | Control | Study | Control | ||||
| 5 s | |||||||
| Image sharpness | 2.8 ± 0.4 | 1.7 ± 0.5 | 2.4 ± 0.8 | 1.2 ± 0.4 | < 0.000 | < 0.000 | 0.143 |
| Image noise | 2.9 ± 0.3 | 1.7 ± 0.5 | 2.3 ± 0.8 | 1.5 ± 0.5 | < 0.000 | < 0.000 | 0.999 |
| Image texture | 2.5 ± 0.5 | 3.8 ± 0.4 | 3.3 ± 0.7 | 3.7 ± 0.5 | < 0.000 | 0.063 | 0.023 |
| Streak artifacts | 4.0 ± 0.0 | 4.0 ± 0.0 | 4.0 ± 0.0 | 4.0 ± 0.0 | 0.999 | 0.999 | 0.999 |
| 15 s | |||||||
| Image sharpness | 2.9 ± 0.3 | 1.9 ± 0.3 | 2.8 ± 0.4 | 1.7 ± 0.5 | < 0.000 | < 0.000 | 0.739 |
| Image noise | 2.9 ± 0.3 | 2.0 ± 0.0 | 3.0 ± 0.0 | 1.9 ± 0.3 | < 0.000 | < 0.000 | 0.739 |
| Image texture | 2.7 ± 0.5 | 3.8 ± 0.4 | 3.3 ± 0.5 | 3.9 ± 0.3 | < 0.000 | 0.023 | 0.052 |
| Streak artifacts | 4.0 ± 0.0 | 4.0 ± 0.0 | 4.0 ± 0.0 | 4.0 ± 0.0 | 0.999 | 0.999 | 0.999 |
| 35 s | |||||||
| Image sharpness | 2.7 ± 0.7 | 2.0 ± 0.0 | 2.7 ± 0.5 | 1.8 ± 0.4 | 0.007 | 0.003 | 0.796 |
| Image noise | 3.0 ± 0.0 | 2.1 ± 0.3 | 3.0 ± 0.0 | 2.0 ± 0.0 | < 0.000 | < 0.000 | 0.999 |
| Image texture | 2.0 ± 0.0 | 3.9 ± 0.3 | 2.1 ± 0.6 | 4.0 ± 0.0 | < 0.000 | < 0.000 | 0.739 |
| Streak artifacts | 3.7 ± 0.5 | 3.3 ± 0.5 | 4.0 ± 0.0 | 3.5 ± 0.5 | 0.143 | 0.063 | 0.280 |
| 65 s | |||||||
| Image sharpness | 2.9 ± 0.3 | 2.0 ± 0.0 | 2.9 ± 0.3 | 1.8 ± 0.4 | < 0.000 | < 0.000 | 0.999 |
| Image noise | 3.0 ± 0.0 | 2.1 ± 0.3 | 2.9 ± 0.3 | 2.0 ± 0.0 | < 0.000 | < 0.000 | 0.739 |
| Image texture | 2.6 ± 0.5 | 3.9 ± 0.3 | 3.2 ± 0.6 | 4.0 ± 0.0 | < 0.000 | 0.007 | 0.075 |
| Streak artifacts | 3.8 ± 0.4 | 2.9 ± 0.3 | 3.9 ± 0.3 | 3.1 ± 0.6 | 0.001 | 0.005 | 0.739 |
Table 2.
Comparison of the CT Attenuation Values at the Renal Structures
Table 3.
Comparison of Image Noise and Radiation Dose
| 350 mgI/mL | 240 mgI/mL | p-Value 1∗ | p-Value 2† | p-Value 3‡ | |||
|---|---|---|---|---|---|---|---|
| Study | Control | Study | Control | ||||
| Image noise | 3.96 ± 0.9 | 9.35 ± 1.1 | 3.18 ± 0.6 | 8.84 ± 0.9 | < 0.000 | < 0.000 | < 0.000 |
| Effective dose (mSv) | 2.83 ± 0.1 | 2.78 ± 0.2 | 2.71 ± 0.2 | 2.69 ± 0.1 | 0.105 | 0.684 | 0.075 |


 PDF
PDF ePub
ePub Citation
 Print
Print


 XML Download