Abstract
Purpose
To compare the difference of contrast sensitivity and color vision in patients with cataracts under three illuminations (fluorescent light, three-wavelength light emitting diode [LED], and quantum dot LED).
Methods
Thirty eyes with normal intraocular pressure and normal fundus of patients who visited the outpatient clinic for the treatment of cataract were included. In patients with cataracts with grade 2 of nucleus color/opalescence according to the Lens Opacities Classification System, version III (LOCS III) and without cataracts in the cortex or posterior pole of the slit lamp examination, contrast sensitivity and color vision test were performed under fluorescent light, three-wavelength LED, and quantum dot LED.
Results
The error scores of quantum dot LED were significantly lower than those of fluorescent light and three-wavelength LED (p < 0.05), and the error scores of blue spectrum was relatively higher than those of other colors.
Conclusions
In cataract patients, the difference of color sensation occurs due to illumination in color vision test, and it is considered that the degree of color sensitivity is more severe in insufficient illumination and low color rendering index in color vision test. If we replace the indoor lighting with the light source distribution similar to the sunlight and replace it with the illumination with high color rendering index, we can render higher quality of life to cataract patients through psychophysical advantage and high color perception.
References
1. Erichsen JH, Brøndsted AE, Kessel L. Effect of cataract surgery on regulation of circadian rhythms. J Cataract Refract Surg. 2015; 41:1997–2009.

2. Mamalis N. Effect of cataract surgery on circadian rhythms. J Cataract Refract Surg. 2015; 41:1799–800.

3. Yoon HC, Oh JH, Lee S, et al. Circadian-tunable perovskite abdominal dot-based down-converted multi-package white LED with a color fidelity index over 90. Sci Rep. 2017; 7:2808.

4. Yoon CG, Choi HK. A study on the various light source radiation conditions and use of LED illumination for plant factory. J Korean Inst Illum Electr Install Eng. 2011; 25:14–22.

5. Qasim K, Lei W, Li Q. Quantum dots for light emitting diodes. J Nanosci Nanotechnol. 2013; 13:3173–85.

6. Moss ID, Wild JM, Whitaker DJ. The influence of age-related abdominal on blue-on-yellow perimetry. Invest Ophthalmol Vis Sci. 1995; 36:764–73.
7. Rouhiainen P, Rouhiainen H, Salonen JT. Contrast sensitivity in different types of early lens opacities. Acta Ophthalmol Scand. 1996; 74:379–83.

8. Friström B, Lundh BL. Colour contrast sensitivity in cataract and pseudophakia. Acta Ophthalmol Scand. 2000; 78:506–11.

9. Shandiz JH, Dearakhshan A, Daneshyar A, et al. Effect of cataract type and severity on visual acuity and contrast sensitivity. J Ophtalmic Vis Res. 2011; 6:26–31.
10. Todescato F, Fortunati I, Minotto A, et al. Engineering of semi-conductor nanocrystals for light emitting applications. Materials (Basel). 2016; 9:pii:E672.doi:. DOI: 10.3390/ma9080672.

11. Erdem T, Nizamoglu S, Sun XW, Demir HV. A photometric abdominal of ultra-efficient LEDs with high color rendering index and high luminous efficacy employing nanocrystal quantum dot luminophores. Opt Express. 2010; 18:340–7.
12. Wood V, Bulović V. Colloidal quantum dot light-emitting devices. Nano Rev. 2010; 1:doi:. DOI: 10.3402/nano.v1i0.5202. Epub 2010 Jul 7.

13. Lim KO, Kim TJ, Lee JH. Sensitivity and color vision comparison between clear and yellow-tinted intraocular lens in diabetic retinopathy. J Korean Ophthalmol Soc. 2012; 53:238–45.
14. Kinnear PR, Sahraie A. New Farnsworth-Munsell 100 hue test norms of normal observers for each year of age 5–22 and for age decades 30–70. Br J Ophthalmol. 2002; 86:1408–11.

15. Erdem T, Demir HV. Color science of nanocrystal quantum dots for lighting and displays. Nanophotonics. 2013; 2:57–81.

16. Judd DB, MacAdam DL, Wyszecki G, et al. Spectral distribution of typical daylight as a function of correlated color temperature. J Opt Soc Am. 1964; 54:1031–40.

17. Zahiruddin K, Banu S, Dharmarajan R, et al. Effect of illumination on colour vision testing with Farnsworth-Munsell 100 hue test: customized colour vision booth versus room illumination. Korean J Ophthalmol. 2010; 24:159–62.

18. Buhren J, Terzi E, Bach M, et al. Measuring contrast sensitivity abdominal different lighting coditions: comparision of three tests. Optom Vis Sci. 2006; 83:290–8.
19. Tosini G, Ferguson I, Tsubota K. Effects of blue light on the abdominal system and eye physiology. Mol Vis. 2016; 22:61–72. eCollection 2016.
Figure 1.
This graph shows Error score of Farnsworth-Munsell (FM) 100 hue test in control group with different illumination light. p > 0.05. LED = light emitting diode. Based on one-way analysis of variance (ANOVA) test.
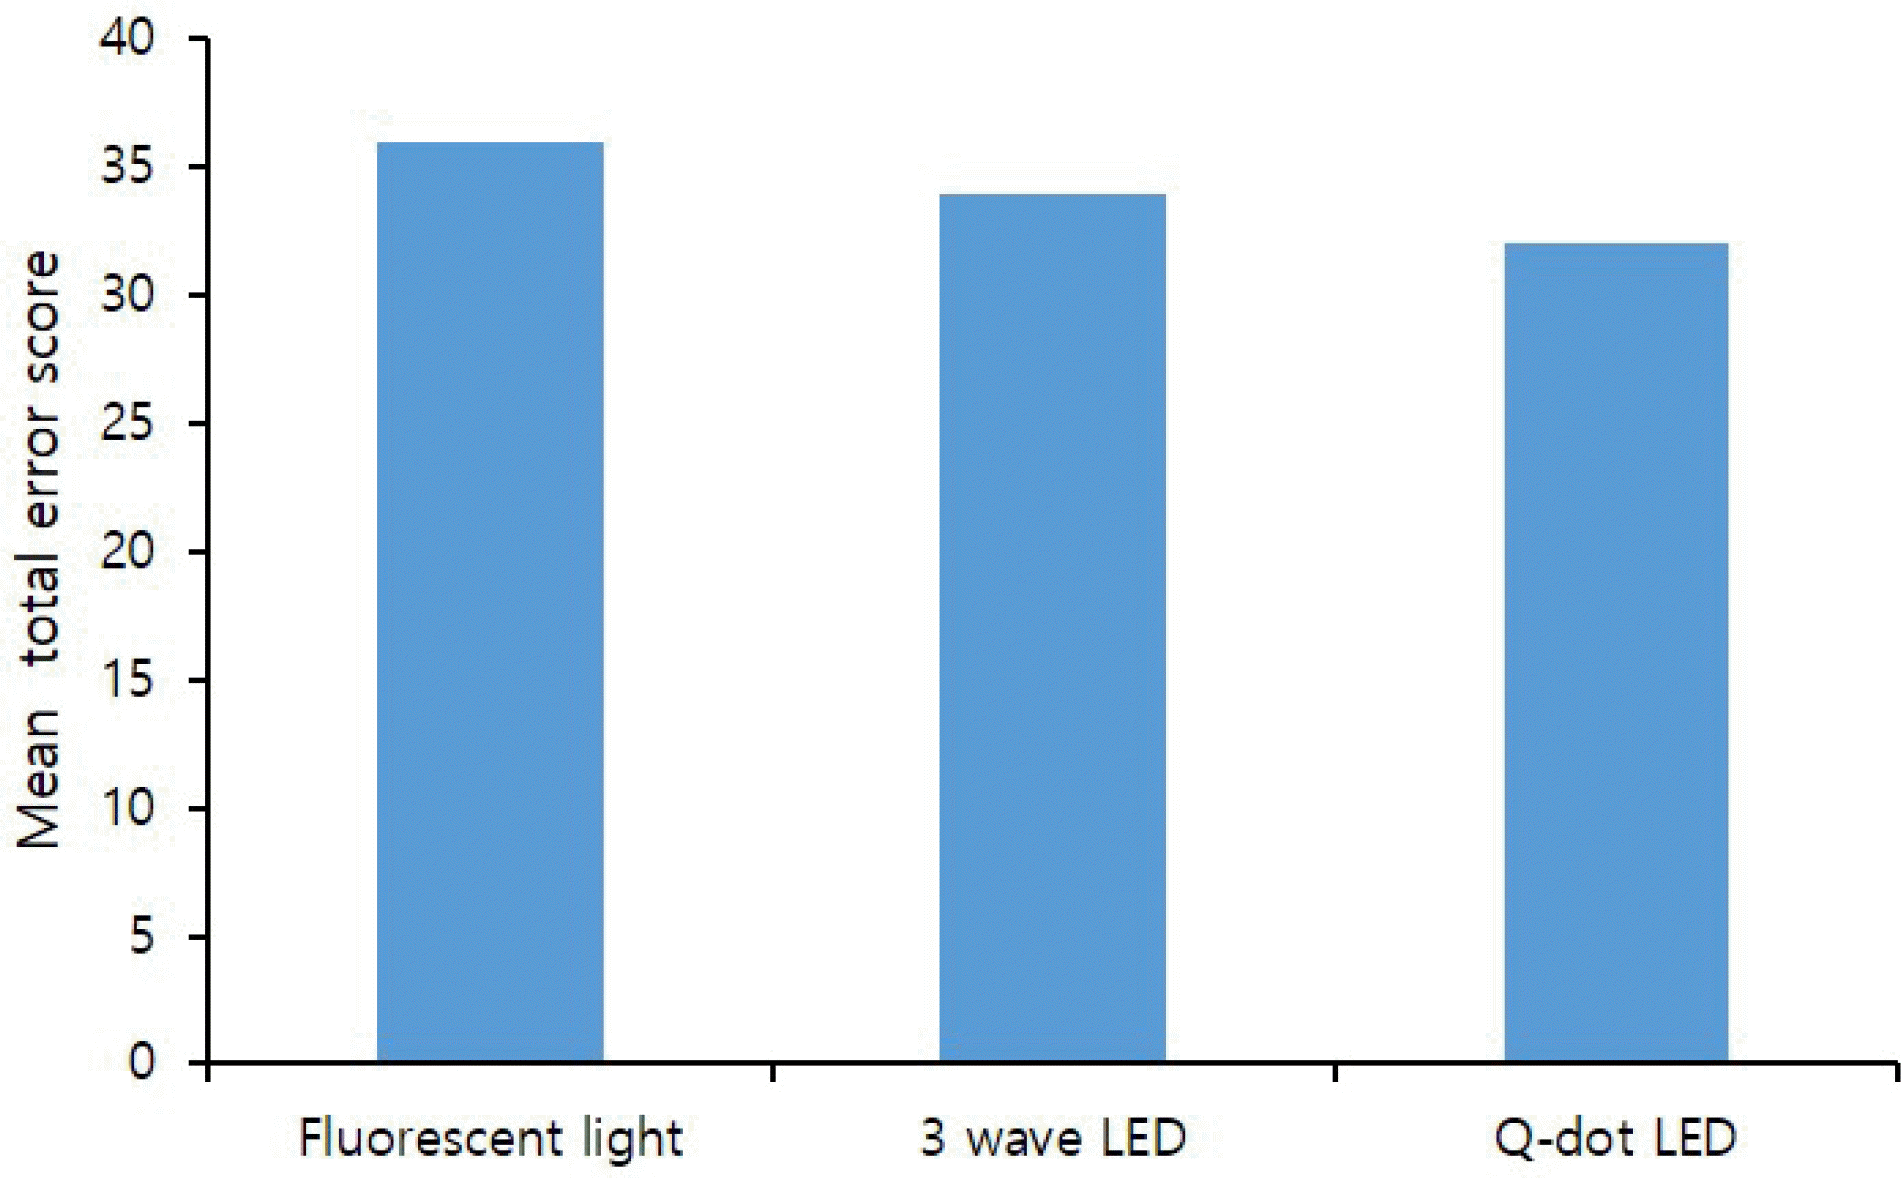
Figure 2.
Contrast sensitivity scores in log unit of three groups at four different spatial frequencies. Vertical bar means ± standard deviation. No statistical difference was found between three lighting source groups at all spatial frequencies (p-value was 0.875, 0.961, 0.864 and 0.921 at 3, 6, 12 and 18 cycles per degree). Based on one-way analysis of variance (ANOVA) test. LED = light emitting diode.
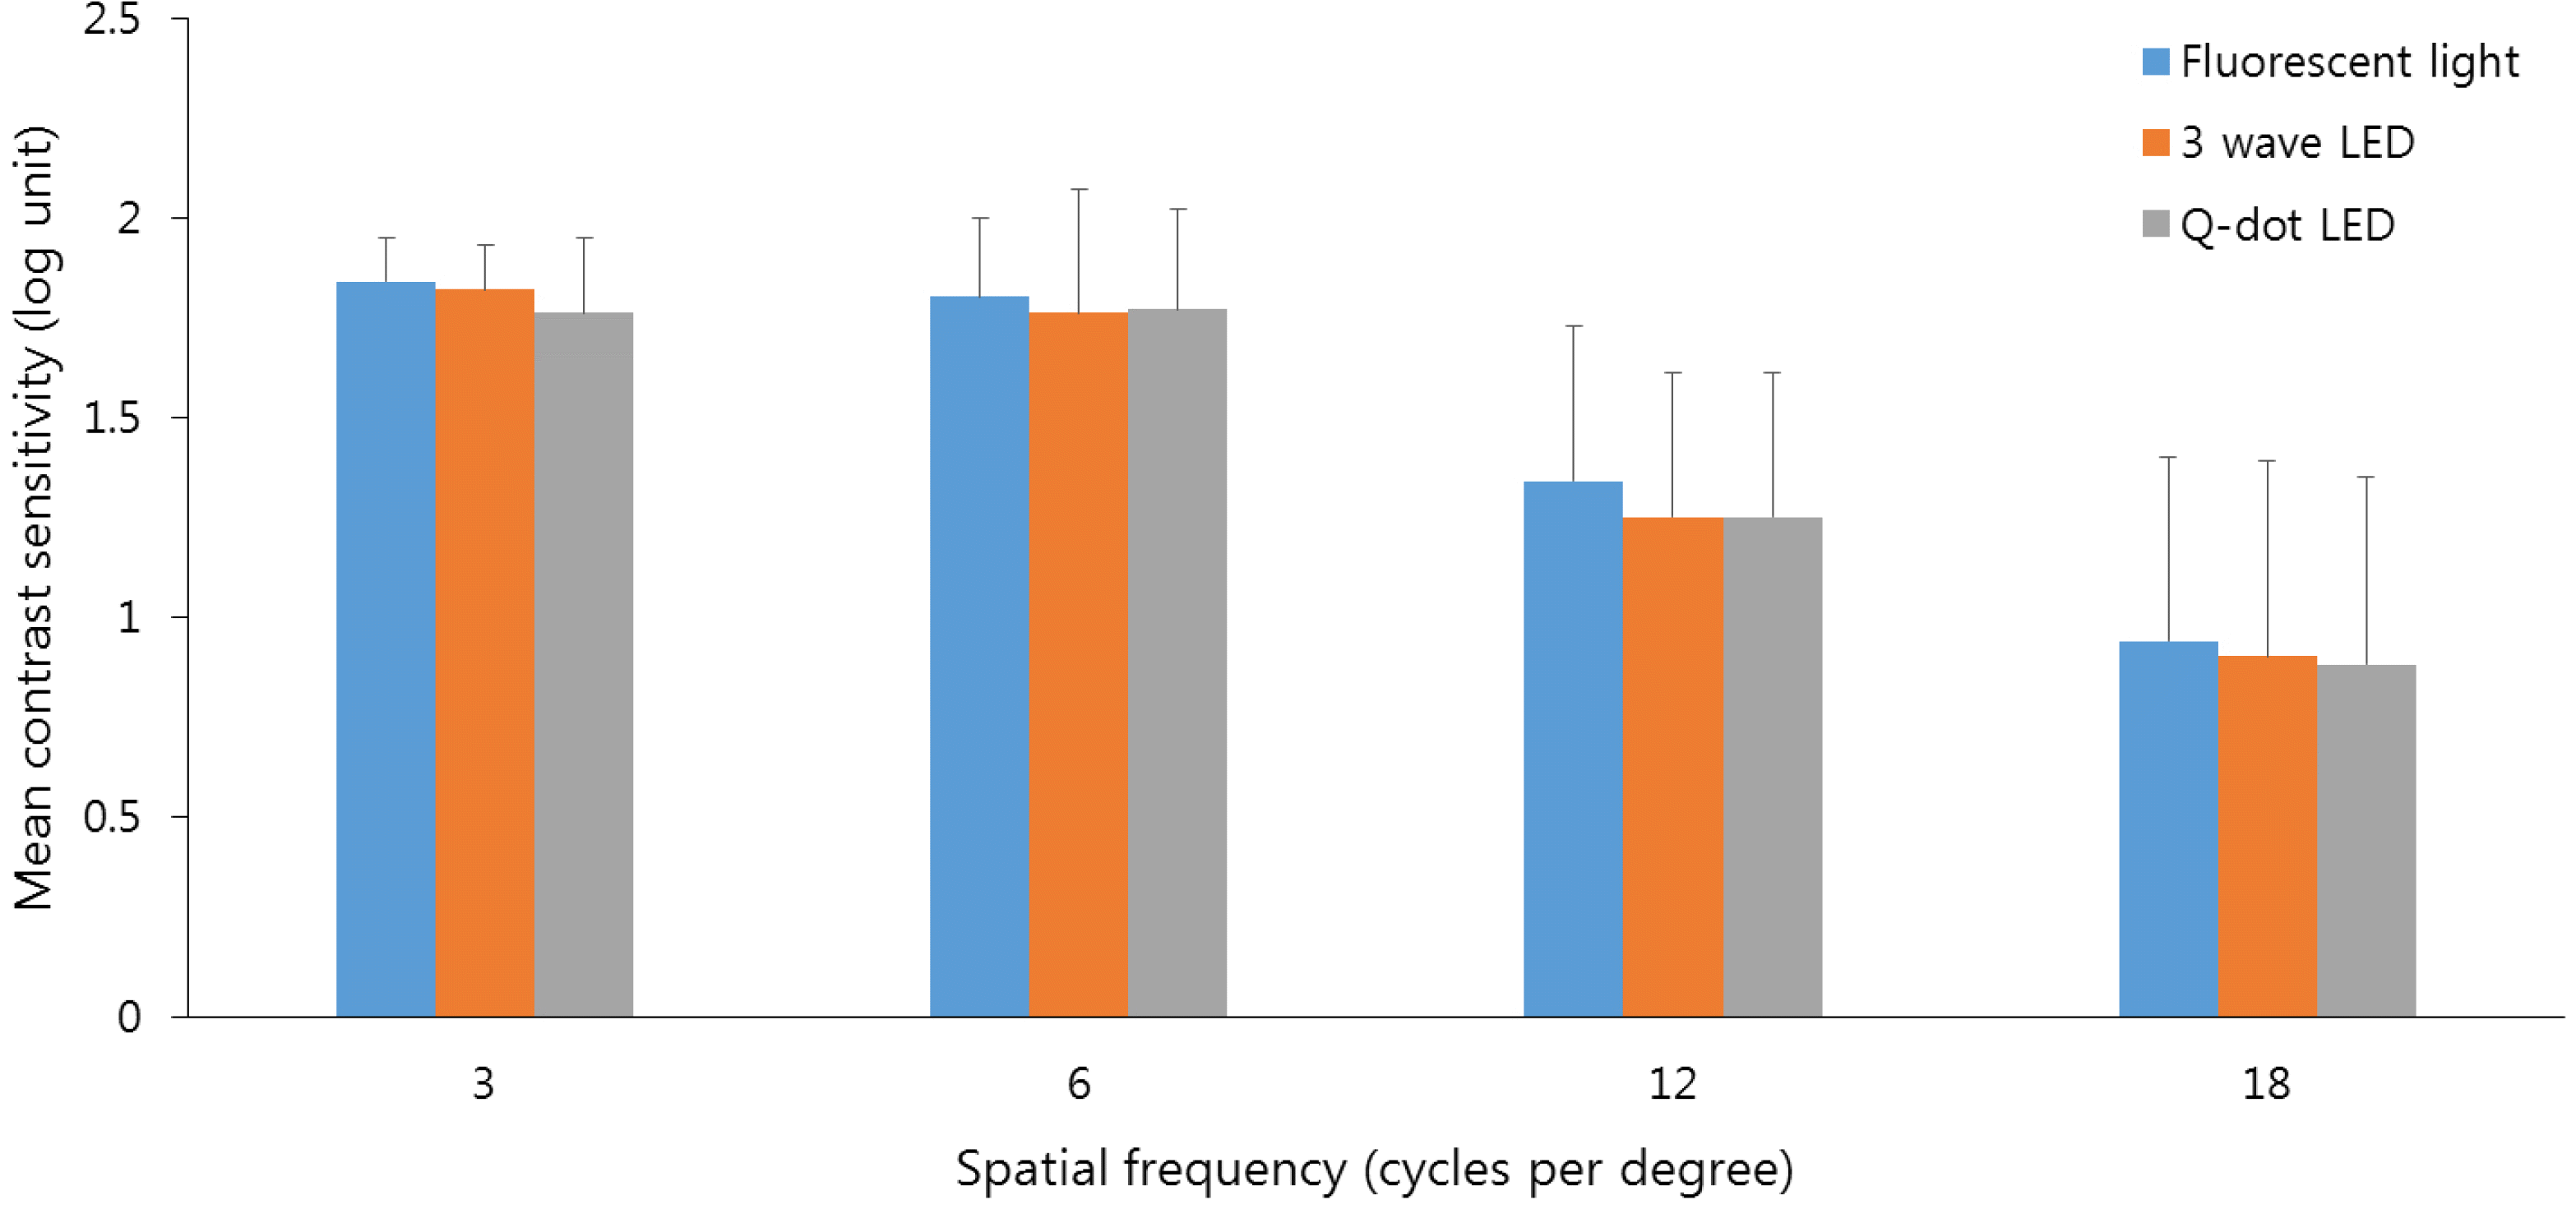
Figure 3.
This graph shows Error score of 4 rows of Farnsworth-Munsell (FM) 100 hue test with fluorescent light. p = 0.024. Based on one-way analysis of variance (ANOVA) test.
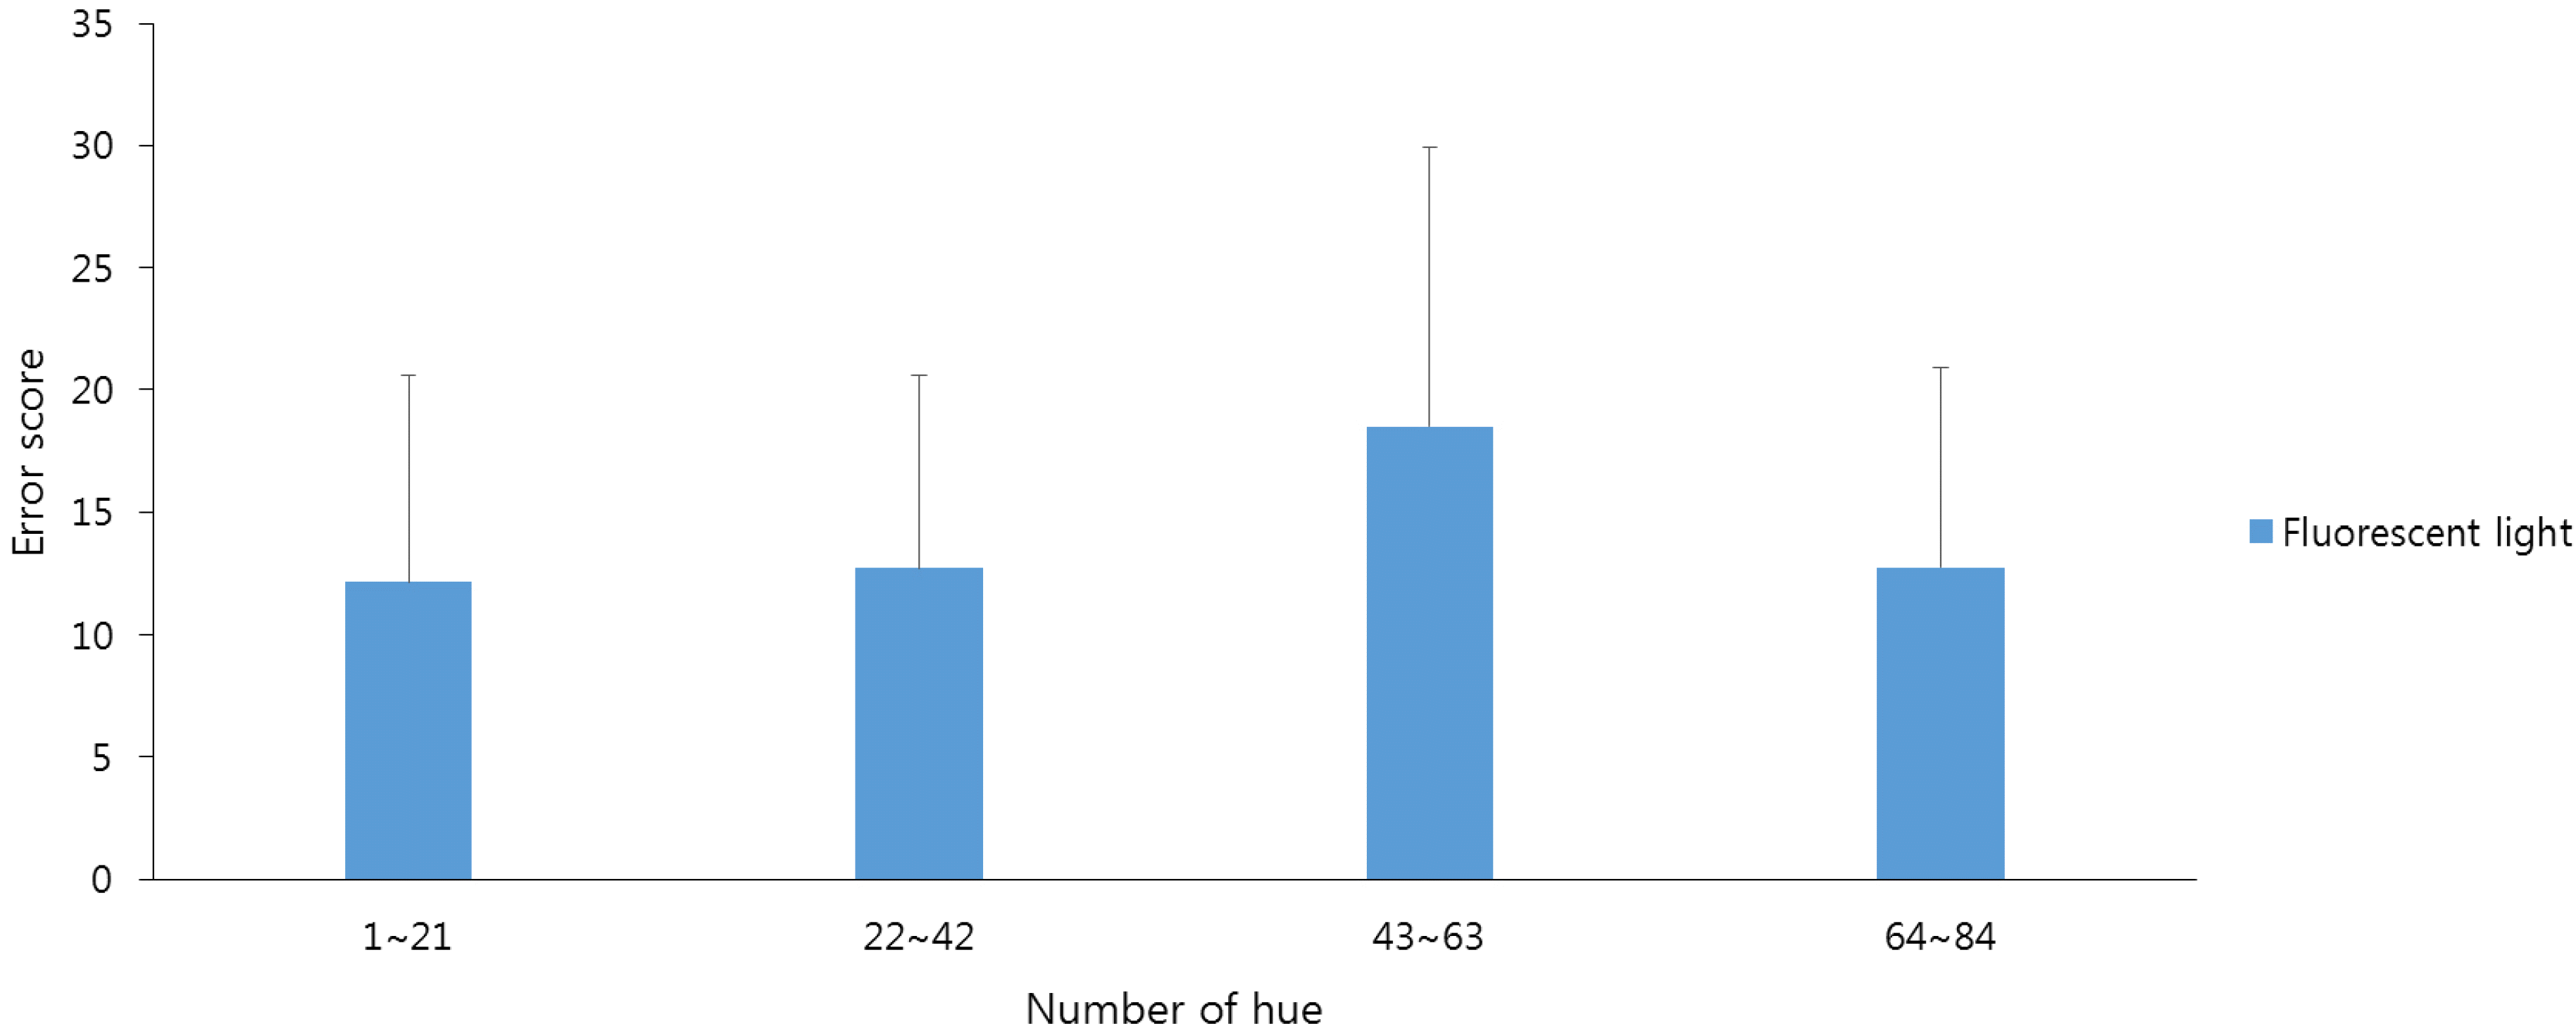
Figure 4.
This graph shows Error score of 4 rows of Farnsworth-Munsell (FM) 100 hue test with 3 wave light emitting diode (LED). p = 0.036. Based on one-way analysis of variance (ANOVA) test.
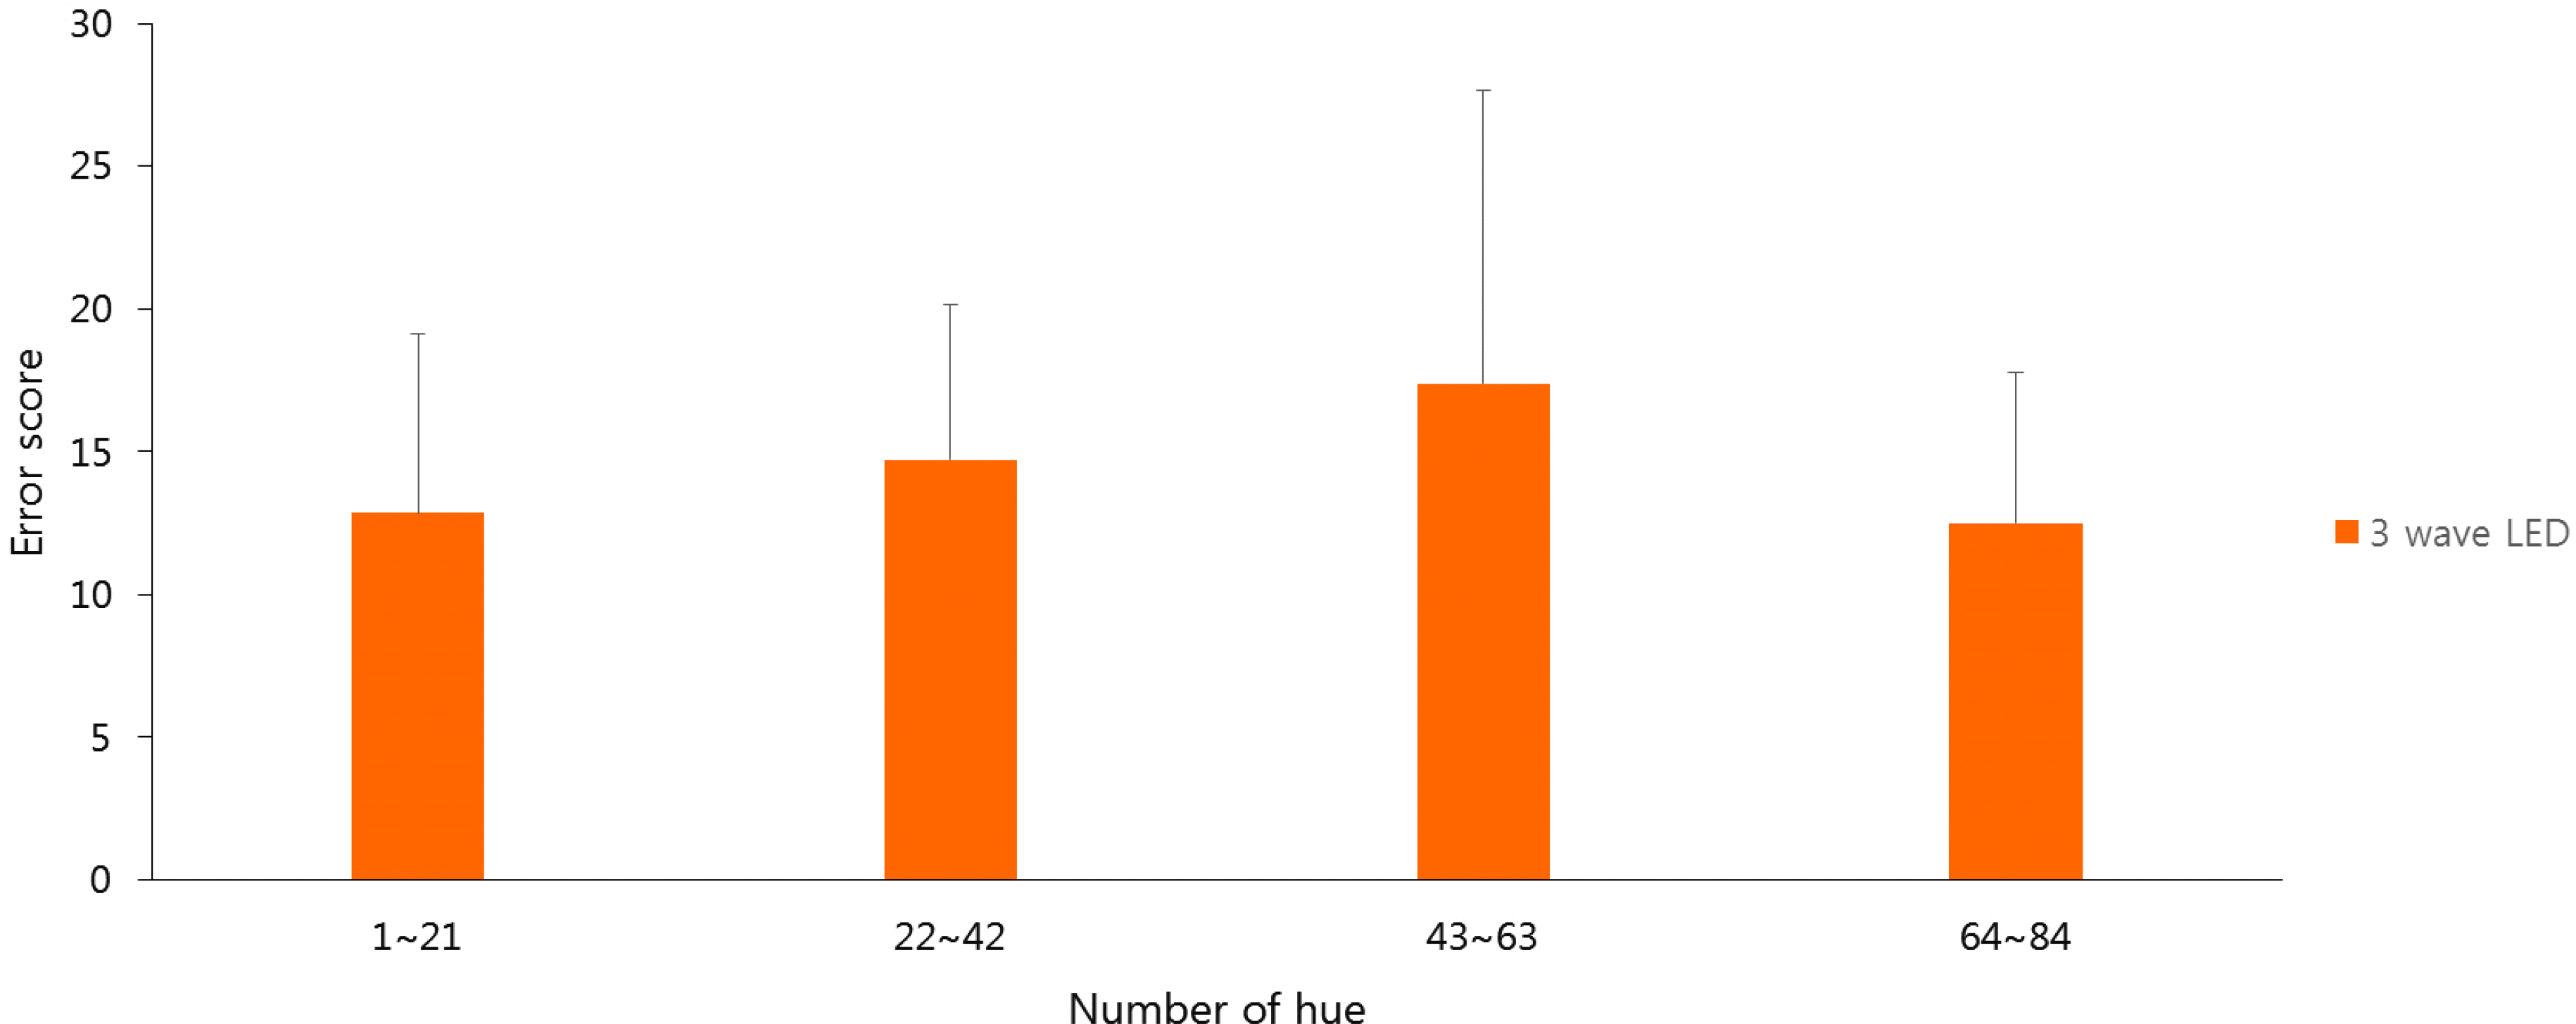
Figure 5.
This graph shows Error score of 4 rows of Farnsworth-Munsell (FM) 100 hue test with Q-dot light emitting diode (LED). p = 0.048. Based on one-way analysis of variance (ANOVA) test.
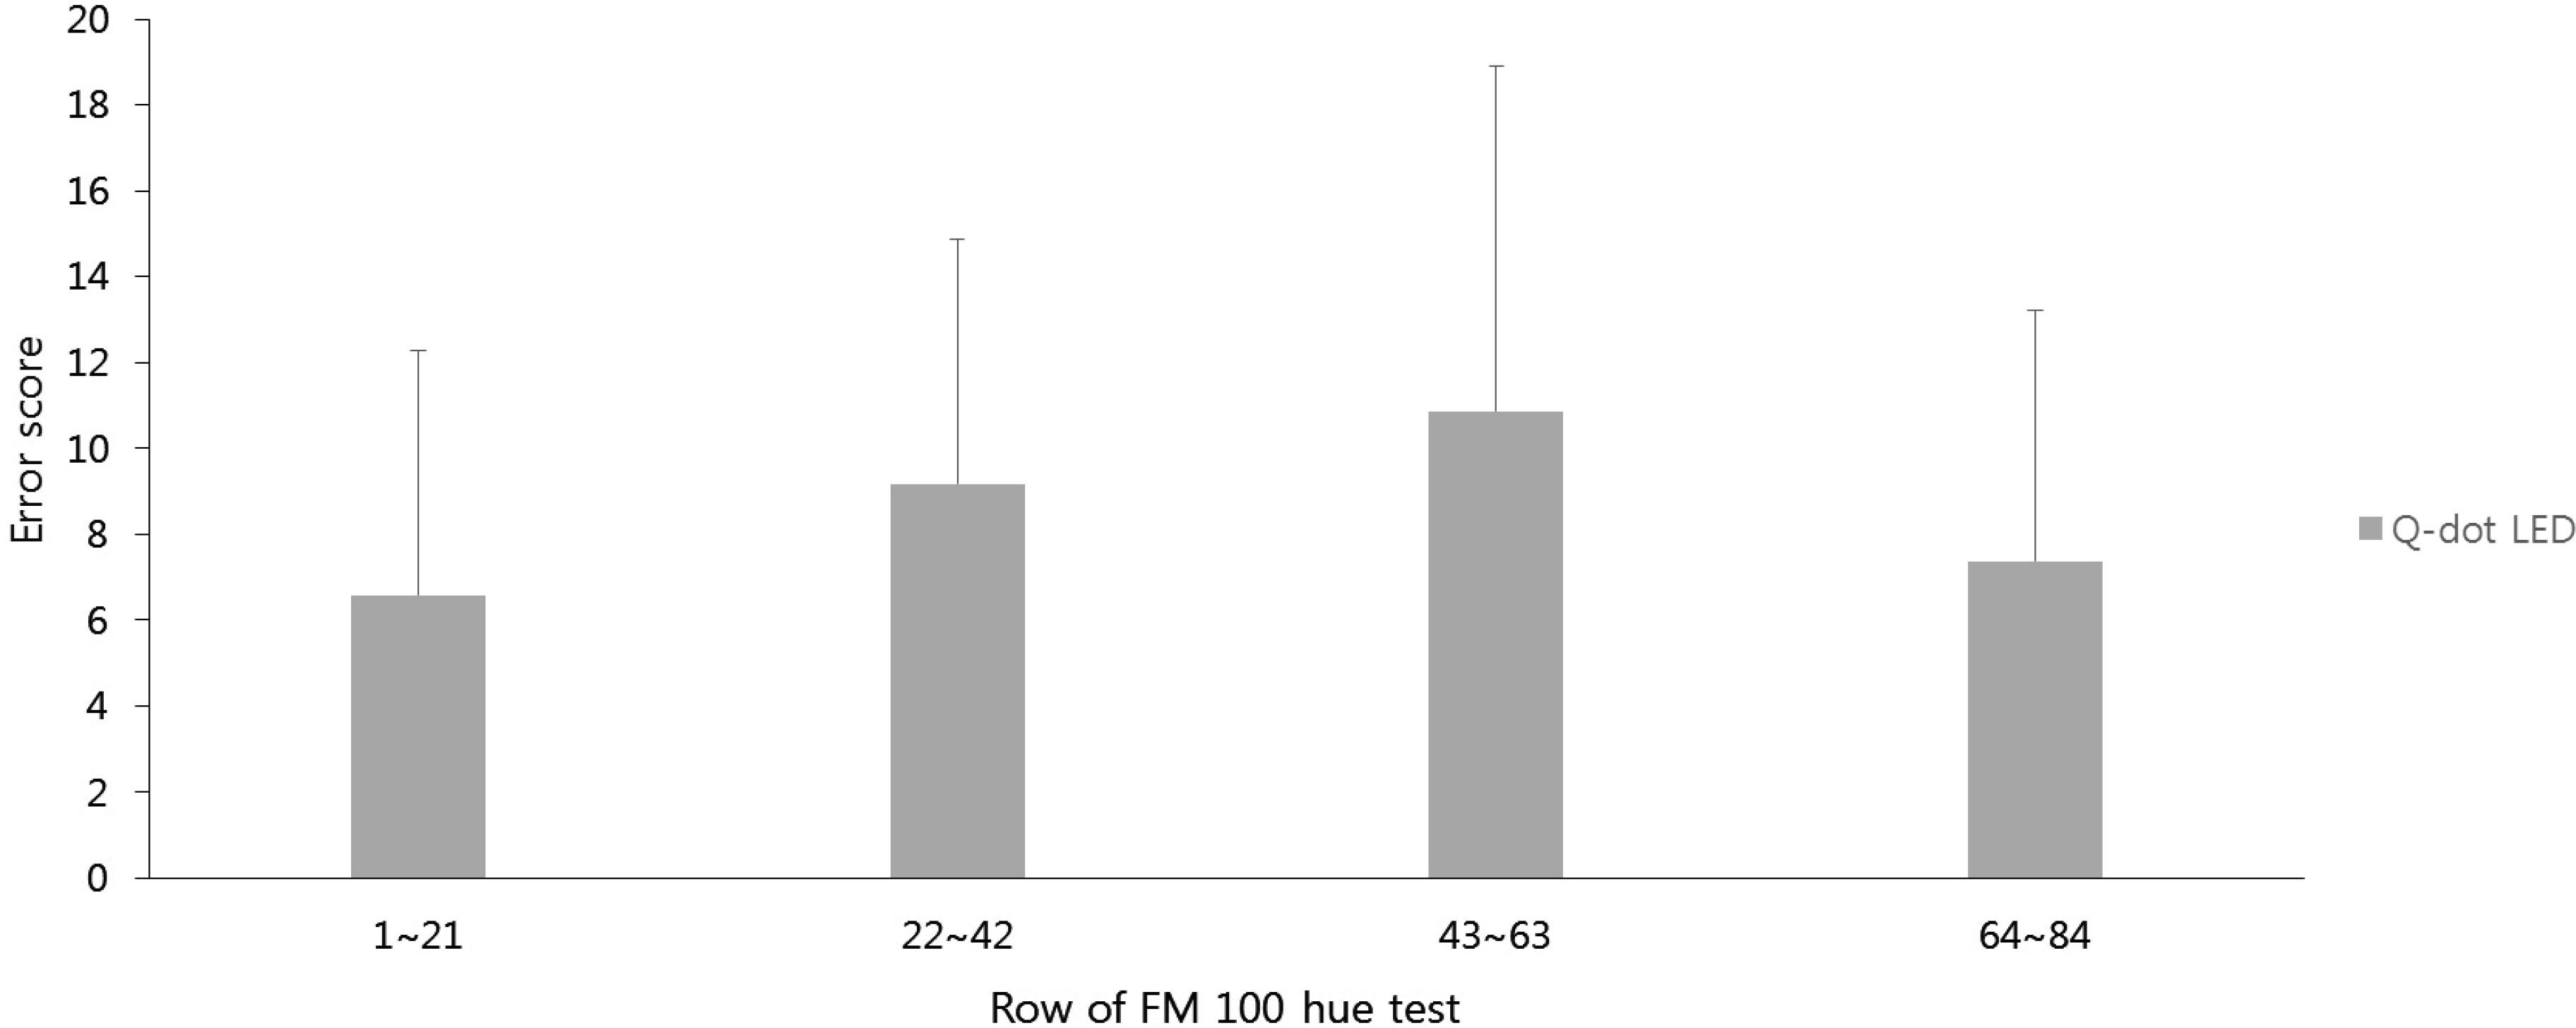
Table 1.
Contrast sensitivity test results for according to the each illumination in control group (log unit)
| 3 cpd | 6 cpd | 12 cpd | 18 cpd | |
|---|---|---|---|---|
| Fluorescent light | 1.90 ± 0.11 | 2.05 ± 0.20 | 1.71 ± 0.39 | 1.25 ± 0.46 |
| 3 wave LED | 1.88 ± 0.11 | 1.98 ± 0.31 | 1.69 ± 0.36 | 1.33 ± 0.49 |
| Q dot LED | 1.87 ± 0.19 | 2.00 ± 0.25 | 1.77 ± 0.36 | 1.31 ± 0.47 |
| p-value* | 0.975 | 0.966 | 0.924 | 0.915 |
Table 2.
Demographic data
| Total number of eyes | Sex (male:female) | Age (years) | BSCVA logMAR |
|---|---|---|---|
| 30 | 14:16 | 57.4 (48–65) | 0.23 (0.1–0.3) |
Table 3.
Contrast sensitivity test results for according to the each illumination
| 3 cpd | 6 cpd | 12 cpd | 18 cpd | |
|---|---|---|---|---|
| Fluorescent light | 1.84 ± 0.11 | 1.80 ± 0.20 | 1.34 ± 0.39 | 0.94 ± 0.46 |
| 3 wave LED | 1.82 ± 0.11 | 1.76 ± 0.31 | 1.25 ± 0.36 | 0.90 ± 0.49 |
| Q dot LED p-value* | 1.76 ± 0.190.875 | 1.77 ± 0.25 0.961 | 1.25 ± 0.36 0.864 | 0.88 ± 0.47 0.921 |
Table 4.
Total error scores and each error score at four rows of FM 100 hue test under lighting sources
| Light source |
Error score |
||||
|---|---|---|---|---|---|
| Total | 85–21 | 22–42 | 43–63 | 64–84 | |
| Fluorescent light | 56.17 ± 32.39 | 12.17 ± 8.40 | 12.73 ± 7.85 | 18.50 ± 11.40 | 12.77 ± 8.15 |
| 3 wave LED | 57.20 ± 24.02 | 12.87 ± 6.27 | 14.73 ± 5.42 | 17.37 ± 10.26 | 12.50 ± 5.25 |
| Q dot LED | 33.97 ± 22.54 | 6.57 ± 5.69 | 9.17 ± 5.71 | 10.87 ± 8.02 | 7.37 ± 5.85 |
| p-value* | 0.001 | 0.001 | 0.004 | 0.008 | 0.002 |


 PDF
PDF ePub
ePub Citation
 Print
Print


 XML Download