Journal List > Electrolyte Blood Press > v.16(1) > 1098696

Sung, Song, Park, Kim, and Lee: The Different Expression Patterns of HSP22, a Late Embryogenesis Abundant-like Protein, in Hypertrophic H9C2 Cells Induced by NaCl and Angiotensin II

Abstract

Background

High-NaCl diet is a contributing factor for cardiac hypertrophy. The role of HSP22 as a protective protein during cardiac hypertrophy due to hypernatremia is unclear. Accordingly, this study aimed to establish a cellular hypernatremic H9C2 model and to compare the expression of HSP22 in Ca2+ homeostasis between a high-NaCl and angiotensin II-induced hypertrophic cellular H9C2 model.

Methods

Real-time PCR was performed to compare the mRNA expression. Flow cytometry and confocal microscopy were used to analyze the cells.

Results

The addition of 30 mM NaCl for 48 h was the most effective condition for the induction of hypertrophic H9C2 cells (termed the in vitro hypernatremic model). Cardiac cellular hypertrophy was induced with 30 mM NaCl and 1 µM angiotensin II for 48 h, without causing abnormal morphological changes or cytotoxicity of the culture conditions. HSP22 contains a similar domain to that found in the consensus sequences of the late embryogenesis abundant protein group 3 from Artemia. The expression of HSP22 gradually decreased in the in vitro hypernatremic model. In contrast to the in vitro hypernatremic model, HSP22 increased after exposure to angiotensin II for 48 h. Intracellular Ca2+ decreased in the angiotensin II model and further decreased in the in vitro hypernatremic model. Impaired intracellular Ca2+ homeostasis was more evident in the in vitro hypernatremic model.

Conclusion

The results showed that NaCl significantly decreased HSP22. Decreased HSP22, due to the hypernatremic condition, affected the Ca2+ homeostasis in the H9C2 cells. Therefore, hypernatremia induces cellular hypertrophy via impaired Ca2+ homeostasis. The additional mechanisms of HSP22 need to be explored further.

Introduction

Recently, there has been growing interest in the relationship between cardiac diseases and diet. A long-term, high-salt (NaCl) diet leads to chronic hypernatremia and overall cardiac hypertrophy1). Left ventricular hypertrophy increases the possibility of arrhythmia and even sudden cardiac death2). In addition to a high-salt diet, angiotensin II (Ang II) is a well-known factor that induces cardiac hypertrophy through the renin-angiotensin system(RAS), and it has been used to produce models for cardiac hypertrophy34). However, the direct cellular effects of a high-NaCl diet are not yet clearly understood.
In cardiac hypertrophy, upregulation of early gene expression occurs, such as the expression of sHSP5). Moreover, late embryogenesis abundant (LEA) proteins have similar roles in development, and they are classified into groups, according to their sequence and function67). LEA proteins in group 3 (LEA3), found in Artemia, play protective roles during hypersalinity8). sHSP and LEA3 have similar protective functions, when an organism faces hyperosmolality and various stresses6). However, there is no previous study that shows the relationship between sHSP and LEA proteins.
HSP22 (heat shock protein 22, HspB8, and H11 kinase) is a sHSP that is expressed abundantly in the heart. HSP22 is a mediator of cardiac hypertrophy, and it plays a key role in the regulation of apoptosis, development, and intracellular Ca2+ ions91011121314). The role of HSP22 in cardiac hypertrophy in chronic hypernatremia is currently unknown. Therefore, the aim of the present study was to establish an in vitro hypernatremic model with cardiac cellular hypertrophy, to demonstrate the effectiveness of this model by comparing 2 hypertrophic factors (high NaCl and Ang II), and to identify the LEA like-properties of HSP22 in these 2 different cellular models.

Methods

1. Cell Culture

The rat cardiomyoblast-derived H9C2 cell line was purchased from the Korean Cell Line Bank. The H9C2 cells were maintained in Dulbecco's modified Eagle's medium supplemented with fetal bovine serum(FBS; 10%), penicillin (100 µg/mL), and streptomycin (100 µg/mL) (DMEM) in 5% CO2 humidified air at 37℃.

2. In vitro hypernatremic model

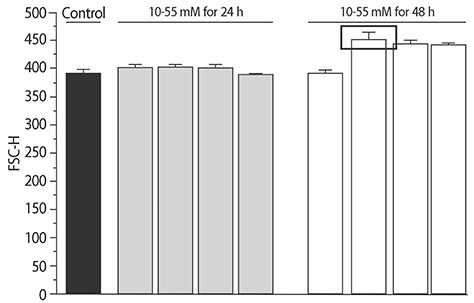
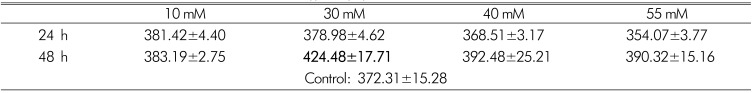
The added concentration and maintenance time for NaCl was selected using the forward side scatter pulse height (FSC-H) values from flow cytometry (Table 1, Supplement 1). Based on this, 30mM NaCl was added to the DMEM. The media were filtered through 0.4 µm filters. Cells were maintained for 48 h to produce the in vitro hypertrophic models.

3. Flow cytometric analysis

Suspended H9C2 cells in PBS (phosphate-buffered saline) were used. To exclude osmotic effects, the cells were incubated in normal osmotic PBS for 30min. After incubation, 10,000 cells were automatically analyzed by FSCH to measure the cell size and side scatter pulse height (SSC-H) in order to study the intracellular granules (FACS Calibur™).

4. Confocal analysis

Cells were fixed in −20℃ methanol for 5 min at room temperature (RT). The cells were washed 3 times with ice-cold PBS and then blocked with 10% FBS in PBS for 30 min at RT. After blocking, the cell nuclei were stained with 1 µg/mL of 2-(4-amidinophenyl)-6-indolecarbamidine dihydrochloride (DAPI) in 3% FBS and PBS for 30 min at RT. After staining with DAPI, the images were visualized with a confocal microscope and a coupled image analysis system(Nikon).

5. HSP22 sequence homology analysis

A search of the amino acid sequences of a conserved domain of HSP22 and various LEA3 proteins was conducted using BLAST15). Utilizing this program, the amino acid sequences in the conserved domains were compared between HSP22 and LEA316).

6. Cell viability

The trypan blue exclusion test was performed17). The results were calculated using the following equation: (the total number of viable cells/the total number of cells)×100.

7. Real-time reverse transcriptase PCR(RT-PCR) and DNA gel electrophoresis

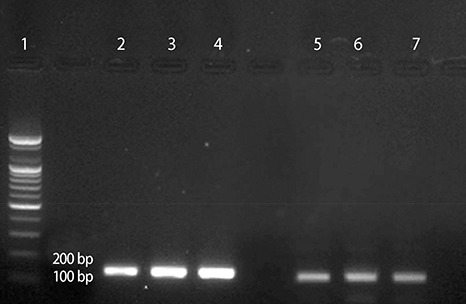
Total RNA was extracted. The RNA quantity and quality were measured using the 260/280 ratio obtained from a Nano-drop spectrophotometer. Using RT-PCR, cDNA was synthesized from RNA. For the analysis of mRNA expression, forward and reverse primers were used (Table 2). One µL of each set of primers was used with TOPreal™ qPCR premix (10 µL), nuclease-free water (20 µL), and a cDNA sample (1 µL). The Tm value of the primers was 58℃. After an initial 10 min at 95℃, 45 cycles of the following protocol were completed: 95℃ for 10s, 60℃ for 15s, and 72℃ for 30s. The fold changes of HSP22 were compared with those of a house keeping gene (18s ribosomal RNA(rRNA)). The data were analyzed using the ΔCt method18). To confirm the primer activities, an ethidium bromide-stained agarose gel (2%) was used for DNA gel electrophoresis. The size of the HSP22 product was 129 base pairs (bp), while that of the 18s rRNA product was 135 bp.

8. Intracellular Ca2+

The cells were loaded with 2mM of the fluorescence probe Calcium Green-1™ in DMEM for 2 h. Cells were washed twice with PBS, and 10,000 cells were analyzed using flow cytometry. Single cells were observed under a confocal microscope after fixation with ice-cold methanol.

9. Statistics

All data were expressed as the mean±S.E., and n indicated the number of cells used. For all tests, cells were obtained from a minimum of 3 different culture dishes for each treatment and experiment. Analysis of the data was conducted using Student's t-test and one-way ANOVA. p<0.05 was considered to be significantly different in the statistical analyses.

Results

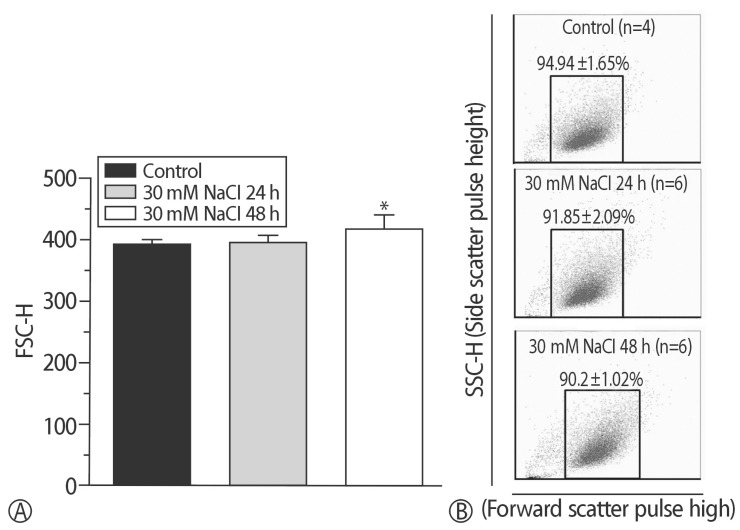
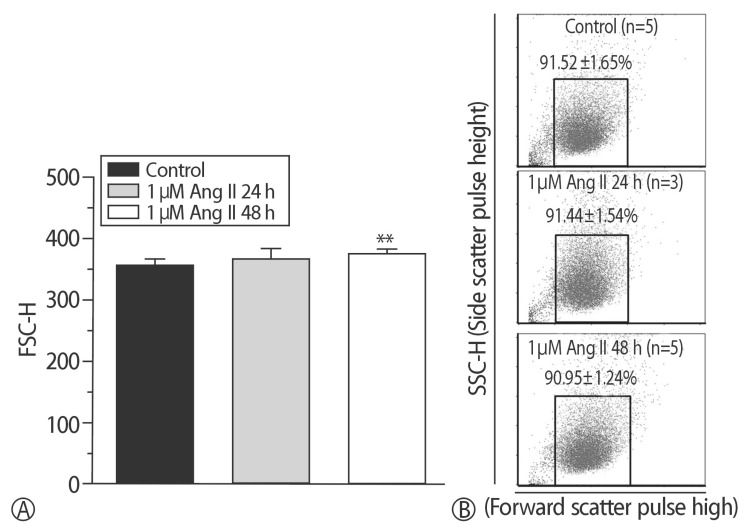
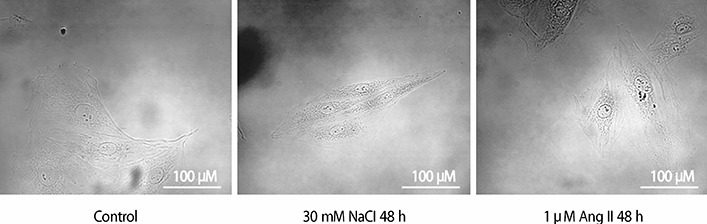
1. Supplementation with 30mM NaCl and 1 µM Ang II for 48 h affects the size of cells without inducing abnormal cytological changes

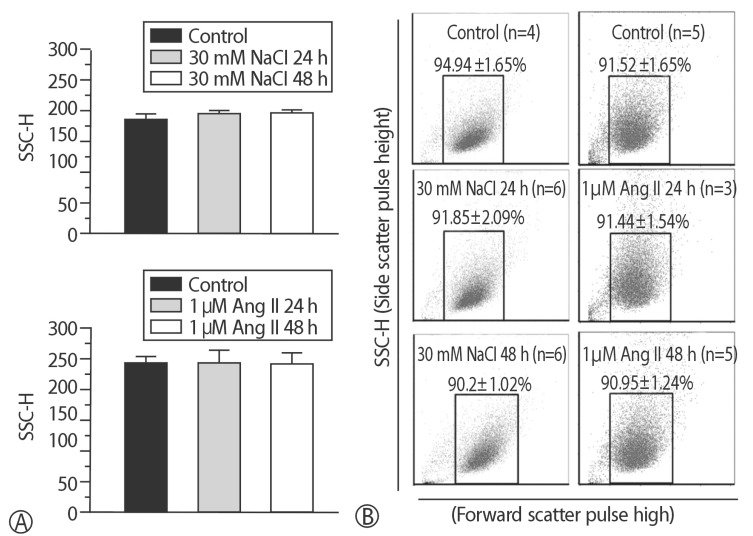
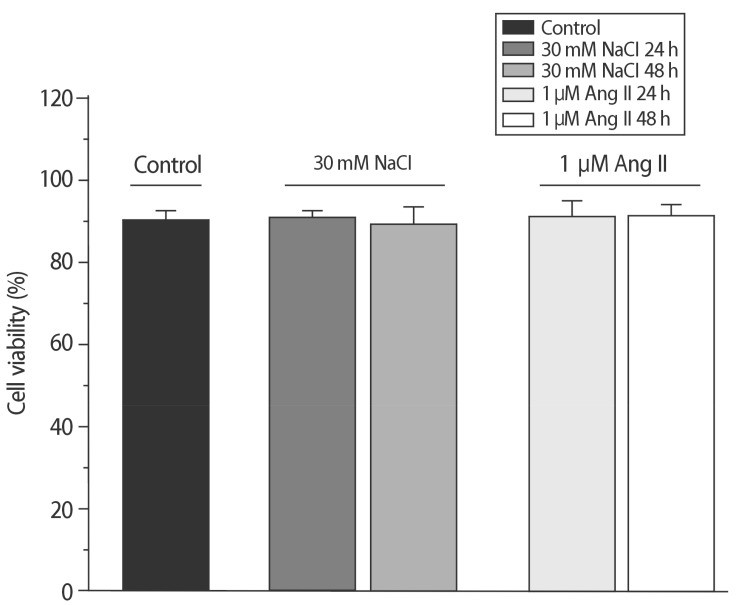
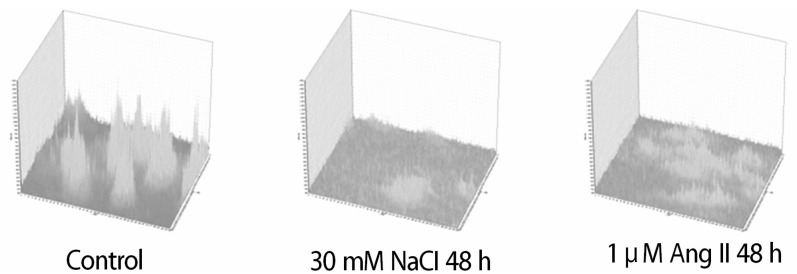
To compare the characteristics of the in vitro hypernatremic model, an Ang II-induced hypertrophic model (Ang II model) was used, because treatment with Ang II induces cellular hypertrophy in H9C2 cells, which mimics the hypertrophic responses of primary cardiomyocytes3). First, the FSC-H values significantly increased following supplementation with 30 mM NaCl (p<0.05) and 1 µM Ang II for 48 h (p<0.01) (Figs. 1 and 2), indicating an increase in the size of the cells. The mean of the FSC-H was 391.21±6.63 for the control group. The mean of the FSC-H for the 24 h group with 30mM NaCl did not change. However, the mean of the FSC-H for 48 h was 416.49±17.08. The mean FSC-H value was 356.77±9.26 for the control group. The mean of the FSC-H for the 24 h group with 1 µM Ang II did not exhibit a statistically significant change. However, the mean of the FSCH value for the cells maintained for 48 h was 375.09±7.61. There were several factors that could have affected the control samples. For this reason, different controls were used in each experiment to ensure an accurate comparison. The difference in values was more evident for the supplementation with NaCl. Second, SSC-H was constant among the controls after treatment for 24 h and 48 h with each hypertrophy-inducing agent (Fig. 3). Third, the nuclear and cell morphologies were similar among the controls and the 2 models under confocal microscopy with DAPI staining (Supplement 2). Our hypertrophic model, induced by the addition of NaCl, contained less granular content in the cytoplasm than other models. The results indicated that the addition of 30mM NaCl did not strongly affect the cells. Finally, the cell viability was examined (Fig. 4). For all of the groups, there were no changes in the cell viability. Therefore, this model did not exhibit abnormal morphological changes, and the cellular hypertrophy induced by these conditions was termed the in vitro hypernatremic model.

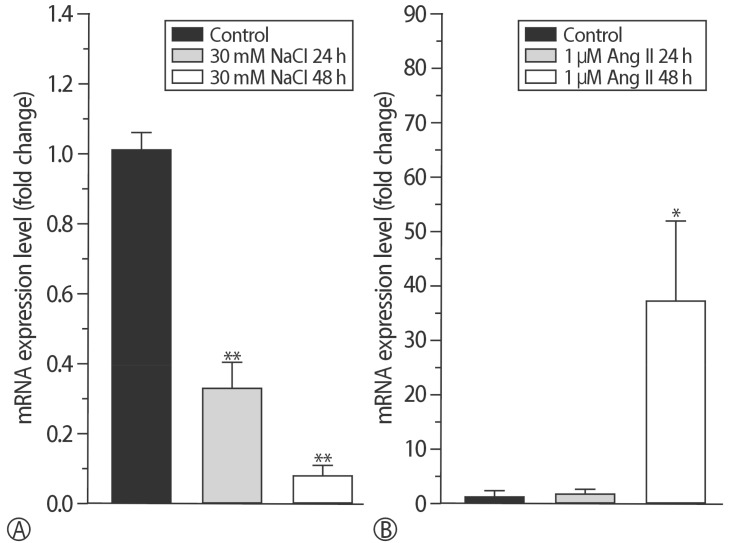
2. Different mRNA expression patterns of HSP22 between the 2 different cellular models

RT-PCR was conducted to compare the mRNA expression patterns after exposure to Ang II or NaCl for 24 or 48 h. HSP22 was compared with a house-keeping gene. The mRNA expression of HSP22 did not increase after treatment with Ang II for 24 h, but the expression of HSP22 increased after 48 h. In contrast to the Ang II model, the expression of HSP22 in the in vitro hypernatremic model gradually decreased in a time-dependent manner (Fig. 5). After these experiments, DNA gel electrophoresis was used to confirm the product of each primer set used for RT-PCR (Supplement 3). The results indicated that the design of the primers and PCR analysis were conducted appropriately.

3. Amino acid sequence homology between HSP22 and LEA3

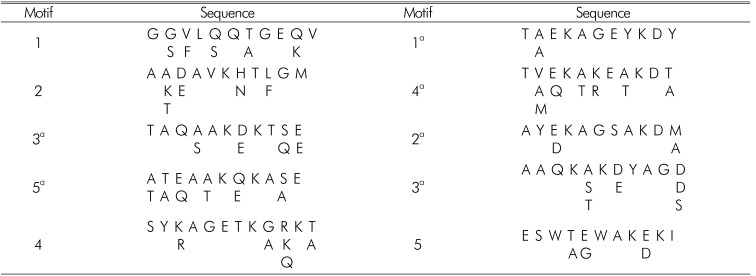
A gradual decreasing pattern, in response to high NaCl, has been shown for LEA3 in Artemia19). Based on the similarity of the decreasing patterns for LEA3 in Artemia and HSP22, a comparison of the amino acid sequences was conducted. LEA3 proteins have several types of conserved domains (Table 3)20). The sequences of these conserved domains were also compared. The consensus sequence of HSP22 was found at residues 108-128, which corresponds to residues 117-137 of LEA3 from Artemia. The identities were 33%(7/21); 57%(12/21) were positive, there were 0 gaps, and the expectation was 3.9. The similarity was meaningful, because part of the α-crystalline domain of HSP22 was similar to 3a motif sequence of LEA3. The similar expression patterns and amino acid sequences for HSP22 and LEA3 indicated that HSP22 might have an LEA-like function20).

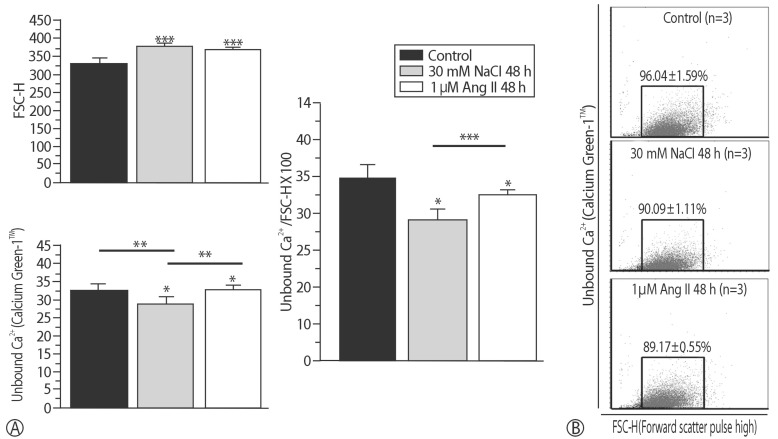
4. HSP22 affects the intracellular homeostasis of free Ca2+

To determine the roles of HSP22 in hypertrophy, the intracellular Ca2+ level was compared using a Ca2+-binding dye for the control; the FSC-H increased for the 2 hypertrophic models (p<0.001). Unbound Ca2+ increased in the Ang II model (p<0.05). However, compared with the Ang II model, Ca2+ significantly decreased in the in vitro hypernatremic model (p<0.01). To compensate for the size of the cells using the equation: unbound Ca2+/FSC-H×100, the corrected Ca2+ decreased in the Ang II model (p<0.05), and the decrease in Ca2+ was more evident with NaCl (p<0.001) (Fig. 6). The corrected result showed that size of the 2 hypernatremic models increased as the intracellular free Ca2+ decreased. Moreover, Ca2+ was confirmed in a single cell (Fig. 7). The results indicated that the role of HSP22 in cellular hypertrophy is related to impaired intracellular Ca2+ homeostasis.

Discussion

Hypertrophy in cardiomyocytes is a key factor in the pathogenesis of cardiac diseases, such as heart failure, arrhythmia, and sudden cardiac death21). Many previous studies have demonstrated the causes of hypertrophy, including changes in metabolism, RAS, and Ca2+-dependent transcription factors222324252627). However, the mechanism of cellular hypertrophy, induced by a chronic high-NaCl diet, has not been elucidated.
Recently, the re-induction of cardiac embryonic genes, through a process called the “immediate early gene program,” has been reported in several studies using cardiac disease models5282930). sHSPs are cardiac embryonic genes that play protective roles in the heart3132). LEA proteins are also known to be protectors and regulators of cellular development in various organisms620). In particular, the LEA3 proteins protect the cell during changes in osmolality8). Using the BLAST program, similar sequences that protect against osmotic damage were found in both HSP22 and LEA3 from Artemia. The α-crystalline domain is an important part of the sequence of HSP2233). The homology identified in the α-crystalline domain was term ed “LEA-like-HSP22.” All of these data imply that proteins that regulate development, such as sHSPs and LEA, play key roles in the process of hypertrophy under conditions of high osmolality. Specifically, LEA-like-HSP22 has diverse functions in the heart91011121334).
Having been incubated in normal osmotic PBS for 30 min, an increase in FSC-H was sufficient to indicate that hypertrophy had been induced in our in vitro hypernatremic model. The lack of abnormal changes in SSC-H, viability, and morphology across the in vitro hypernatremic model, control, and Ang II model shows that our model is not negatively affected by the addition of NaCl. In a previous study, an increase in SSC-H was observed in damaged cells35). Our hypernatremic conditions could more effectively increase the size of cells than the conditions obtained with Ang II, because the increase in FSC-H in our model was greater than that observed for the Ang II model. Although excitation-contraction coupling (E-C coupling) by action potentials is not found in H9C2 cells, previous studies have shown that the intracellular Ca2+ can be changed and that Ca2+ can be a mediator of cellular hypertrophy in H9C2 cells36373839404142). Therefore, the intracellular Ca2+ homeostasis is important in H9C2 cells.
With our model, our group anticipated that HSP22 would increase to protect the cells in the high-NaCl environment. Contrary to our expectations, HSP22 decreased in our model, and this trend was not observed with the Ang II model. This result suggests that HSP22 may participate in the protective process of cardiac hypertrophy with chronic hypernatremia and the protective process of intracellular Ca2+ homeostasis. This agrees with our finding that the Ca2+ in the hypertrophic H9C2 cells changed with the different HSP22 expression levels, because Ca2+ is used as a second messenger in the heart, and Ca2+ has important functions, including the regulation of metabolism, E-C coupling, and hypertrophic processes43444546). Our results indicate that HSP22 participates in the intracellular Ca2+ homeostasis, because in our model, the impaired, intracellular free Ca2+ homeostasis and an increased cell size were more evident with the decreased HSP22 expression than other for the groups.
In summary, the expression of HSP22 was significantly different in the 2 hypertrophic models, and it is important for the maintenance of the intracellular Ca2+ homeostasis in H9C2 cells. However, the present study had several limitations, including the properties of HSP22 in contractible cardiomyocytes and the direct relationship between cardiac hypertrophy, HSP22, and Ca2+ in the hypertrophic process. These limitations need to be explored.

Conclusion

We conclude that a high-NaCl condition induces cardiac cellular hypertrophy, due to impaired intracellular Ca2+ homeostasis. It is related to changes in the LEA-like HSP22 expression pattern. This observation can be used for the development of new therapies that can treat cardiac hypertrophy, induced by a chronic high-NaCl diet. However, the protection of the intracellular Ca2+ homeostasis with a regulated LEA-like HSP22 expression pattern must be confirmed in vivo and in patients.

Acknowledgements

This research did not receive any specific grants from funding agencies in the public, commercial, or not-forprofit sectors.

References

1. Lindpaintner K, Sen S. Role of sodium in hypertensive cardiac hypertrophy. Circ Res. 1985; 57:610–617. PMID: 2931209.
crossref
2. Shenasa M, Shenasa H. Hypertension, left ventricular hypertrophy, and sudden cardiac death. Int J Cardiol. 2017; 237:60–63. PMID: 28285801.
crossref
3. Watkins SJ, Borthwick GM, Arthur HM. The H9C2 cell line and primary neonatal cardiomyocyte cells show similar hypertrophic responses in vitro. In Vitro Cell Dev Biol Anim. 2011; 47:125–131. PMID: 21082279.
crossref
4. Zhou L, Ma B, Han X. The role of autophagy in angiotensin II-induced pathological cardiac hypertrophy. J Mol Endocrinol. 2016; 57:R143–R152. PMID: 27620875.
crossref
5. Rysä J, Aro J, Ruskoaho H. Early left ventricular gene expression profile in response to increase in blood pressure. Blood Press. 2006; 15:375–383. PMID: 17472029.
crossref
6. Hand SC, Menze MA, Toner M, Boswell L, Moore D. LEA proteins during water stress: not just for plants anymore. Annu Rev Physiol. 2011; 73:115–134. PMID: 21034219.
crossref
7. Motshwene P, Karreman R, Kgari G, Brandt W, Lindsey G. LEA (late embryonic abundant)-like protein Hsp 12 (heat-shock protein 12) is present in the cell wall and enhances the barotolerance of the yeast Saccharomyces cerevisiae. Biochem J. 2004; 377:769–774. PMID: 14570591.
crossref
8. Wu G, Zhang H, Sun J, Liu F, Ge X, Chen WH, et al. Diverse LEA(late embryogenesis abundant) and LEA-like genes and their responses to hypersaline stress in post-diapause embryonic development of Artemia franciscana. Comp Biochem Physiol B Biochem Mol Biol. 2011; 160:32–39. PMID: 21620991.
9. Depre C. H11 kinase is a novel mediator of myocardial hypertrophy in vivo. Circulation Research. 2002; 91:1007–1014. PMID: 12456486.
crossref
10. Hase M, Depre C, Vatner SF, Sadoshima J. H11 has dose-dependent and dual hypertrophic and proapoptotic functions in cardiac myocytes. Biochem J. 2005; 388:475–483. PMID: 15656793.
crossref
11. Ke L, Meijering RA, Hoogstra-Berends F, Mackovicova K, Vos MJ, Van Gelder IC, et al. HSPB1, HSPB6, HSPB7 and HSPB8 protect against RhoA GTPase-induced remodeling in tachypaced atrial myocytes. PLoS One. 2011; 6:e20395. PMID: 21731611.
crossref
12. Qiu H, Lizano P, Laure L, Sui X, Rashed E, Park JY, et al. H11 kinase/heat shock protein 22 deletion impairs both nuclear and mitochondrial functions of STAT3 and accelerates the transition into heart failure on cardiac overload. Circulation. 2011; 124:406–415. PMID: 21747053.
crossref
13. Sui X, Li D, Qiu H, Gaussin V, Depre C. Activation of the bone morphogenetic protein receptor by H11kinase/Hsp22 promotes cardiac cell growth and survival. Circ Res. 2009; 104:887–895. PMID: 19246680.
crossref
14. Depre C, Wang L, Sui X, Qiu H, Hong C, Hedhli N, et al. H11 kinase prevents myocardial infarction by preemptive preconditioning of the heart. Circ Res. 2006; 98:280–288. PMID: 16373598.
crossref
15. Altschul SF, Madden TL, Schaffer AA, Zhang J, Zhang Z, Miller W, et al. Gapped BLAST and PSI- BLAST: a new generation of protein database search programs. Nucleic Acids Res. 1997; 25:3389–3402. PMID: 9254694.
16. Altschul SF, Wootton JC, Gertz EM, Agarwala R, Morgulis A, Schaffer AA, et al. Protein database searches using compositionally adjusted substitution matrices. FEBS J. 2005; 272:5101–5109. PMID: 16218944.
crossref
17. Strober W. Trypan Blue Exclusion Test of Cell Viability. Curr Protoc Immunol. 2015; 111:B1–B3.
crossref
18. Livak KJ, Schmittgen TD. Analysis of relative gene expression data using real-time quantitative PCR and the 2 (-Delta Delta C (T)) Method. Methods. 2001; 25:402–408. PMID: 11846609.
19. Zhao W, Yao F, Zhang M, Jing T, Zhang S, Hou L, et al. The Potential Roles of the G1LEA and G3LEA Proteins in Early Embryo Development and in Response to Low Temperature and High Salinity in Artemia sinica. PLoS One. 2016; 11:e0162272. PMID: 27603306.
crossref
20. Battaglia M, Olvera-Carrillo Y, Garciarrubio A, Campos F, Covarrubias AA. The enigmatic LEA proteins and other hydrophilins. Plant Physiol. 2008; 148:6–24. PMID: 18772351.
crossref
21. Lazzeroni D, Rimoldi O, Camici PG. From Left Ventricular Hypertrophy to Dysfunction and Failure. Circ J. 2016; 80:555–564. PMID: 26853555.
crossref
22. Gomez AM, Ruiz-Hurtado G, Benitah JP, Dominguez-Rodriguez A. Ca(2+) fluxes involvement in gene expression during cardiac hypertrophy. Curr Vasc Pharmacol. 2013; 11:497–506. PMID: 23905644.
crossref
23. Liao HH, Jia XH, Liu HJ, Zheng Y, Qizhu T. The role of PPARs in pathological cardiac hypertrophy and heart failure. Curr Pharm Des. 2016; 23:1677–1686.
crossref
24. Raizada V, Hillerson D, Amaram JS, Skipper B. Angiotensin II-mediated left ventricular abnormalities in chronic kidney disease. J Investig Med. 2012; 60:785–791.
crossref
25. Ritchie RH, Delbridge LM. Cardiac hypertrophy, substrate utilization and metabolic remodelling: cause or effect? Clin Exp Pharmacol Physiol. 2006; 33:159–166. PMID: 16445716.
crossref
26. Tuomainen T, Tavi P. The role of cardiac energy metabolism in cardiac hypertrophy and failure. Exp Cell Res. 2017; 360:12–18. PMID: 28344054.
crossref
27. Zhang YB, Meng YH, Chang S, Zhang RY, Shi C. High fructose causes cardiac hypertrophy via mitochondrial signaling pathway. Am J Transl Res. 2016; 8:4869–4880. PMID: 27904687.
28. Laskowska E, Matuszewska E, Kuczynska-Wisnik D. Small heat shock proteins and protein-misfolding diseases. Curr Pharm Biotechnol. 2010; 11:146–157. PMID: 20166966.
crossref
29. Meghji P, Nazir SA, Dick DJ, Bailey ME, Johnson KJ, Lab MJ. Regional workload induced changes in electrophysiology and immediate early gene expression in intact in situ porcine heart. J Mol Cell Cardiol. 1997; 29:3147–3155. PMID: 9405188.
30. Yang Q, Hanesworth JM, Harding JW, Slinker BK. The AT4 receptor agonist [Nle1]-angiotensin IV reduces mechanically induced immediate-early gene expression in the isolated rabbit heart. Regul Pept. 1997; 71:175–183. PMID: 9350976.
crossref
31. Latchman DS. Heat shock proteins and cardiac protection. Cardiovasc Res. 2001; 51:637–646. PMID: 11530097.
crossref
32. Yan Z, Wei H, Ren C, Yuan S, Fu H, Lv Y, et al. Gene expression of Hsps in normal and abnormal embryonic development of mouse hindlimbs. Hum Exp Toxicol. 2015; 34:563–574. PMID: 25352652.
crossref
33. Chowdary TK, Raman B, Ramakrishna T, Rao CM. Mammalian Hsp22 is a heat-inducible small heat-shock protein with chaperone-like activity. Biochem J. 2004; 381:379–387. PMID: 15030316.
crossref
34. Rashed E, Lizano P, Dai H, Thomas A, Suzuki CK, Depre C, et al. Heat shock protein 22 (Hsp22) regulates oxidative phosphorylation upon its mitochondrial translocation with the inducible nitric oxide synthase in mammalian heart. PLoS One. 2015; 10:e0119537. PMID: 25746286.
crossref
35. Bortner CD, Cidlowski JA. Cell shrinkage and monovalent cation fluxes: role in apoptosis. Arch Biochem Biophys. 2007; 462:176–188. PMID: 17321483.
crossref
36. Aggeli IK, Beis I, Gaitanaki C. Oxidative stress and calpain inhibition induce alpha B-crystallin phosphorylation via p38-MAPK and calcium signalling pathways in H9c2 cells. Cell Signal. 2008; 20:1292–1302. PMID: 18420382.
crossref
37. Avanzato D, Merlino A, Porrera S, Wang R, Munaron L, Mancardi D. Role of calcium channels in the protective effect of hydrogen sulfide in rat cardiomyoblasts. Cell Physiol Biochem. 2014; 33:1205–1214. PMID: 24752219.
crossref
38. Brostrom MA, Reilly BA, Wilson FJ, Brostrom CO. Vasopressin-induced hypertrophy in H9c2 heart-derived myocytes. Int J Biochem Cell Biol. 2000; 32:993–1006. PMID: 11084379.
crossref
39. Golfman LS, Haughey NJ, Wong JT, Jiang JY, Lee D, Geiger JD, et al. Lysophosphatidylcholine induces arachidonic acid release and calcium overload in cardiac myoblastic H9c2 cells. J Lipid Res. 1999; 40:1818–1826. PMID: 10508201.
crossref
40. Han XZ, Gao S, Cheng YN, Sun YZ, Liu W, Tang L L, et al. Protective effect of naringenin-7-O-glucoside against oxidative stress induced by doxorubicin in H9c2 cardiomyocytes. Biosci Trends. 2012; 6:19–25. PMID: 22426099.
crossref
41. Jin HJ, Li CG. Tanshinone IIA and Cryptotanshinone Prevent Mitochondrial Dysfunction in Hypoxia-Induced H9c2 Cells: Association to Mitochondrial ROS, Intracellular Nitric Oxide, and Calcium Levels. Evid Based Complement Alternat Med. 2013; 610694. PMID: 23533503.
crossref
42. Johns DG, Ao Z, Naselsky D, Herold CL, Maniscalco K, Sarov-Blat L, et al. Urotensin-II-mediated cardiomyocyte hypertrophy: effect of receptor antagonism and role of inflammatory mediators. Naunyn Schmiedebergs Arch Pharmacol. 2004; 370:238–250. PMID: 15549273.
crossref
43. Dobrev D, Wehrens XH. Calcium-mediated cellular triggered activity in atrial fibrillation. J Physiol. 2017; 595:4001–4008. PMID: 28181690.
crossref
44. Park DR, Park KH, Kim BJ, Yoon CS, Kim UH. Exercise ameliorates insulin resistance via Ca2+ signals distinct from those of insulin for GLUT4 translocation in skeletal muscles. Diabetes. 2015; 64:1224–1234. PMID: 25409702.
crossref
45. Zhao ZH, Jin CL, Jang JH, Wu YN, Kim SJ, Jin HH, et al. Assessment of Myofilament Ca2+ Sensitivity Underlying Cardiac Excitation-contraction Coupling. J Vis Exp. 2016; 114:e54057.
46. Zhao ZH, Youm JB, Wang Y, Lee JH, Sung JH, Kim JC, et al. Cardiac inotropy, lusitropy, and Ca2+ handling with major metabolic substrates in rat heart. Pflugers Arch. 2016; 468:1995–2006. PMID: 27796576.
crossref
Fig. 1

Size of the in vitro hypernatremic model. (A) Cell size was increased by supplementation with 30 mM NaCl for 48 h (*p<0.05). (B) A right shift in the 30 mM NaCl for 48 h group was found.

ebp-16-1-g001
Fig. 2

Ang II model was confirmed. (A) Hypertrophy was induced by supplementation of 1 µM Ang II for 48 h (**p<0.01). (B) Right shift in the Ang II model was found.

ebp-16-1-g002
Fig. 3

Abnormal granule was confirmed in two different hypertrophic models. (A) No changes, (B) No shifts in SSC-H were found in two models and each control group.

ebp-16-1-g003
Fig. 4

Cytotoxic effects of NaCl and Ang II were compared. Cell viabilities were not statistically different from the value of the control.

ebp-16-1-g004
Fig. 5

mRNA expression of HSP22 and NPPa in two hypertrophic models. (A) In the NaCl group, mRNA expression of HSP22 was significantly decreased in a time-dependent manner. (B) HSP22 in the 1 µM Ang II for 48 h group (*p<0.05, **p<0.01, ***p<0.001).

ebp-16-1-g005
Fig. 6

Average intracellular free Ca2+ concentration in two hypertrophic models. (A) FSC-H increased in the Ang II model and further increased in the in vitro hypernatremic model, and fluorescent intensity increased in the Ang II model and decreased in the in vitro hypernatremic model. To sum up, the level of free Ca2+ in the region on the cell decreased in the Ang II model and further decreased in the in vitro hypernatremic model when fluorescent intensity was corrected to compensate the difference of cell size. (B) The two hypertrophic models shifted to the right and down. In in vitro hypernatremic model, it was more evident (*p<0.05, **p<0.01, ***p<0.001).

ebp-16-1-g006
Fig. 7

Analysis of the single cell to show the intracellular free Ca2+ level. Ca2+ concentration decreased in the Ang II model and decreased further in the in vitro hypernatremic model.

ebp-16-1-g007
Supplement Data 1

The size of cells changed. Cell sizes were measured and compared with the FSC-H values.

ebp-16-1-g008
Supplement Data 2

Morphology of cells. Abnormal cell and nuclear morphologies were not observed among the Control and two hypertrophic models.

ebp-16-1-g009
Supplement Data 3

To validate the primers, amplified cDNA of the Control group was confirmed by DNA gel electrophoresis. The product sizes were 129bp (HSP22), and 135bp (16s rRNA). Lane.1 is Marker, Lane.2, 3, 4 are 18s rRNA, and Lane. 5, 6, 7 are HSP22.

ebp-16-1-g010
Table 1

Conditions for the induction of cellular hypertrophy

ebp-16-1-i001

In a pilot study, FSC-H values changed in high NaCl conditions. The increase in the size of cells was the highest in the 48 h and 30mM NaCl group.

Table 2

Primer sequences

ebp-16-1-i002
Table 3

Consensus amino acid sequences of the different motifs in LEA3

ebp-16-1-i003
TOOLS
Similar articles