

 PDF
PDF ePub
ePub Citation
 Print
Print


INTRODUCTION
With development of ultra-high field magnets and faster gradient and acquisition hardware, multi-nucleus magnetic resonance imaging (MRI) method has received growing interest. In addition, sodium imaging is enabled by the presence of a cellular sodium-potassium pump that modulates intracellular sodium concentration. Intracellular and extracellular sodium concentrations have been estimated to be 10 and 140 mM, respectively (1). Cells in normal tissue usually maintain a large sodium concentration gradient between intracellular and extracellular compartments across the cell membrane. A distorted energy metabolism or disrupted cell membrane integrity will increase the intracellular sodium concentration. Accumulating evidence has shown that intra- and extra-cellular sodium concentrations are altered in various diseases. Hence, measurement of sodium concentrations in tissues can yield information on tissue status and disease diagnosis (2).
Sodium (23Na) imaging can be used to acquire and measure tissue sodium concentrations non-invasively. The potential diagnostic feasibility of sodium MRI has been tested for common pathological conditions (such as tumor, stroke, and Alzheimer's disease) and functional renal imaging. Body fluid and electrolyte homeostasis are regulated by filtering the plasma and excreting end-products through the kidney which is primarily achieved by modulating renal extracellular sodium level (3). In stroke studies, it is important to monitor the acute phase (a couple of hours after the stroke) because patients usually require urgent therapeutic intervention several hours after the stroke onset (4). In these cases, tissue sodium concentration measurement with a high temporal resolution would be vital. In animal brain studies, the surface coil is generally placed sufficiently adjacent to the brain to determine the optimum signal-to-noise ratio (SNR). Although this type of coil can be used to transmit the B1 field and detect the signal, the use of such transceiver coils is not ideal due to the highly inhomogeneous nature of the B1 field which makes it very difficult to accurately measure tissue sodium concentration (5).
Sodium MRI has been used to examine organs (including the brain and kidney) in various animal neurological/metabolic disease models. For sodium imaging, a high magnetic field is generally employed for RF coils, although non-magnetic materials are also needed to develop the coil. However, sodium MRI has certain limitations. In particular, the concentration and sensitivity of sodium in tissue are markedly lower than those of protons (i.e., 0.05% of proton concentration and 9.3% of proton sensitivity). Moreover, the gyromagnetic ratio (γ) of sodium is 11.262 MHz/T, which is substantially lower than that of protons (42.576 MHz/T). At 9.4T, the Larmor frequency of sodium is 105.8 MHz (6). Thus, the very short T2 signal decay of sodium may have negative effect on the spatial resolution of the image which may necessitate very short RF pulses to minimize echo time (TE) (7). Therefore, optimization of acquisition parameters and maximization of coil sensitivity are essential for dual-tuned coil development.
In the present study, we aimed to develop a proton-sodium MR imaging system by creating a sodium RF coil and optimizing sodium imaging parameters for a small animal at 9.4T.
MATERIALS AND METHODS
Animals
Adult healthy male mice (7–14 weeks old; n = 5) were used in the present study. For each scan, animals were anesthetized via inhalation of 1.5–2.5% isoflurane and a 1:2 mixture of O2:NO2 (250 mL/min) through an anesthesia unit.
MRI Scan Acquisition
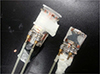
Proton-sodium RF coils (105.8 and 400 MHz at 9.4T) were developed for this study. Basic RF circuit components were attached to each loop. Proton signal was acquired using a commercial RF volume coil (diameter, 60 mm) whereas sodium signal was detected using a custom-made RF volume coil. Figure 1 illustrates the sodium volume coil (saddle-shaped, 30 mm in diameter/length) which had a simple design involving a single loop. Tuning and matching capacitors were attached to the loop for resonance frequency tuning and impedance matching.
Data acquisition for in vivo MRI was conducted using a 9.4T/160-mm animal MR system (Agilent Technologies, Santa Clara, CA, USA) with a 400 mT/m gradient. Renal sodium levels were quantified in normal mice based on the following parameters: gradient echo sequence, repetition time (TR)/TE, 100/2.3 ms; field of view, 35 × 40 mm; flip angle, 90; average, 256; matrix size, 128 × 128 (spatial resolution, 0.27 mm); slice thickness, 5 mm; spectral width, 50 kHz; and total scan time, 25 minutes 30 seconds.
Image Analysis
Sodium images were analyzed by using SNR measured in each region of interest (ROI) in kidneys and phantoms:

SNR at a ROI (SNRROI) was calculated by dividing signal intensity at a ROI (SROI) by signal standard deviation in the background (δBG).
To quantify sodium concentrations in kidneys of normal mice, a relative reference method was used. Accordingly, sodium reference phantoms were used to determine sodium concentration in normal mouse kidney (8):
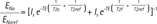
Where FNa and FNaref were T1 saturation factors while ENa and ENaref were T2 correction factors for tissue and phantom reference, respectively. Particularly, if FNa / FNaref was 1 on fully T1 relaxed MR images (TR > 2T1), T2 correction factors could be estimated from
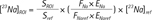
The concentration of sodium in the ROI ([23Na]ROI) could be calculated using reference phantom sodium levels ([23Na] ref) and signal intensities in the ROI (SROI) as well as the reference phantom signal intensities (Sref).
Performance of the RF coil could be evaluated by measuring quality factor (Q-factor) which indicates the center frequency of the resonance divided by the width of the resonance at −3 dB points. A higher Q value is positively correlated with a narrower resonance peak. The Q-factor can also be estimated as Q = ωL/R, where ω is the resonance frequency, L is the inductance of the circuit, and R is the resistance (9). A coil circuit is usually designed to increase the Q-factor when the coil is unloaded. It can then markedly decrease the Q-factor when the coil is loaded through its placement adjacent to the subject. Change in the Q-factor is characterized by Q ratio (Qul/Ql), the ratio of unloaded Q (Qul) to loaded Q (Ql). Voltage SNR reduction attributable to losses (SNRv) in the coil can be estimated by using these ratios relative to theoretical loss of signal. The relationship between SNR and Q factor can be described as follows: SNRv.ul/SNRv.l = (1−Ql/Qul)1/2 (10). Thus, Q values of the coil were measured via bench-based measurement to evaluate the efficiency of the coil.
RESULTS
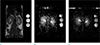
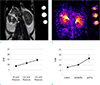
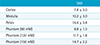
Proton T2-weighted kidney images of normal mice acquired using mouse volume coil are shown in Figure 2a. Figure 2b and 2c are sodium distribution images in field of view of 40 × 40 mm. Resolution matrices used were 32 × 32 for Figure 2a and 64 × 64 for Figure 2b. Figure 3a and 3b illustrate a representative T2-weighted image of normal mice (on the left) and a color map of sodium distribution image (on the right). SNR values of three phantoms (90, 120, and 150 mM) were measured (Fig. 3c) and the gradient of sodium SNR in kidney was plotted (Fig. 3d). White circles in these images indicate cortex (C), medulla (M), and pelvis (P). SNRs in both phantoms and kidneys of mice (particularly in the renal cortex, medulla, and pelvis) are shown in Table 1. The measured unloaded Q value was 352.8. Loaded Q value was 211.18. The ratio of the unloaded/loaded Q value was 1.67.
DISCUSSION
Recently published articles have reported that sodium MRI can be used to noninvasively acquire physiological information from the brain and kidney. Through development of high field magnets and improved sodium coils in recent years, sodium imaging has overcome the limitation of low sodium sensitivity and concentration in tissues. Additionally, T1/T2 relaxation times of various organs and phantoms have been measured at each tesla. Typically reported T1/T2 values of sodium in aqueous solution are 57/54 (ms) at 7.0T. Buist et al. (11) have reported that fast T2 relaxation (T2f), slow T2 relaxation (T2s), and T2 relaxation (T1) times at 4.7T are 2.2, 20.4, and 34 ms, respectively. In fact, sodium concentration in the kidney is regulated and maintained at organ level. The concentration of extracellular sodium increases from the cortex along the corticomedullary axis toward the inner medulla (6). Our work also showed that sodium signal intensity was increased from cortex to medulla to pelvis (Fig. 3d). Our results confirmed that our simply designed RF coils with a combination of a 1H-tuned coil and a 23Na-tuned coil had sufficient performance at 9.4T. This design can also be used to independently tune and match each loop to ensure optimal sensitivity. Finally, our preliminary results provide a foundation for an improvement in the quality of in vivo sodium MR imaging through the development of advanced RF coils.
The advantage of microstrip transmission line includes its simple design without the need for lumped elements (12). Although non-shielded RF coils were designed and developed in this study, traditional RF surface coils could be used to modify microstrip transmission line type in order to improve their performance. Primarily, a more compact coil design would enable its placement inside high field magnets (13).
Given the availability of MRI scanners with ultra-high fields, the coil design explained herein could be easily adapted for another high field MRI system. In fact, this design technique can also be used to construct coils for imaging of other nuclei such as 13C and 31P through adjusting variable capacitors. Because the resonance frequency of sodium is similar to that of carbon (sodium, 105.8 MHz; carbon, 100.6 MHz), 13C signal can also be detected by using a modulating trimmer (1415).
This work is the first step to obtain in vivo sodium images at 9.4T. Thus, we adopted a basic setting, namely, a simple-circuit RF coil and traditional 2D gradient echo sequence. Advanced sequences such as ultra-short echo time (UTE), zero echo time (ZTE), and steady-state free precession (SSFP) have recently been used to reduce scan time and improve sodium MR image quality (1617). These advanced MR techniques will allow sodium MR imaging of other organs that require fast and high-resolution imaging such as heart and joints.
In conclusion, we acquired sodium images of mouse kidney with significantly greater spatial resolution by using 1H/23Na dual-tuned coils. However, further work such as modification of our RF coils is needed to improve their performance and apply advanced pulse sequences for fast imaging and high SNR. Although we applied sodium MR imaging with traditional RF coil and sequences, modified RF coils and advanced MR protocols might better facilitate animal and clinical studies of alterations in sodium concentration in various diseases (e.g., diabetic renal disease, kidney transplant, renal fibrosis, and kidney cancer).
 XML Download