Abstract
The objective of this study was to evaluate the chemical exchange saturation transfer (CEST) effect of amino acids and neurotransmitters, which exist in the human brain, depending on the concentration, pH, and amplitude of the saturation radiofrequency field. Phantoms were developed with asparagine (Asn), γ-aminobutyric acid (GABA), glutamate (Glu), glycine (Gly), and myoinositol (MI). Each chemical had three different concentrations of 10, 30, and 50 mM and three different pH values of 5.6, 6.2, and 7.4. Full Z-spectrum CEST images for each phantom were acquired with a continuous-wave radiofrequency (RF) saturation pulse with two different B1 amplitudes of 2 μT and 4 μT using an animal 9.4T MRI system. A voxel-based CEST asymmetry was mapped to evaluate exchangeable protons based on amide (−NH), amine (−NH2), and hydroxyl (−OH) groups for the five target molecules. For all target molecules, the CEST effect was increased with increasing concentration and B1 amplitude; however, the CEST effect with varying pH displayed a different trend depending on the characteristics of the molecule. On CEST asymmetric maps, Glu and MI were well visualized around 3.0 and 0.9 ppm, respectively, and were well separated macroscopically at a pH of 7.4. The exchange rates of Asn, Glu, BABA, and Gly usually decreased with increasing pH. The CEST effect was dependent on the concentration, acidity of the target molecules, and B1 amplitude of the saturation RF pulse. The CEST effect for Asn can be observed in a 9.4T MRI system. The results of this study are based on applying the CEST technique in patients with neurodegenerative diseases when proteins in the brain are increased with disease progression.
Go to : 
References
1. Guivel-Scharen V, Sinnwell T, Wolff SD, Balaban RS. Detection of proton chemical exchange between metabolites and water in biological tissues. J Magn Reson. 1998; 133:36–45.

2. Dagher AP, Aletras A, Choyke P, Balaban RS. Imaging of urea using chemical exchange-dependent saturation transfer at 1.5T. J Magn Reson Imaging. 2000; 12:745–748.

3. Cai K, Haris M, Singh A, et al. Magnetic resonance imaging of glutamate. Nat Med. 2012; 18:302–306.

4. Ahmed M, Davis J, Aucoin D, et al. Structural conversion of neurotoxic amyloid-beta(1–42) oligomers to fibrils. Nat Struct Mol Biol. 2010; 17:561–567.
5. Rauscher S, Baud S, Miao M, Keeley FW, Pomes R. Proline and glycine control protein self-organization into elastomeric or amyloid fibrils. Structure. 2006; 14:1667–1676.

6. Harmeier A, Wozny C, Rost BR, et al. Role of amyloid-beta glycine 33 in oligomerization, toxicity, and neuronal plasticity. J Neurosci. 2009; 29:7582–7590.
7. Kogan F, Hariharan H, Reddy R. Chemical Exchange Saturation Transfer (CEST) Imaging: Description of Technique and Potential Clinical Applications. Curr Radiol Rep. 2013; 1:102–114.

8. Haris M, Singh A, Cai K, et al. MICEST: a potential tool for non-invasive detection of molecular changes in Alzheimer's disease. J Neurosci Methods. 2013; 212:87–93.

9. Haris M, Cai K, Singh A, Hariharan H, Reddy R. In vivo mapping of brain myo-inositol. Neuroimage. 2011; 54:2079–2085.

10. Oh JH, Kim HG, Woo DC, Jeong HK, Lee SY, Jahng GH. Chemical-Exchange-Saturation-Transfer Magnetic Resonance Imaging to Map Gamma-Aminobutyric Acid, Glutamate, Myoinositol, Glycine, and Asparagine: Phantom Experiments. J Korean Phys Soc. 2017; 70:545–553.

11. McVicar N, Li AX, Meakin SO, Bartha R. Imaging chemical exchange saturation transfer (CEST) effects following tumor-selective acidification using lonidamine. NMR Biomed. 2015; 28:566–575.

12. McMahon MT, Gilad AA, Zhou J, Sun PZ, Bulte JW, van Zijl PC. Quantifying exchange rates in chemical exchange saturation transfer agents using the saturation time and saturation power dependencies of the magnetization transfer effect on the magnetic resonance imaging signal (QUEST and QUESP): Ph calibration for poly-L-lysine and a starburst dendrimer. Magn Reson Med. 2006; 55:836–847.

13. Jahng GH, Oh JH. Physical Modeling of Chemical Exchange Saturation Transfer Imaging. Progress in Medical Physics. 2017; 28:135–143.

14. Zaiss M, Bachert P. Chemical exchange saturation transfer (CEST) and MR Z-spectroscopy in vivo: a review of theoretical approaches and methods. Phys Med Biol. 2013; 58:R221–269.
15. McVicar N, Li AX, Goncalves DF, et al. Quantitative tissue pH measurement during cerebral ischemia using amine and amide concentration-independent detection (AACID) with MRI. J Cereb Blood Flow Metab. 2014; 34:690–698.

16. Zong X, Wang P, Kim SG, Jin T. Sensitivity and source of amine-proton exchange and amide-proton transfer magnetic resonance imaging in cerebral ischemia. Magn Reson Med. 2014; 71:118–132.

17. Ward KM, Balaban RS. Determination of pH using water protons and chemical exchange dependent saturation transfer (CEST). Magn Reson Med. 2000; 44:799–802.

18. van Zijl PC, Yadav NN. Chemical exchange saturation transfer (CEST): what is in a name and what isn't? Magn Reson Med. 2011; 65:927–948.

19. Schmitt B, Zaiss M, Zhou J, Bachert P. Optimization of pulse train presaturation for CEST imaging in clinical scanners. Magn Reson Med. 2011; 65:1620–1629.

Go to : 
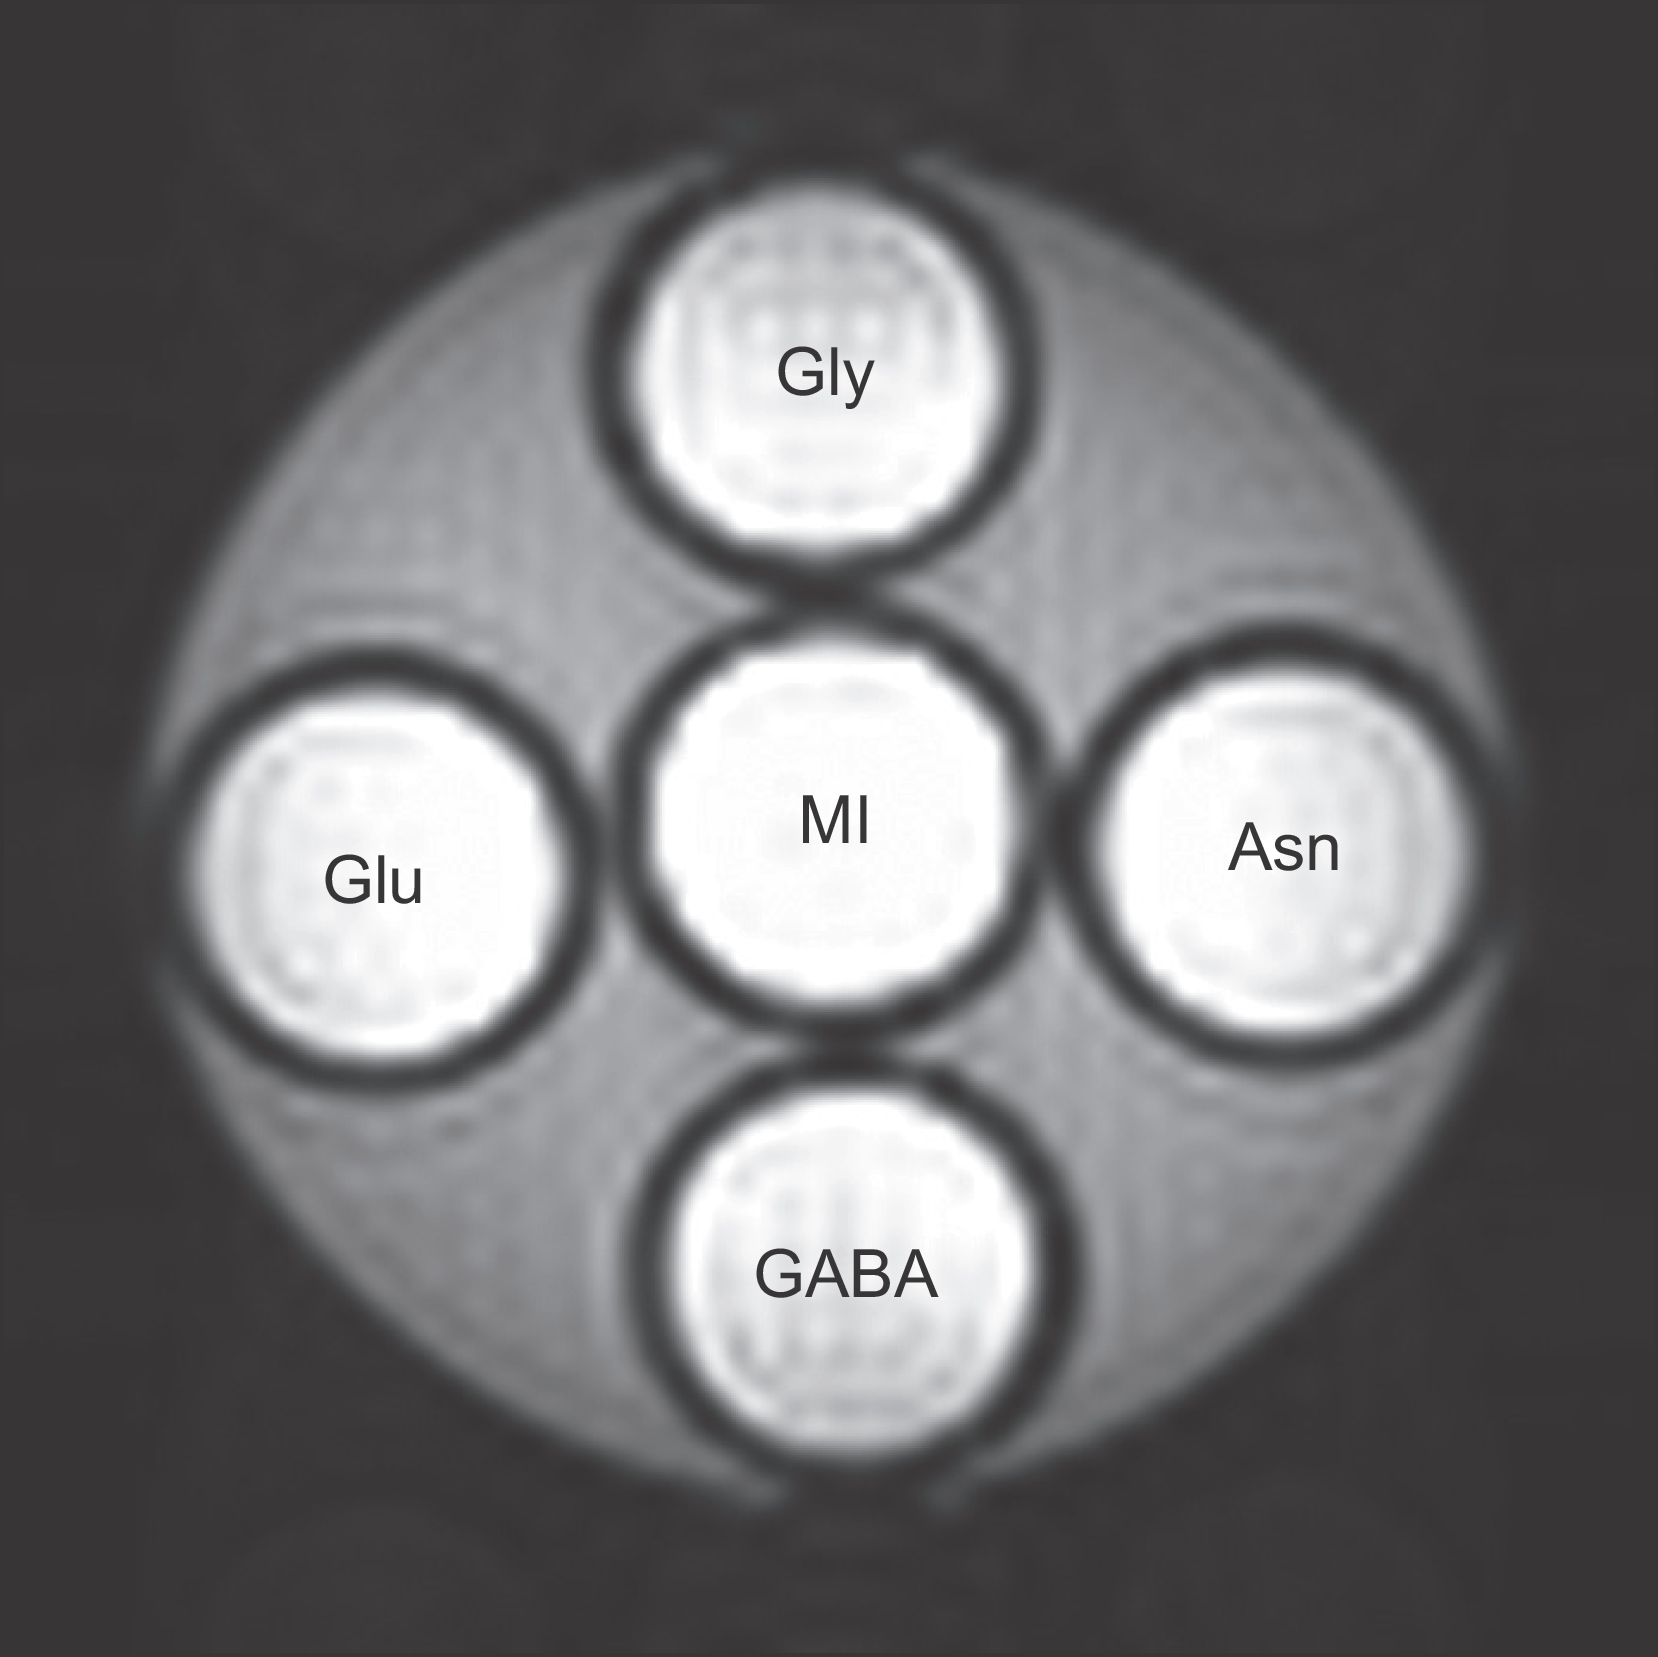 | Fig. 1.Original phantom images at a concentration of 50 mM and pH 5.6 obtained by using an animal 9.4T MRI system. The target molecules were located in five small tubes for glycine (Gly), glutamate (Glu), myoinositol (MI), asparagine (Asn), and gamma-aminobutyric acid (GABA), respectively. These tubes were placed in a large container and fixed by filling with 2% agarose solution that had been boiled. |
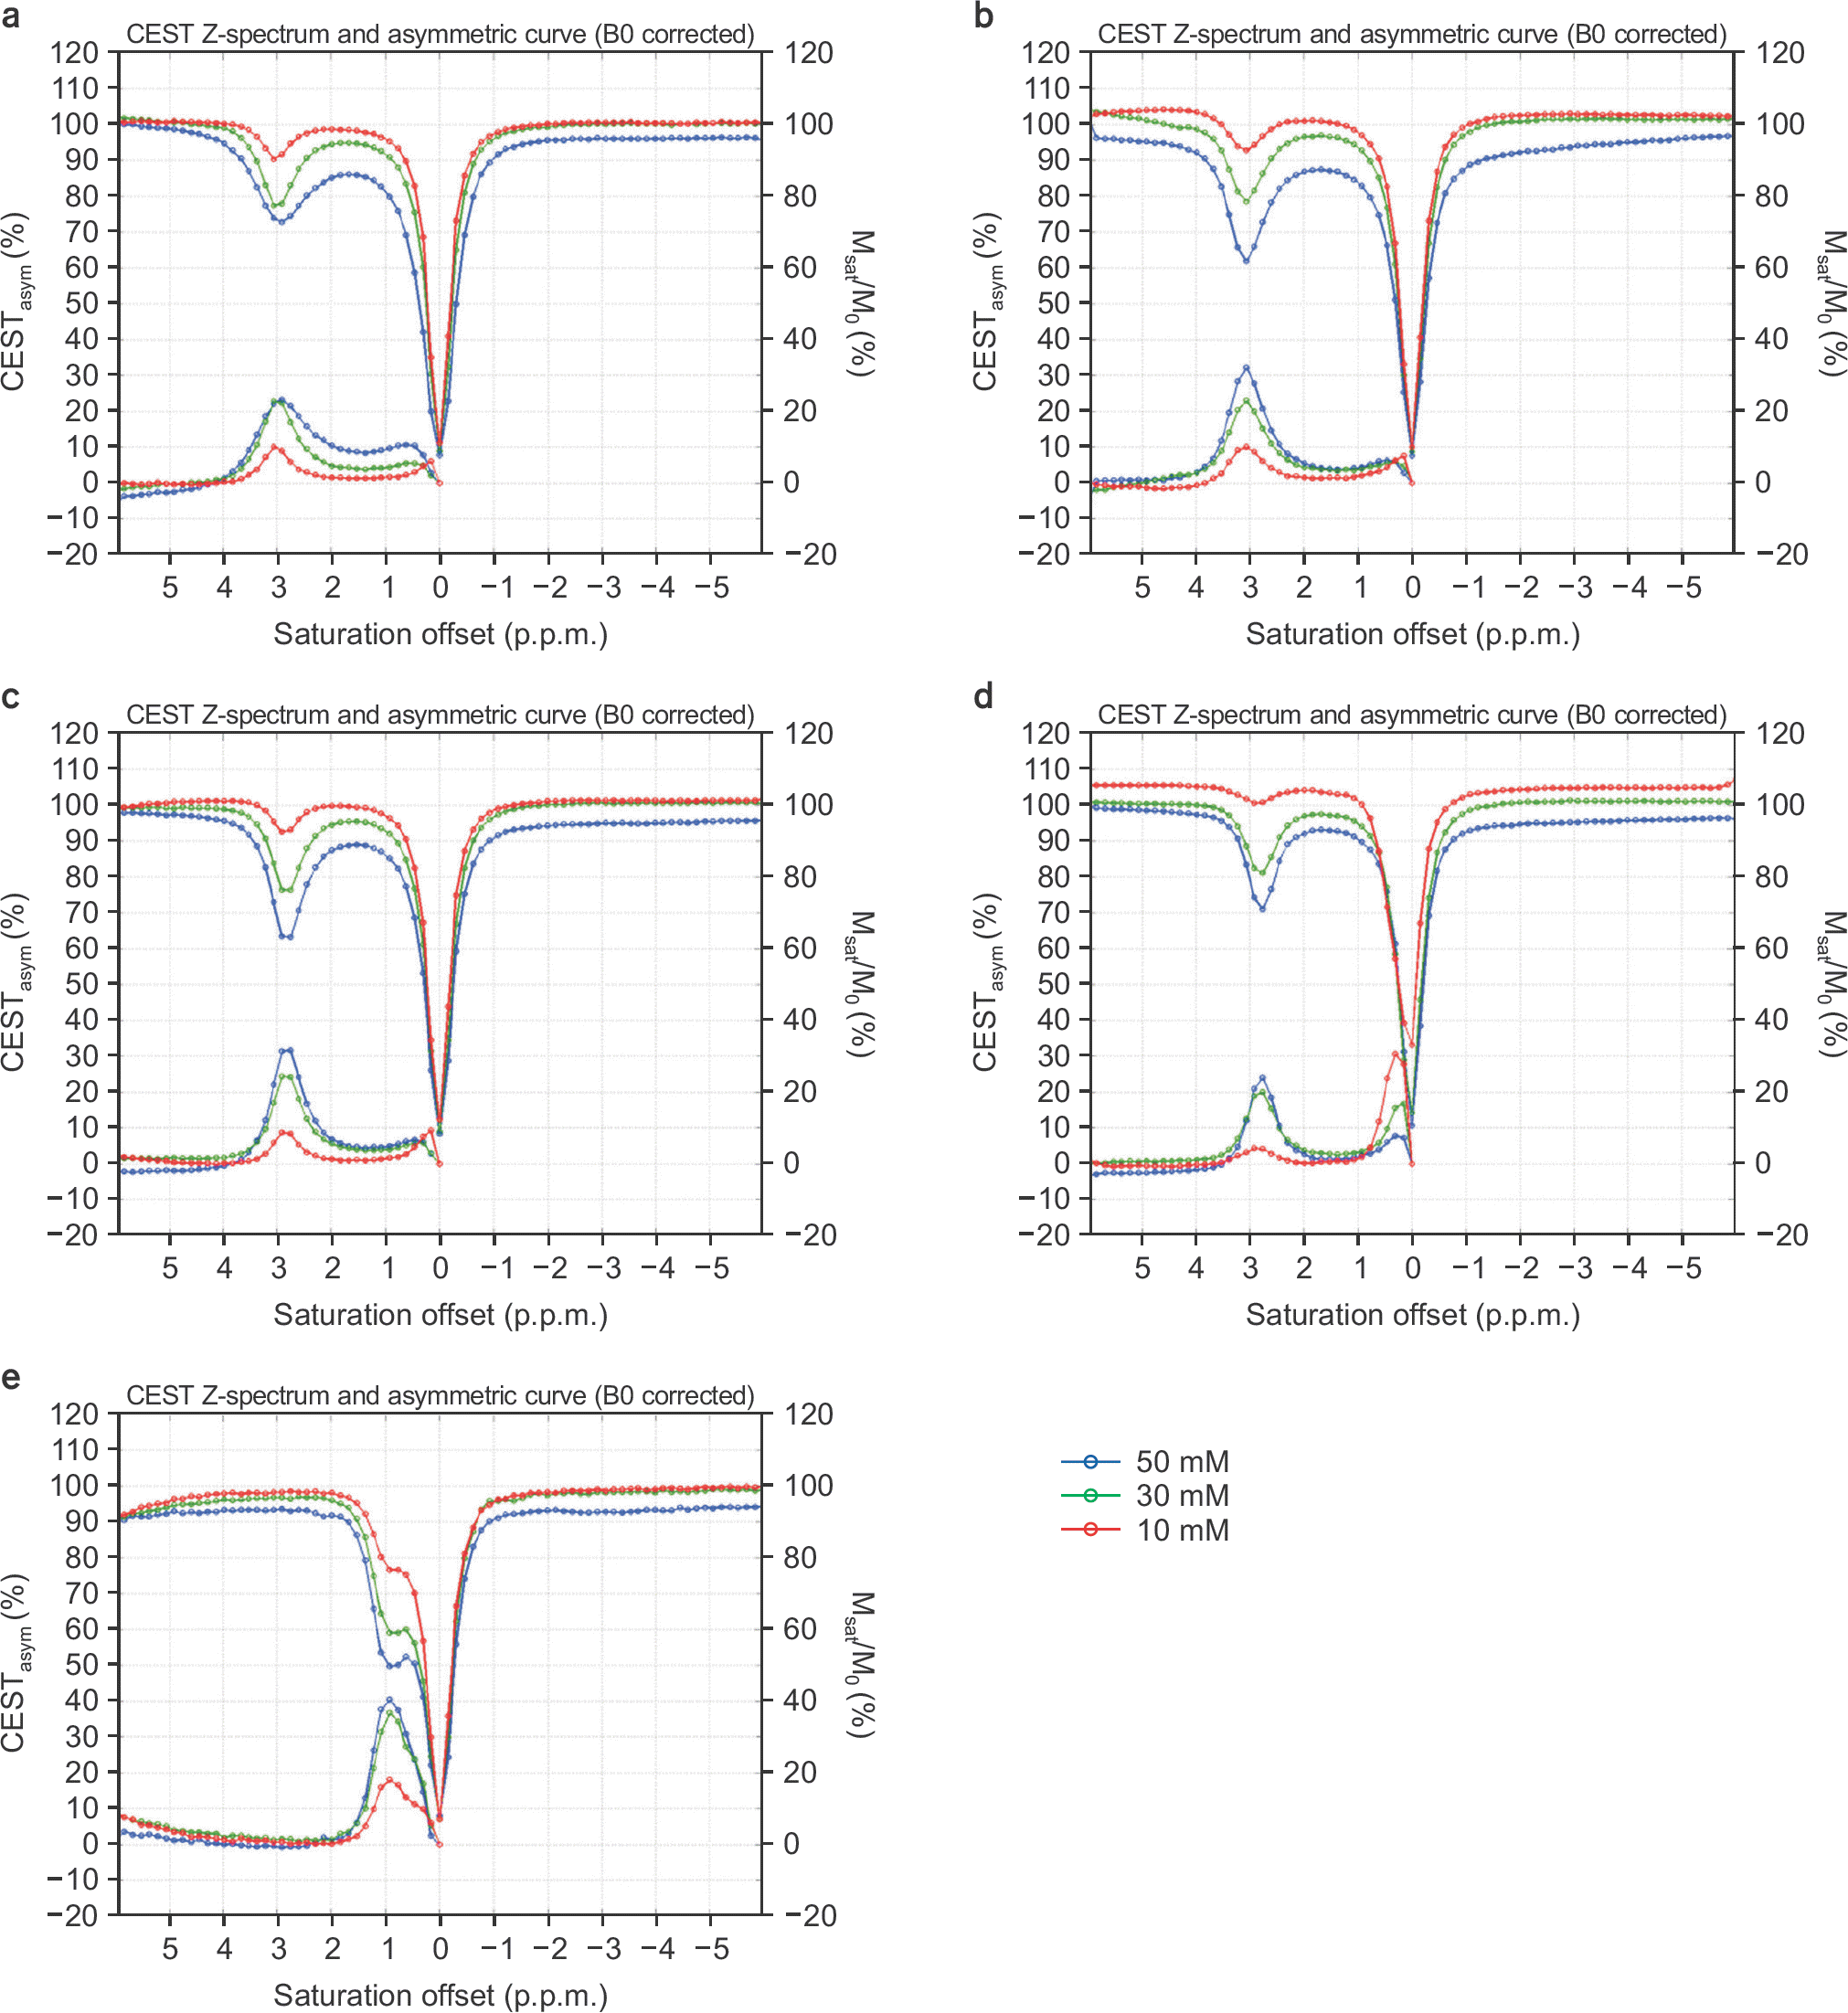 | Fig. 2.Normalized Z-spectra and CEST asymmetric curves with 10 (red), 30 (green), and 50 mM (blue) concentrations with a B1 amplitude of 2μT at pH 5.6 for (a) asparagine, (b) glutamate, (c) GABA, (d) glycine, and (e) myoinositol. The left vertical axis is percentage of the CEST asymmetry, and the right one is the normalized signal ratio for the Z-spectrum. |
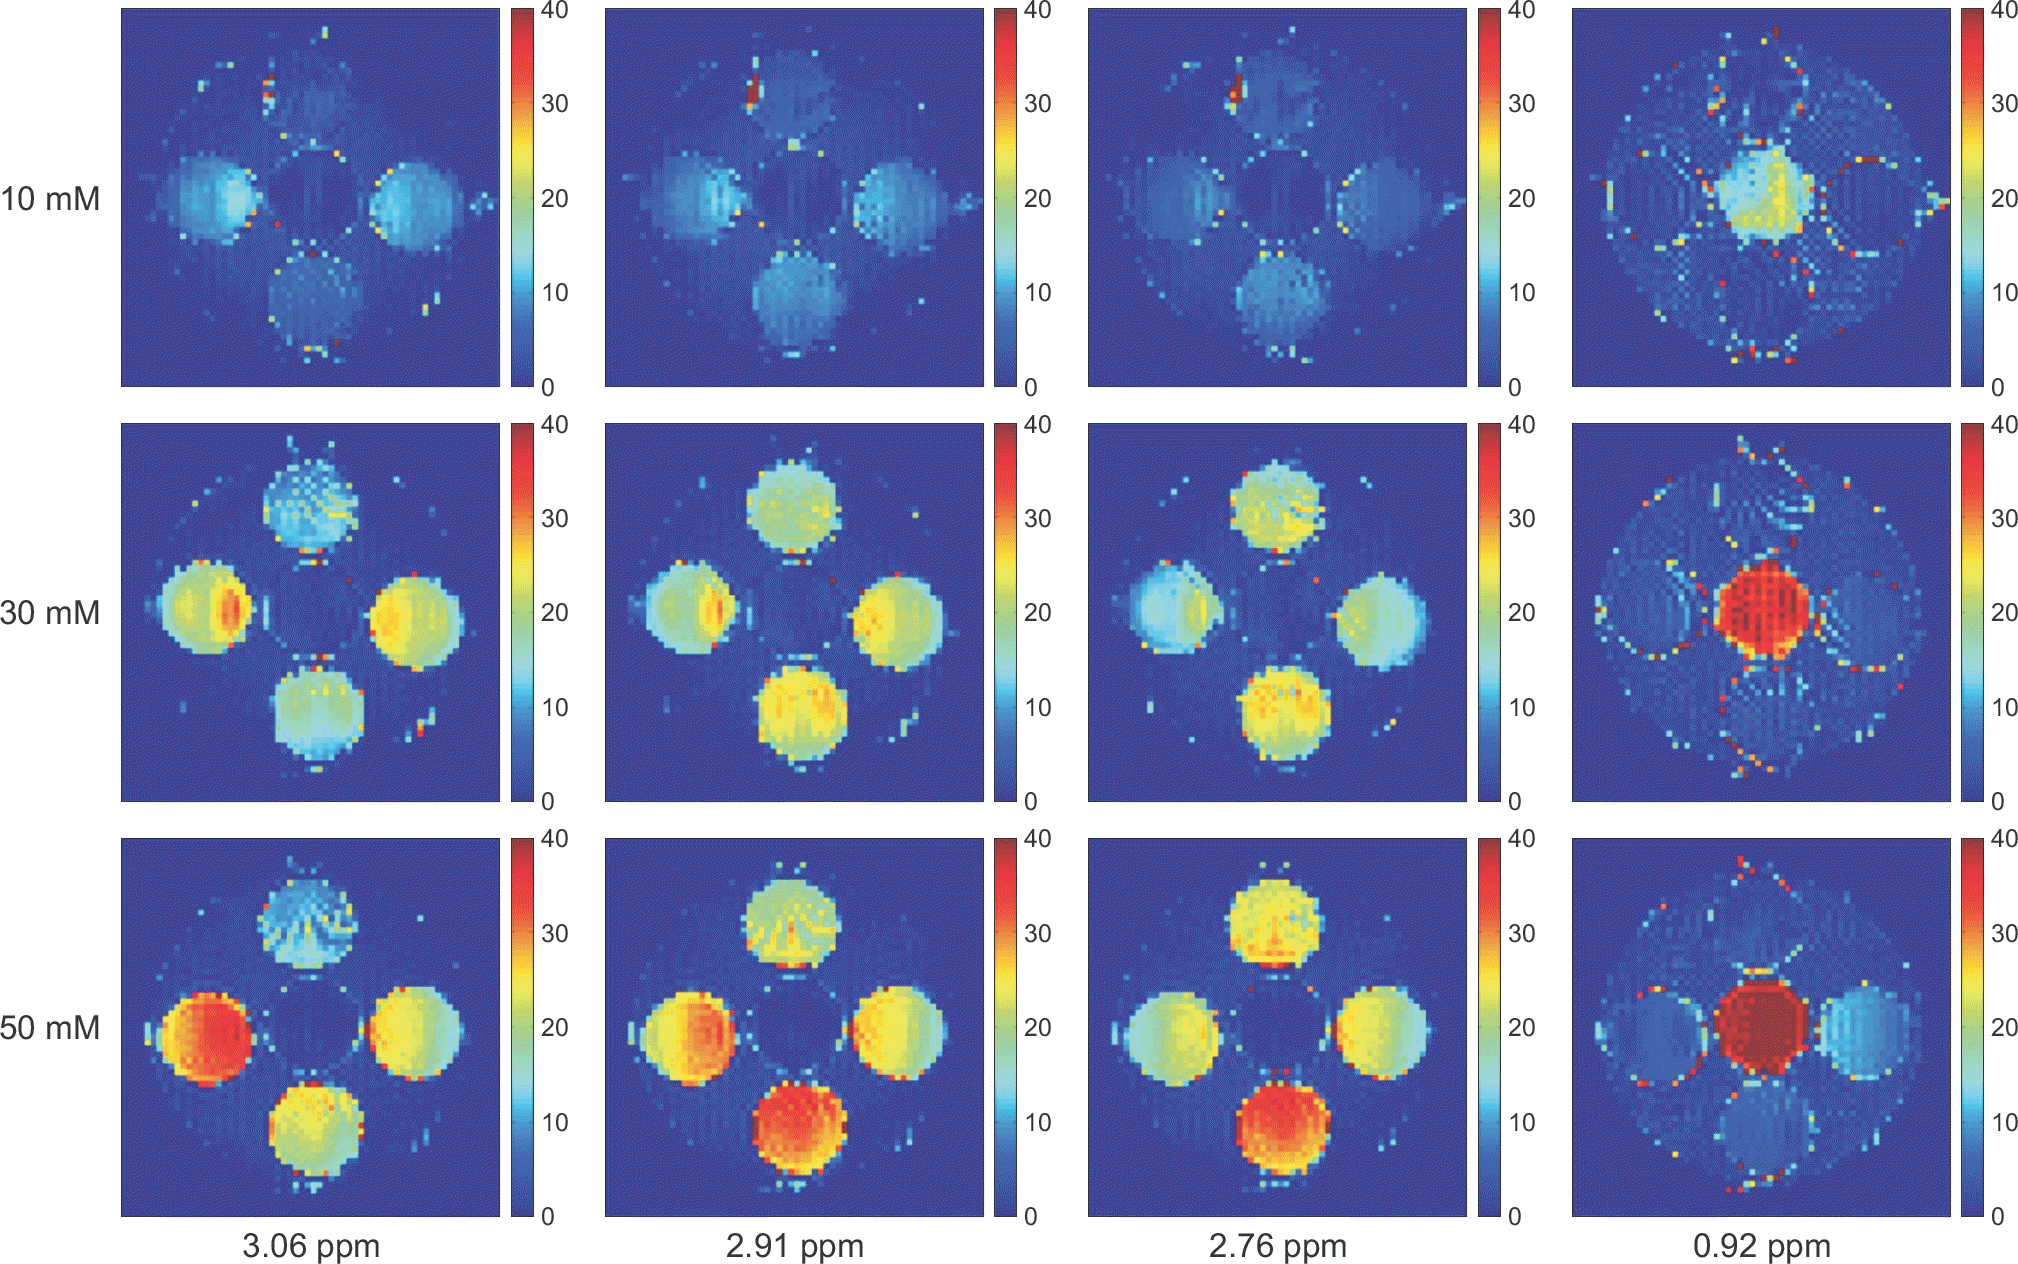 | Fig. 3.CEST asymmetric maps with 10, 30, and 50 mM concentrations for the five targeted molecules with the B1 amplitude of 2 μT and at pH 5.6. The layout of the phantom was shown in Fig. 1. The asymmetric maps were calculated at the specific frequencies which have the highest CEST asymmetries for the five target molecules (Asn=2.91 ppm, Glu=3.06 ppm, GABA and Gly=2.76 ppm, and MI=0.92 ppm). The image scale of the asymmetric maps is 0∼40%. |
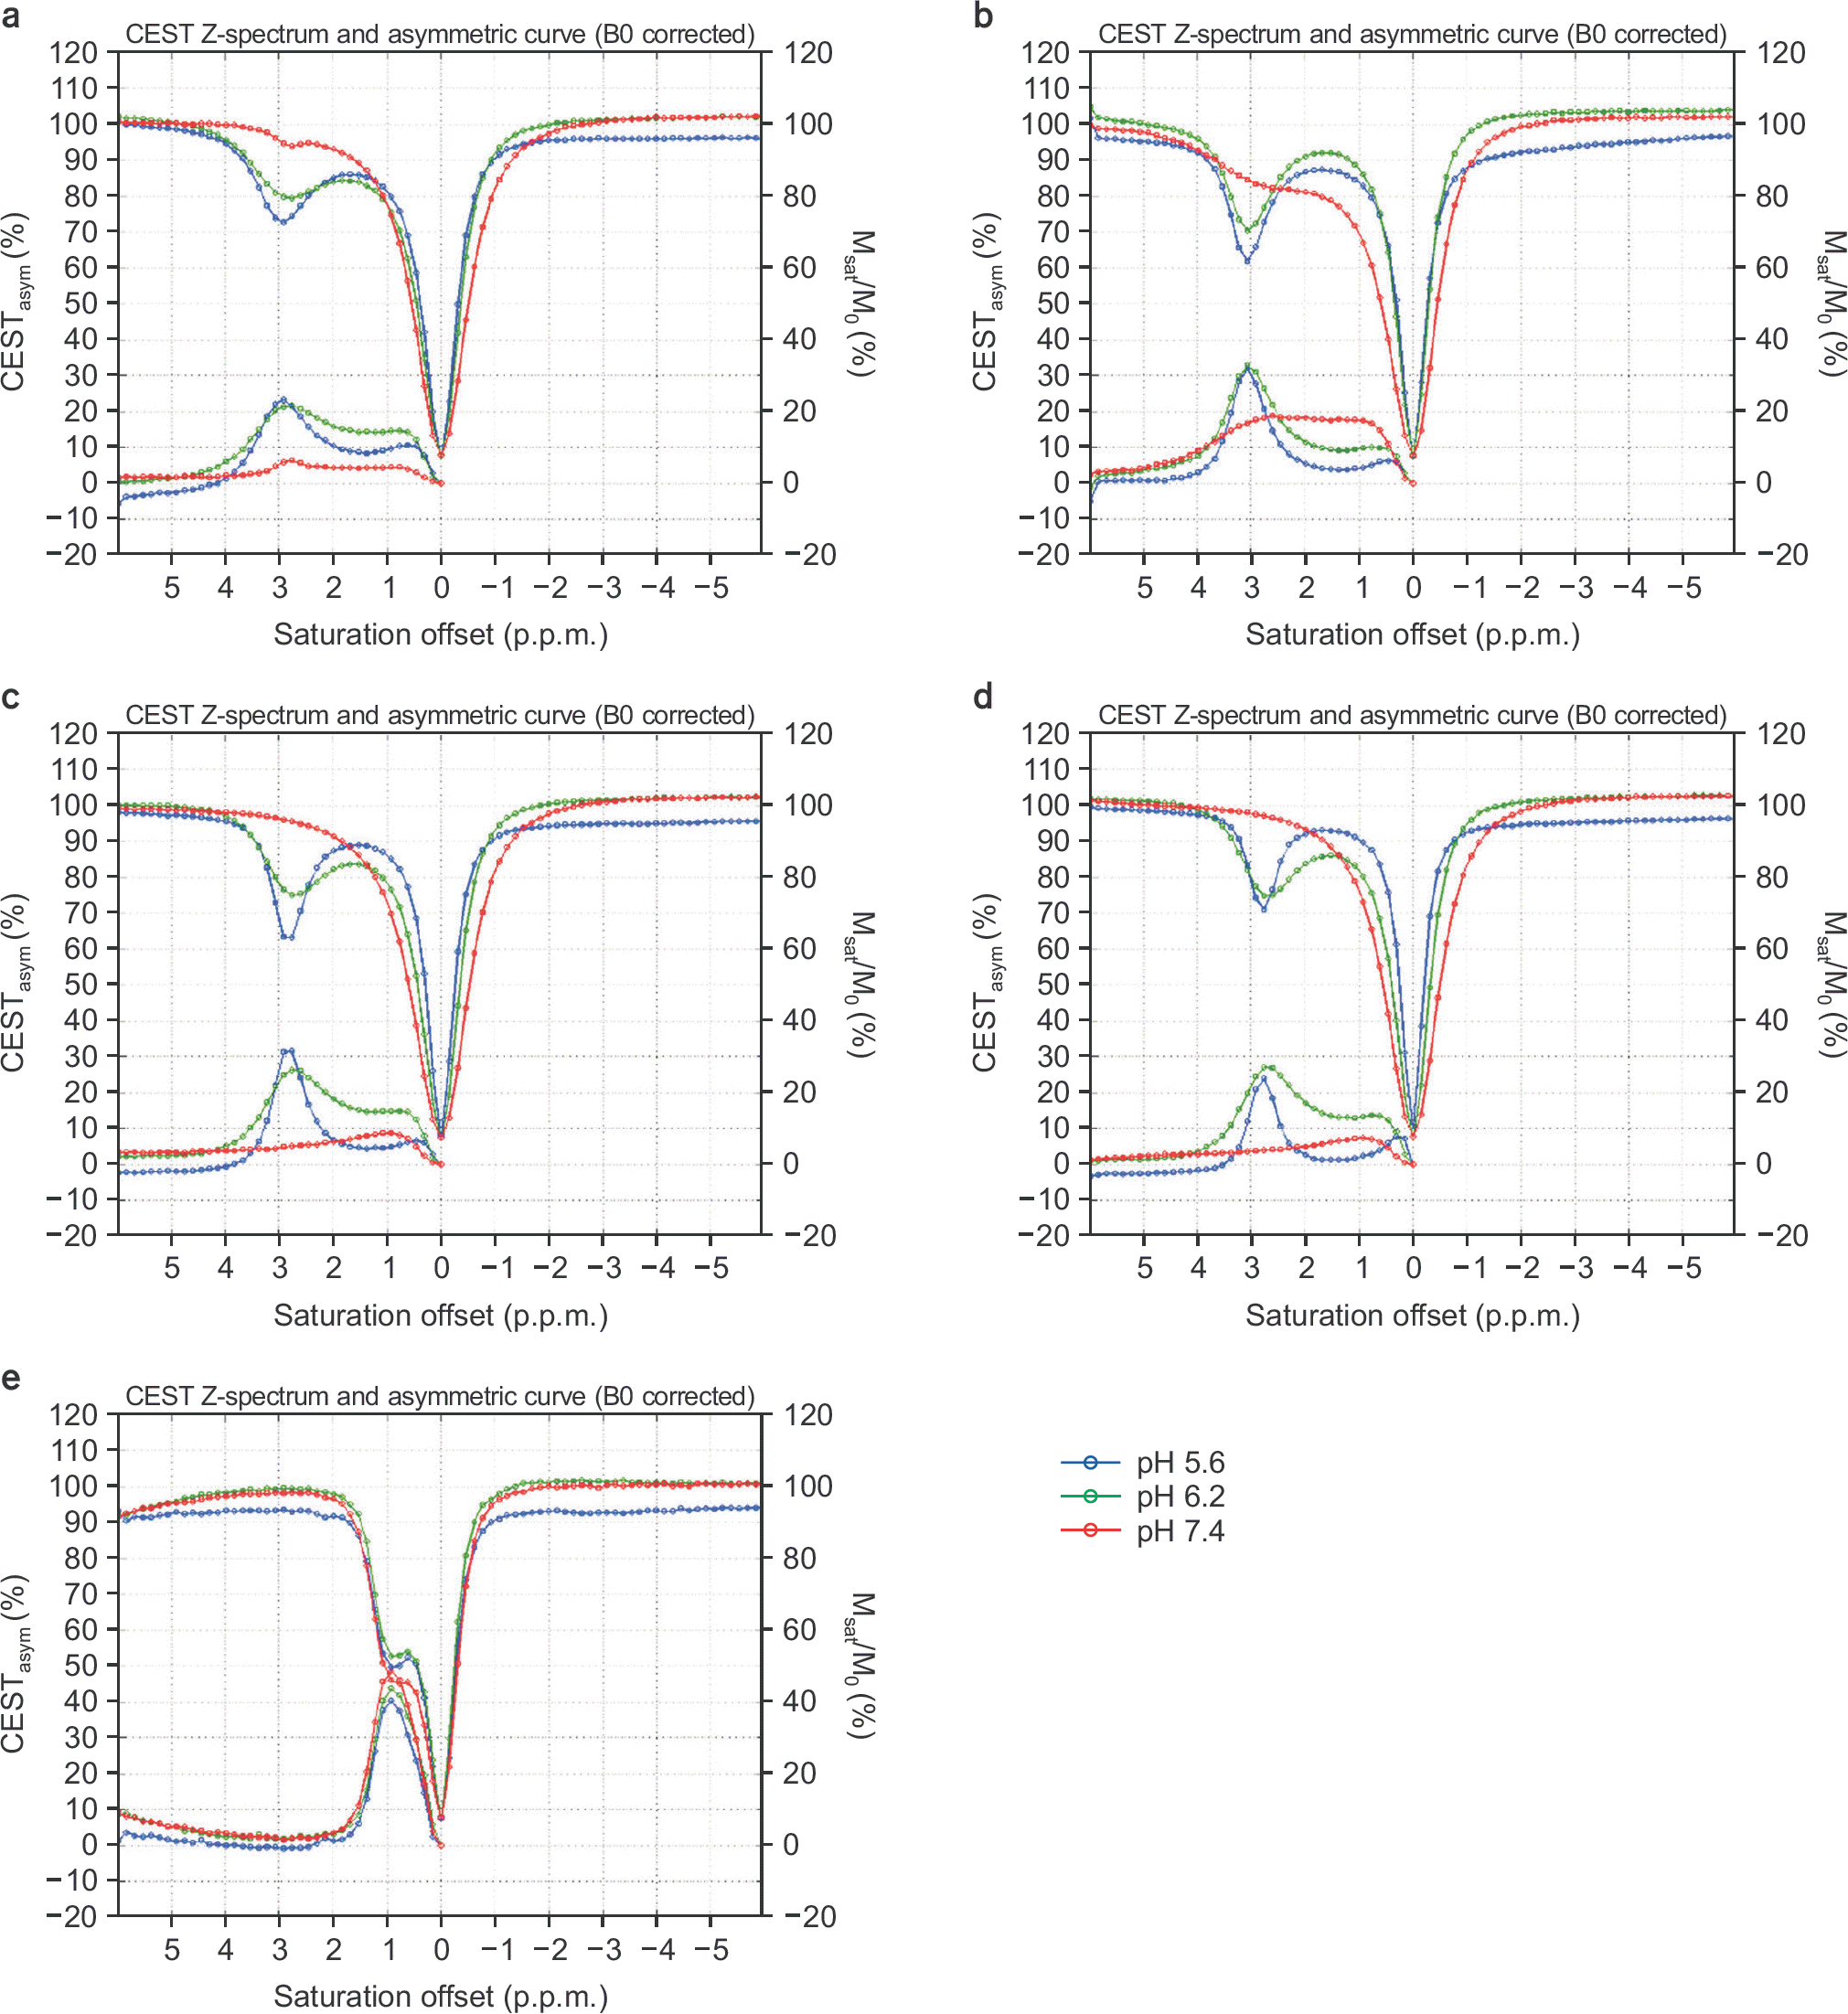 | Fig. 4.Normalized Z-spectra and CEST asymmetric curves with 5.6 (blue), 6.2 (green), and 7.4 (red) pH values with a B1 amplitude of 2 μT and a concentration of 50 mM for (a) asparagine, (b) glutamate, (c) GABA, (d) glycine, and (e) myoinositol. The left vertical axis is percentage of the CEST asymmetry, and the right one is the normalized signal ratio for the Z-spectrum. |
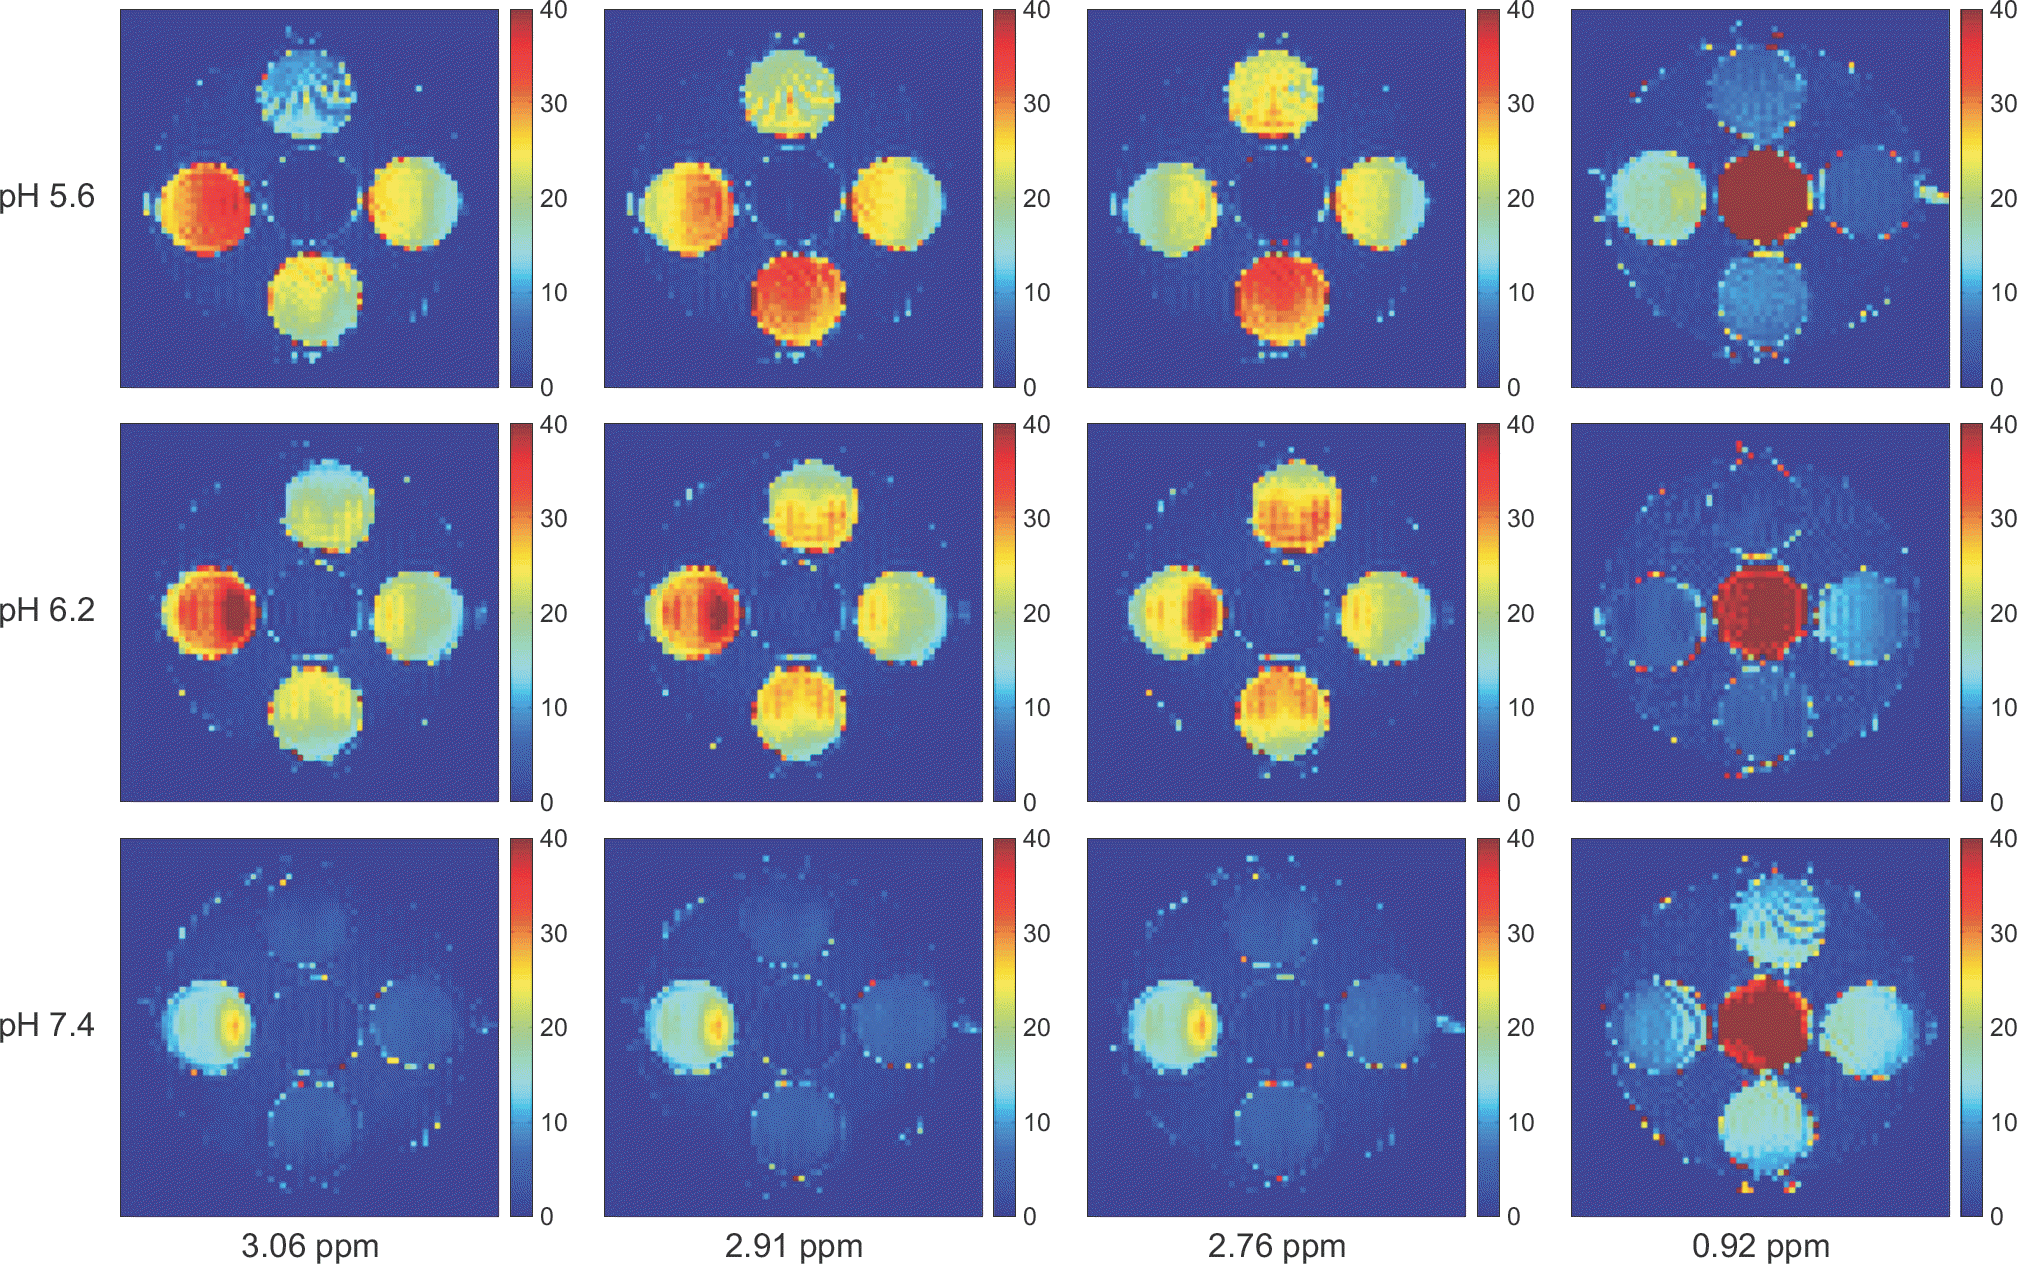 | Fig. 5.The CEST asymmetric maps with 5.6, 6.2, and 7.4 pH values for the five target molecules with the B1 amplitude of 2 μT and the concentration of 50 mM. The layout of the phantom was shown in Fig. 1. The asymmetric maps were calculated at the specific frequencies which have the highest CEST asymmetries for the five target molecules (Asn=2.91 ppm, Glu=3.06 ppm, GABA and Gly=2.76 ppm, and MI=0.92 ppm). The image scale of the asymmetric maps is 0∼40%. |
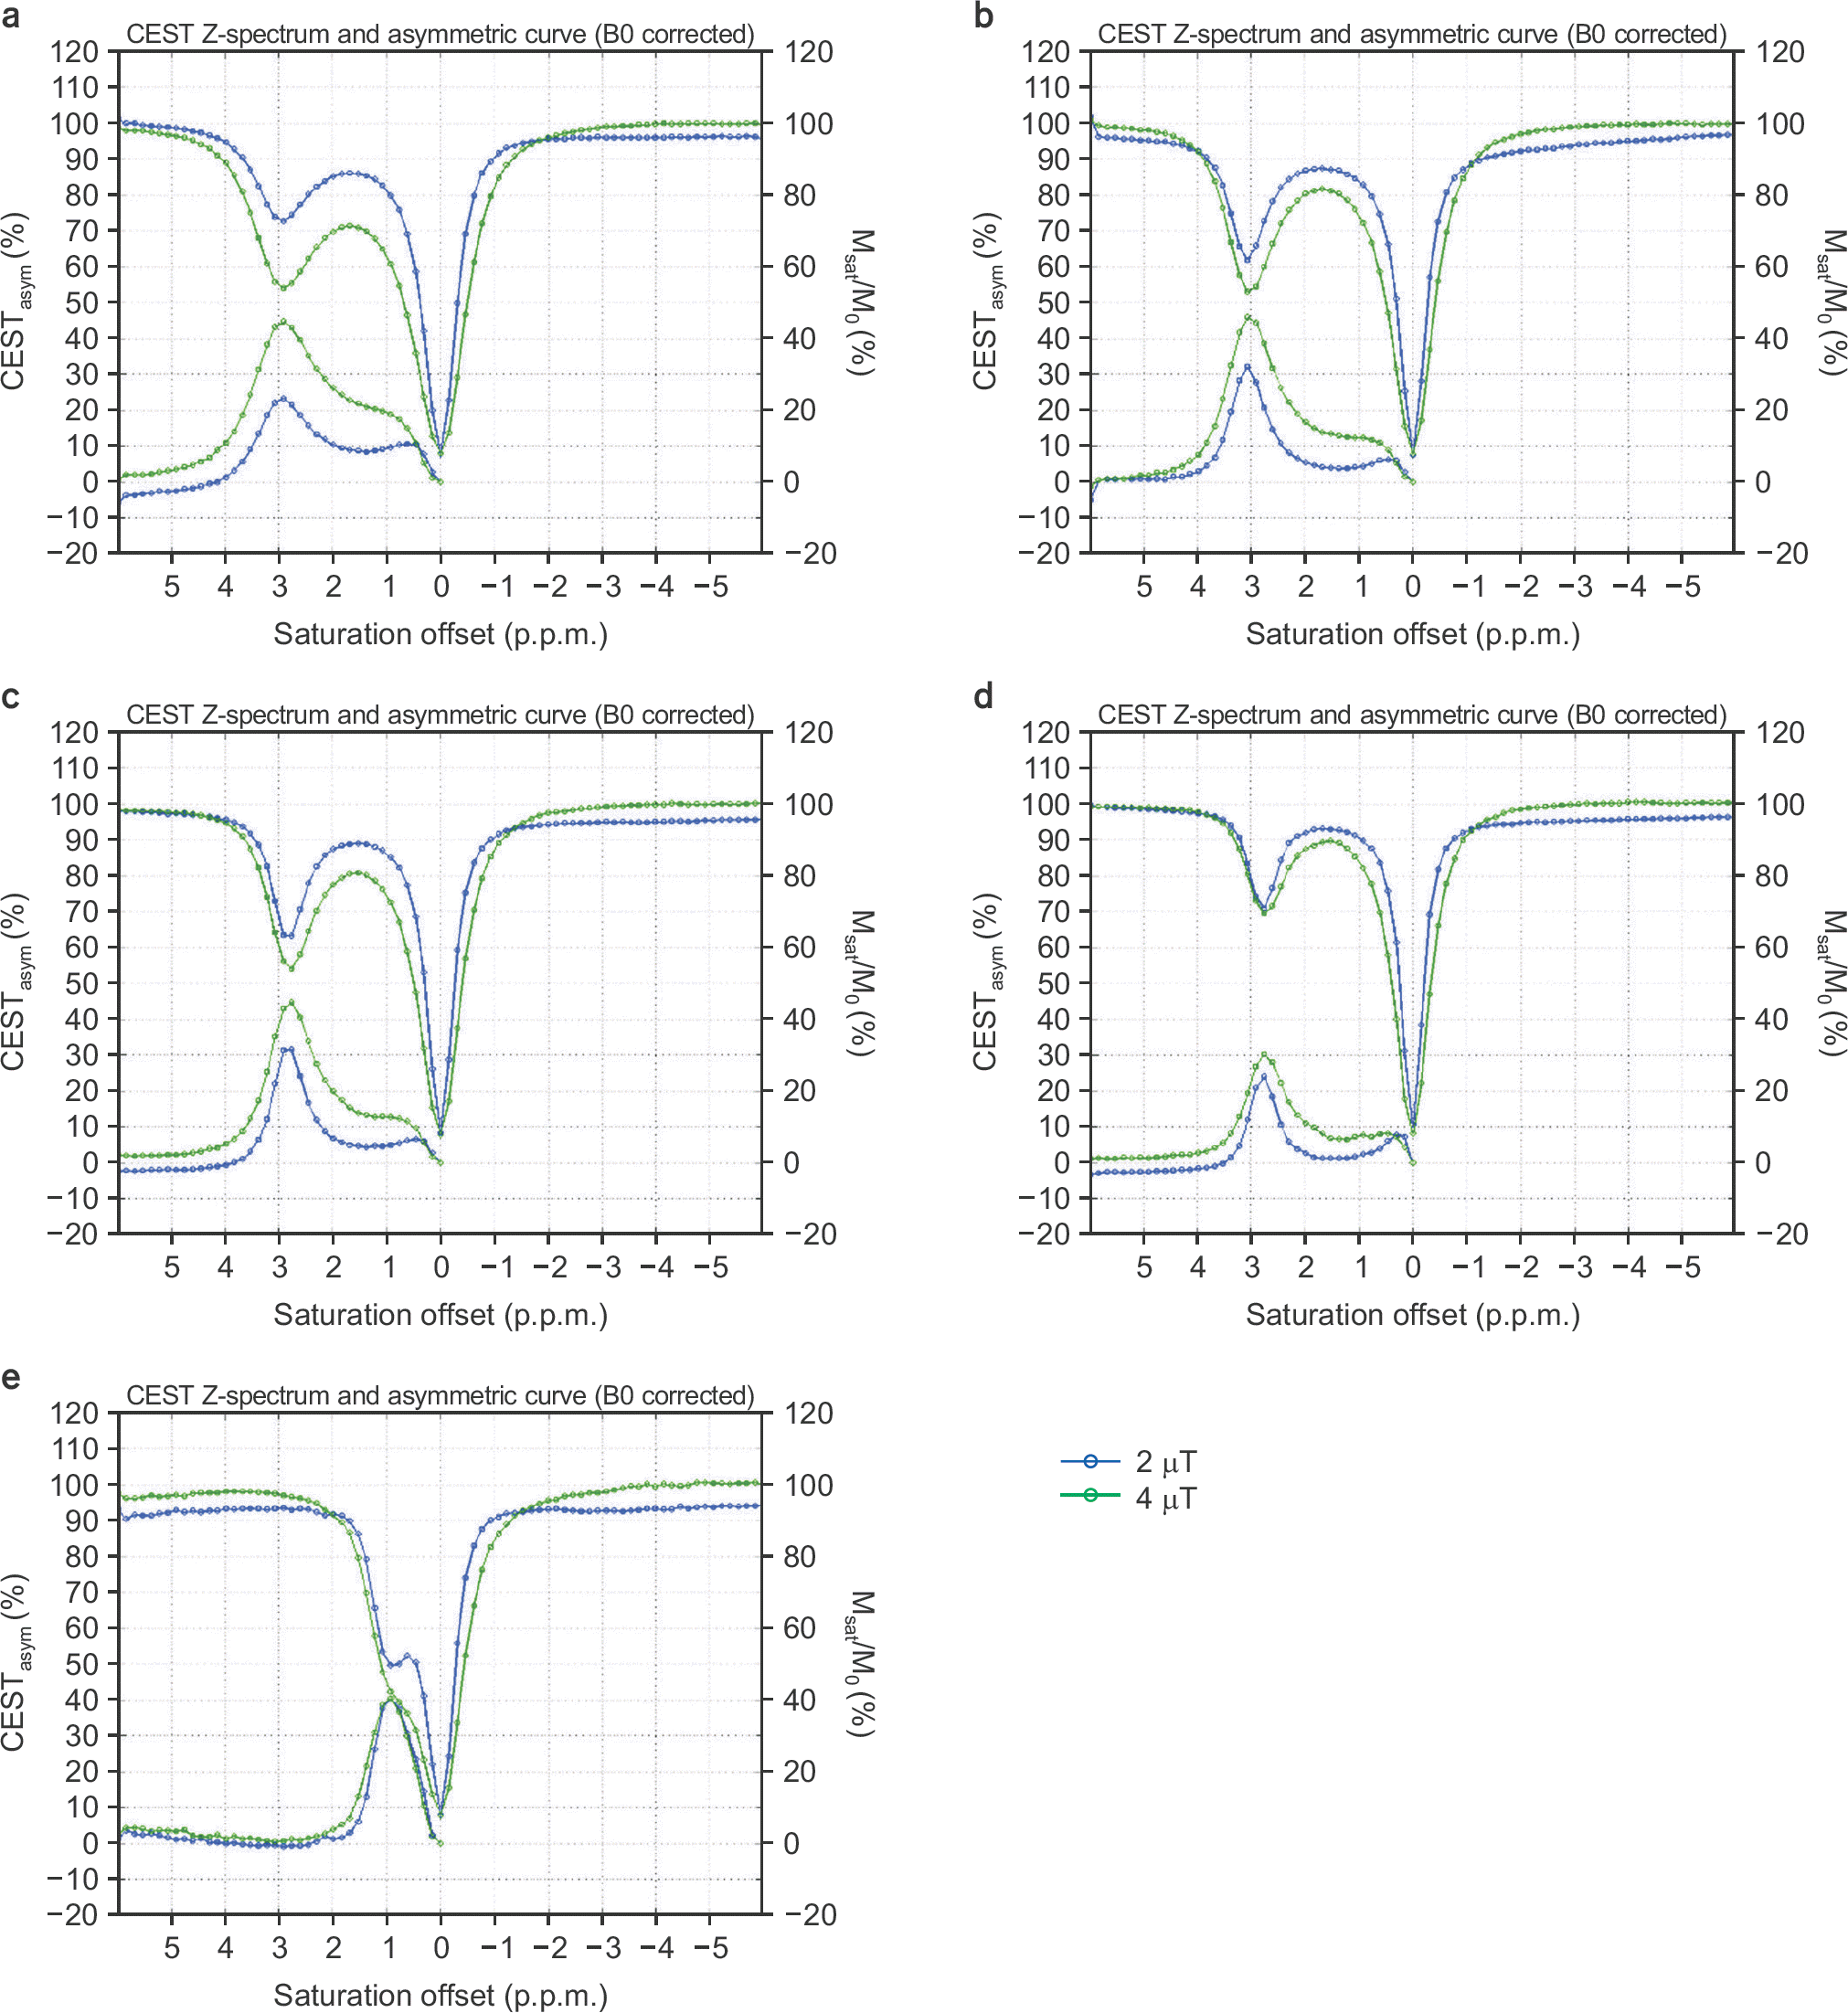 | Fig. 6.Normalized Z-spectra and CEST asymmetric curves with 2 μT (blue) and 4 μT (green) B1 amplitudes of the saturation RF pulse at a concentration of 50 mM and pH 5.6 for (a) asparagine, (b) glutamate, (c) GABA, (d) glycine, and (e) myoinositol. The left vertical axis is percentage of the CEST asymmetry, and the right one is the normalized signal ratio for the Z-spectrum. |
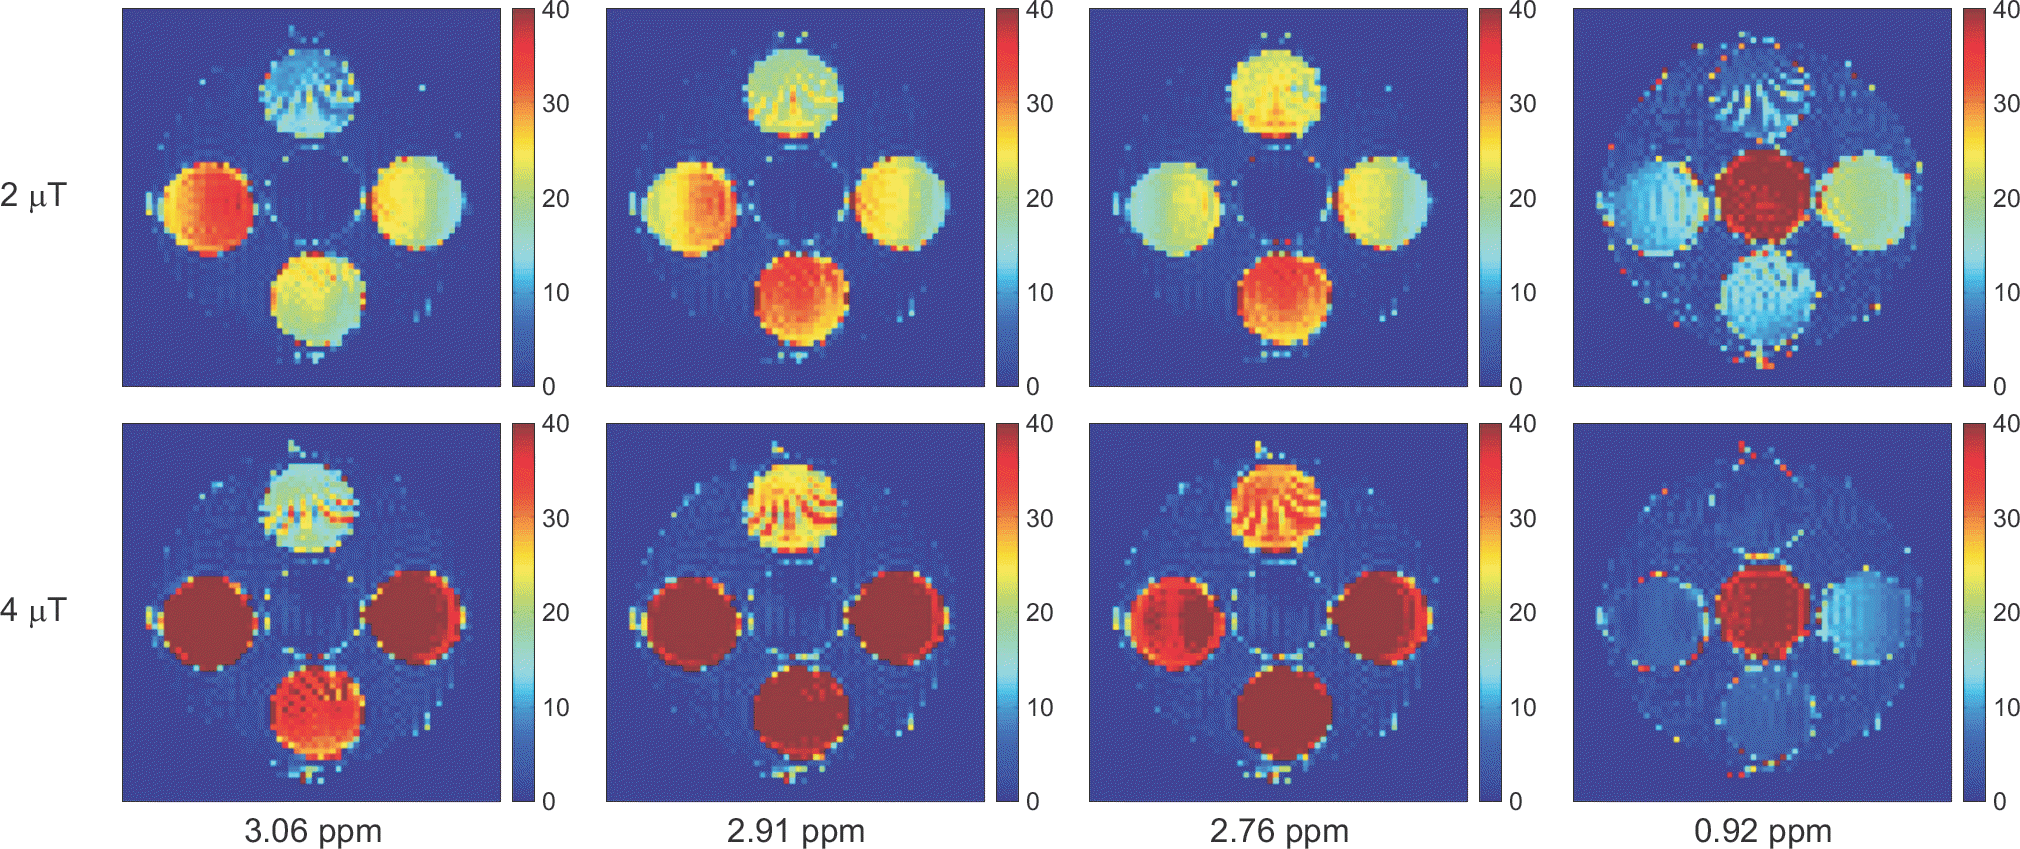 | Fig. 7.The CEST asymmetric maps with B1 amplitudes of 2 and 4 μT of the saturation RF pulse at pH 5.6 and the concentration of 50 mM. The layout of the phantom was shown in Fig. 1. The asymmetric maps were calculated at the specific frequencies which have the highest CEST asymmetries for the five target molecules (Asn=2.91 ppm, Glu=3.06 ppm, GABA and Gly=2.76 ppm, and MI=0.92 ppm). The image scale of the asymmetric maps is 0∼40%. |
 | Fig. 8.The pseudo-first exchange rate experiments with different pH values at 9.4T at the B1 amplitude of 2.35 μT and the concentration of 50 mM for (a) asparagine, (b) glutamate, (c) GABA, (d) glycine, and (e) myoinositol. Data points with different saturation durations are shown with a circle (pH 5.6), a cross (pH 6.2), and a triangle (pH 7.4). Results were plotted with a solid line at pH 5.6, a dashed line at pH 6.2, and a dotted line at pH 7.4. |
Table 1.
Summary of the chemical exchange saturation transfer (CEST) asymmetry (%) for five target molecules.
Table 2.
Summary of the pseudo-first exchange rate of k1=ksw×Xca [s−1] for the five target molecules at 9.4T.


 PDF
PDF ePub
ePub Citation
 Print
Print


 XML Download