



 PDF
PDF ePub
ePub Citation
 Print
Print


Abstract
In this work, we investigated the recently proposed phase-contrast x-ray imaging (PCXI) technique, the so-called single grid-based PCXI, which has great simplicity and minimal requirements on the setup alignment. It allows for imaging of smaller features and variations in the examined sample than conventional attenuation-based x-ray imaging with lower x-ray dose. We performed a systematic simulation using a simulation platform developed by us to investigate the image characteristics. We also performed a preliminary PCXI experiment using an established a table-top setup to demonstrate the performance of the simulation platform. The system consists of an x-ray tube (50 kVp, 5 mAs), a focused-linear grid (200-lines/inch), and a flat-panel detector (48-mm pixel size). According to our results, the simulated contrast of phase images was much enhanced, compared to that of the absorption images. The scattering length scale estimated for a given simulation condition was about 117 nm. It was very similar, at least qualitatively, to the experimental contrast, which demonstrates the performance of the simulation platform. We also found that the level of the phase gradient of oriented structures strongly depended on the orientation of the structure relative to that of linear grids.
REFERENCES
1. Lewis R. Medical phase contrast x-ray imaging: current status and future prospects. Phys. Med. Biol. 2004; 49:3573–3583.

2. Parham C, Zhong Z, Connor D, Chapman L, Pisano E. Design and implementation of a compact low-dose diffraction enhanced medical imaging system. Acad. Radiol. 2009; 16:911–917.
3. Burvall A, Lundström U, Takman P, Larsson D, Hertz H. Phase retrieval in X-ray phase-contrast imaging suitable for tomography. Opt. Express. 2011; 19:10359–10376.
4. Pfeiffer F, Bech M, Bunk O, Kraft P, Eikenberry E, Brön-nimann C, et al. Hard-X-ray dark-field imaging using a grating interferometer. Nat. Mater. 2008; 7:134–137.
5. Pfeiffer F, Herzen J, Willner M, Chabior M, Auweter S, Reiser M, et al. Grating-based x-ray phase contrast for biomedical imaging applications. Z. Med. Phys. 2013; 23:176–185.
6. Wen H, Bennett E, Kopace R, Stein A, Pai V. Single-shot x-ray differential phase-contrast and diffraction imaging using two-dimensional transmission gratings. Opt. Lett. 2010; 35:1932–1934.
7. Wen H, Bennett E, Hegedus M, Carroll S. Spatial harmonic imaging of x-ray Scattering-Initial results. IEEE Trans. on Med. Imaging. 2008; 27:997–1002.
8. Goodman J. Introduction to Fourier optics. 3rd ed.Englewood: Roberts and Company Publishers;2005.
9. Gauntt D, Barnes G. Grid line artifact formation: A comprehensive theory. Med. Phys. 2006; 33:1668–1677.
10. Wen H, Bennett E, Hegedus M, Rapacchi S. Fourier x-ray Scattering radiography yields bone structural information. Radiology. 2009; 251:910–918.
11. Pfeiffer F, Bunk O, David C, Bech M, Duc G, Bravin A, et al. High-resolution brain tumor visualization using three-dimensional x-ray phase contrast tomography. Phys. Med. Biol. 2007; 52:6923–6930.
12. Shepp L, Logan B. The Fourier reconstruction of a head section. IEEE Trans. on Nucl. Sci. 1974; 21:21–43.
13. Kramer R, Cassola V, Khoury H, Vieira J, Lima V, Brown K. FASH and MASH: female and male adult human phantoms based on polygon mesh surfaces: II. Dosimetric calculations. Phys. Med. Biol. 2010; 55:163–189.
14. http://www.ts-imaging.net/Services/Simple/ICUtilXdata.aspx
15. Park Y, Cho H, Lim H, Je U, Park C, Cho H, et al. Experimental Study for Phase-contrast X-ray Imaging Based on a Single Antiscatter Grid and a Polychromatic X-ray Source. Prog. in Med. Phys. 2015; 26:1–8.
16. Kottler C, David C, Pfeiffer F, Bunk O. A two-directional approach for grating based differential phase contrast imaging using hard x-rays. Opt. Express. 2007; 15:1175–1181.
17. Wen H, Bennett E, Kopace R, Stein A, Pai V. Single-shot x-ray differential phase contrast and diffraction imaging using two-dimensional transmission gratings. Opt. Lett. 2010; 35:1932–1934.
18. Tahir S. Grid-Based Fourier Transform Phase Contrast Imaging. Ph.D. thesis. State University of New York. 2015.
Fig. 1.
Schematic illustration of the single grid-based PCXI setup. Here the x-ray grid is placed midway between the x-ray source and the detector and an object to be examined is placed ahead of the grid.
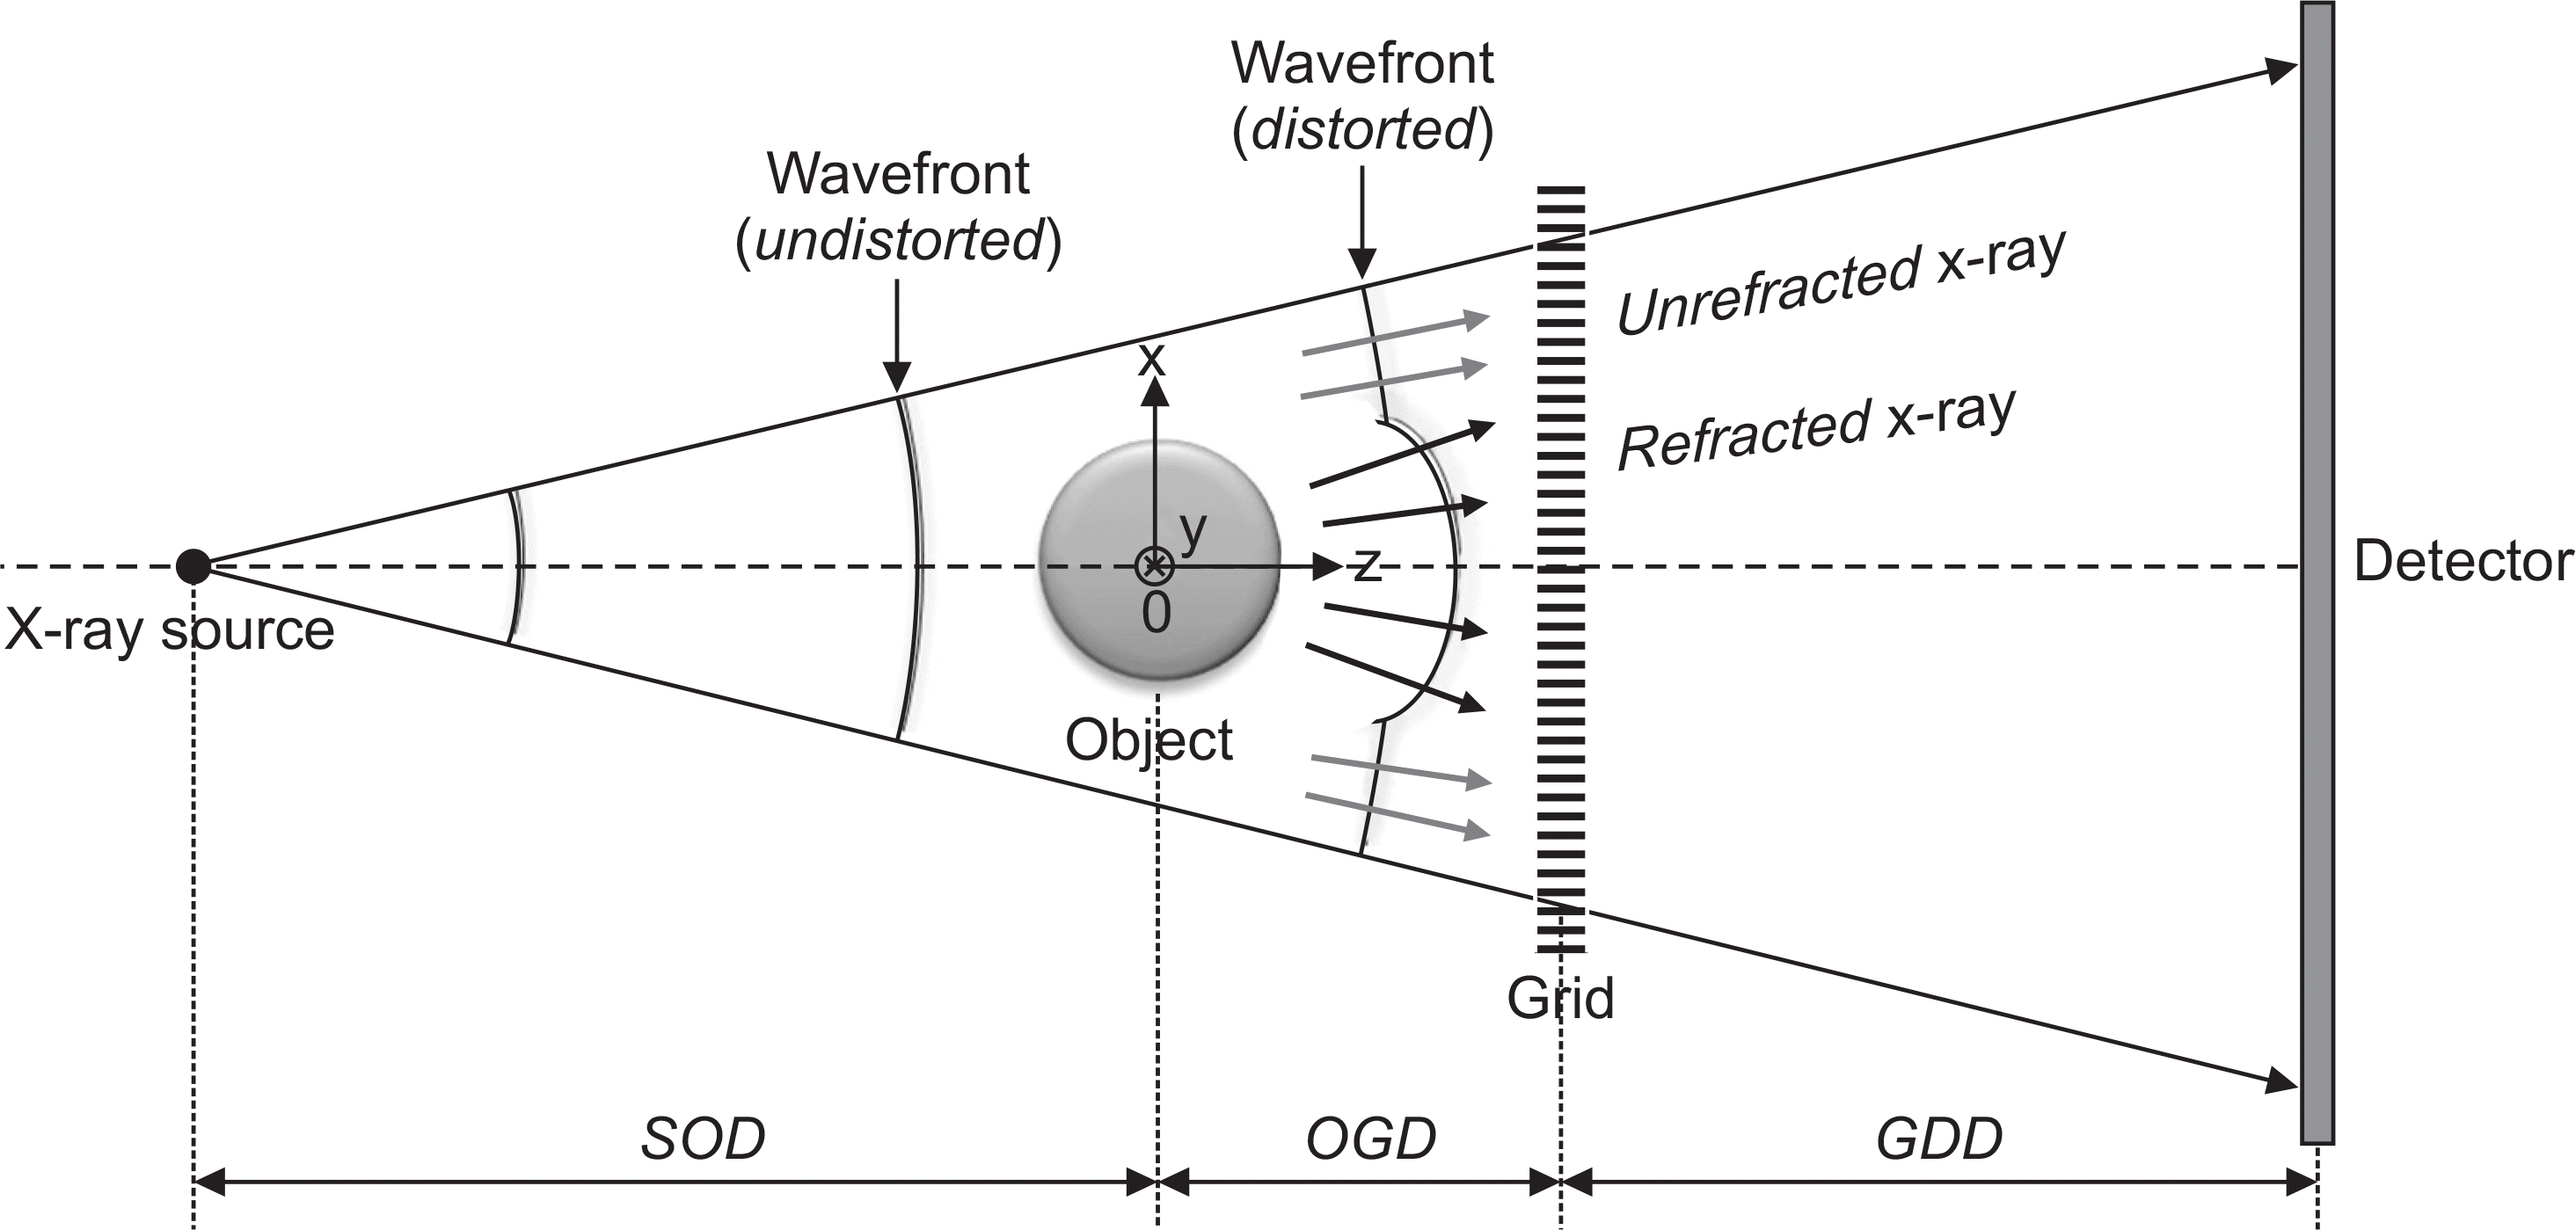
Fig. 2.
Schematic illustration of a geometry for the free-space propagation of x-rays. The wavefront ψ (x,y,z) in the detector plane that is calculated using the Huygens-Fresnel principle.
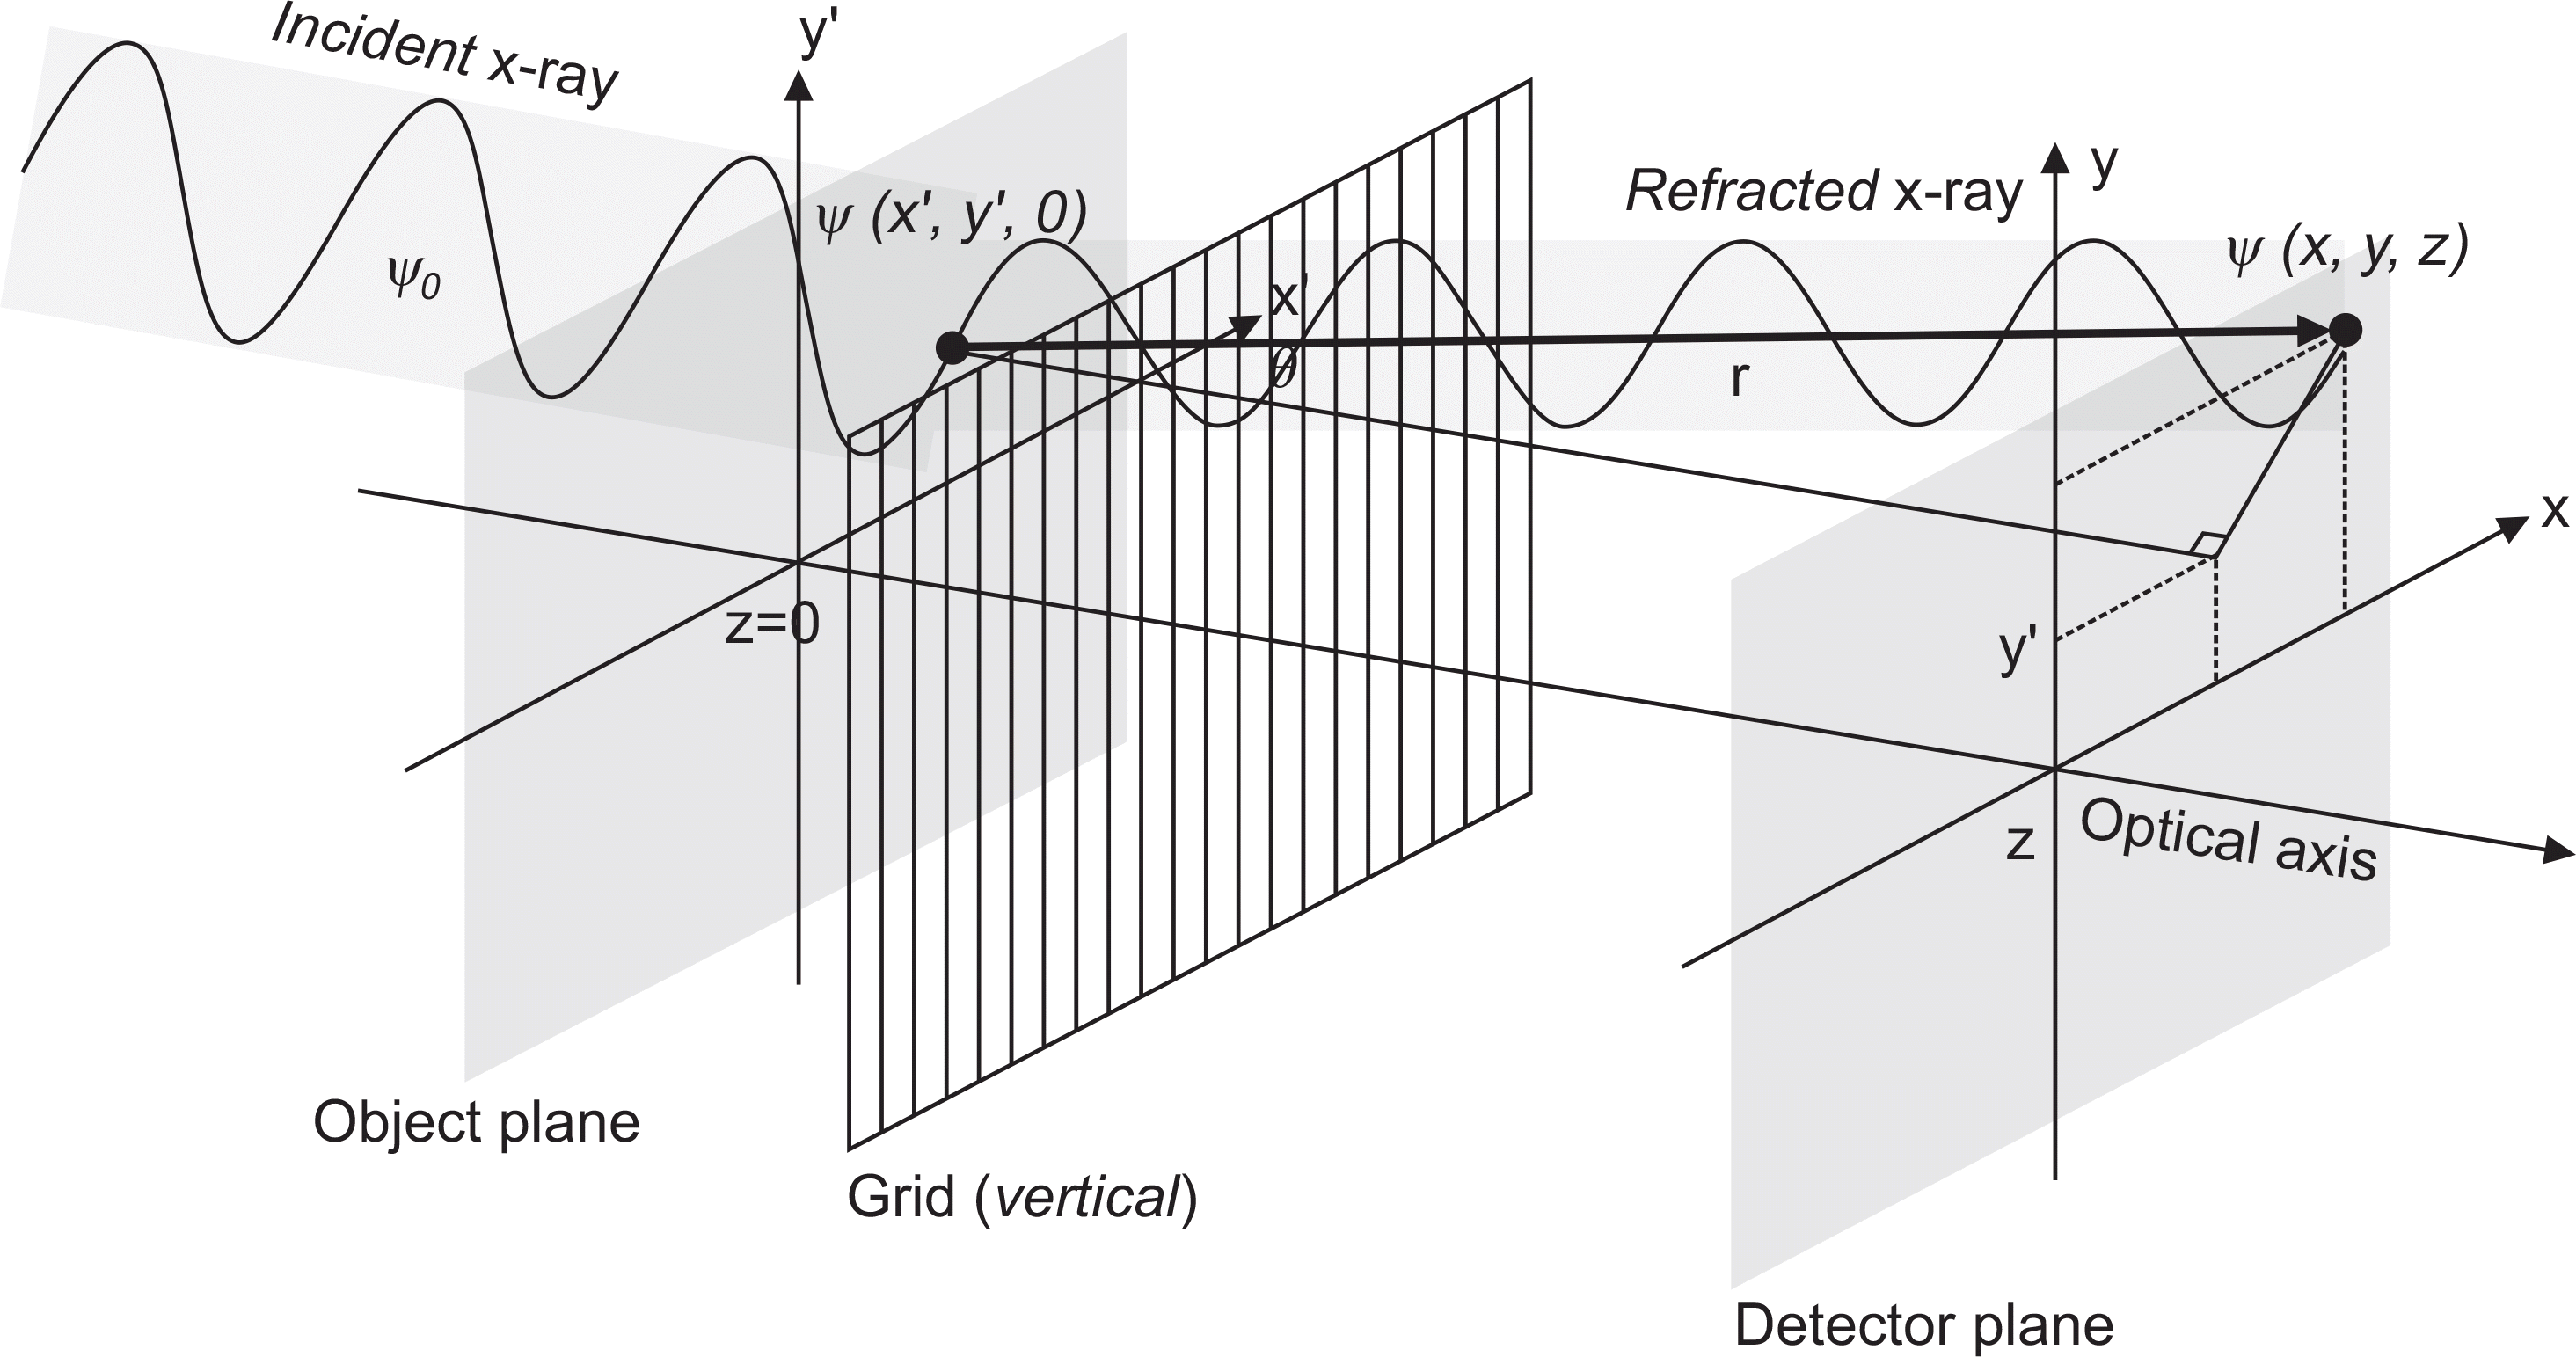
Fig. 3.
The primary transmission, tgrid, of an ideal linear grid oriented in the vertical direction (i.e., in x). Here, d and D are the width of the lead strips and the distance between them, respectively, and P is the grid pitch.
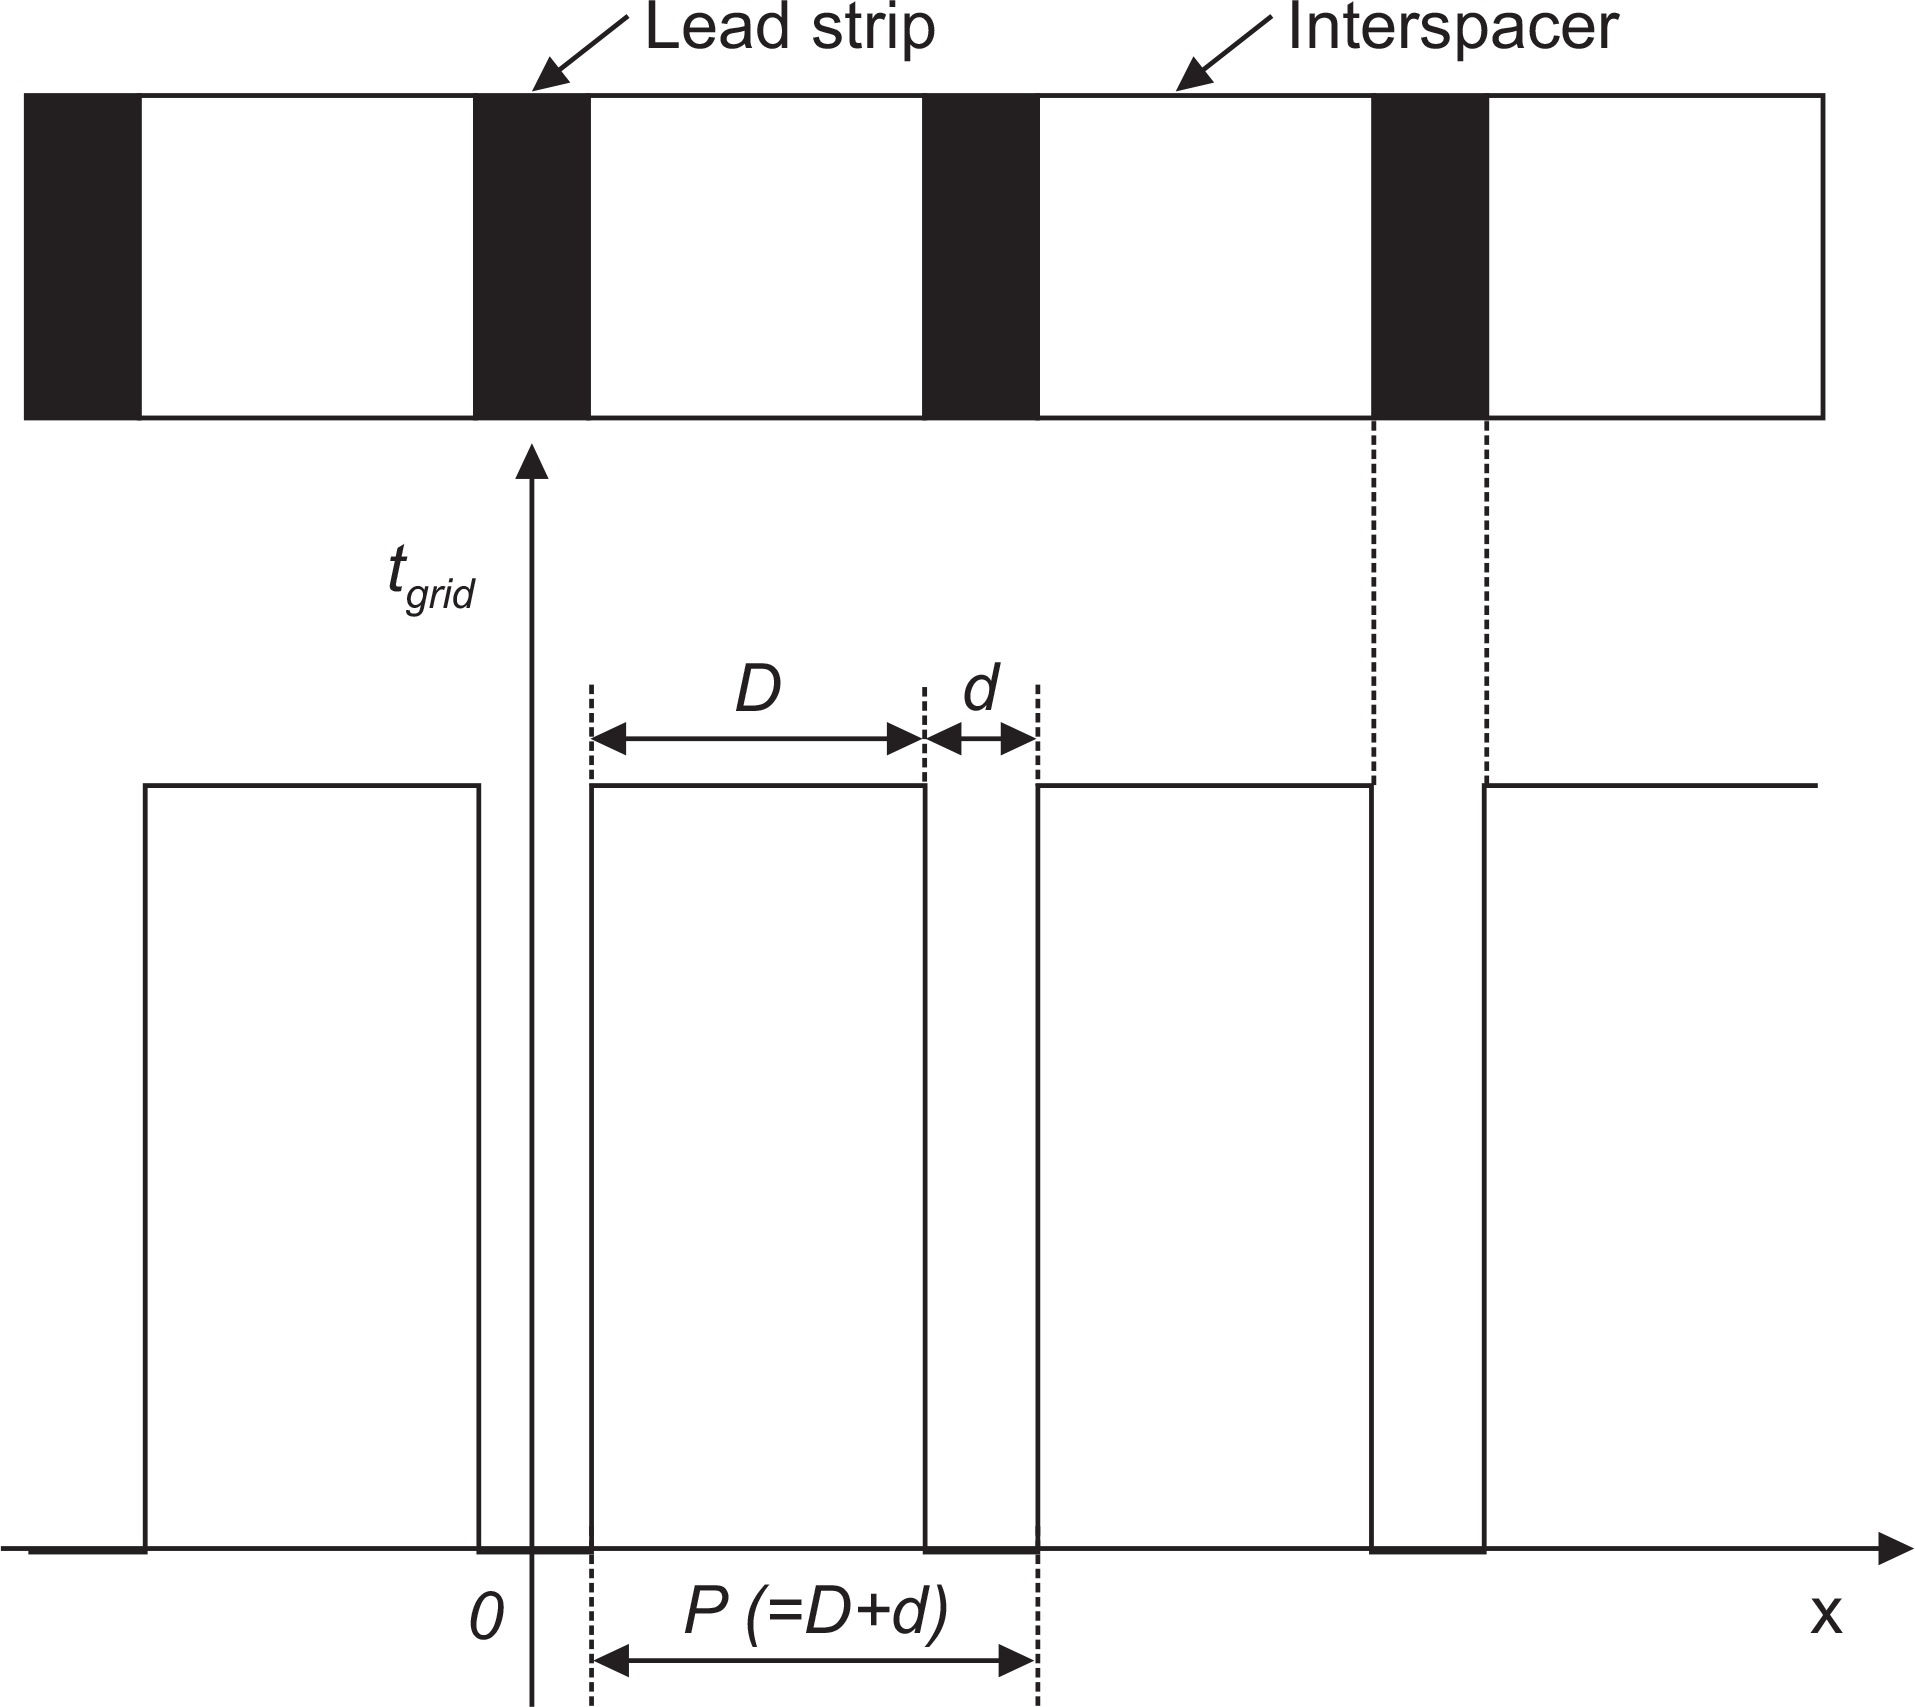
Fig. 4.
The simplified Fourier processing in the single grid-based PCXI to extract absorption image and differential phase image from the two raw images of the sample with a linear grid (fsg) and the bare grid (fg).
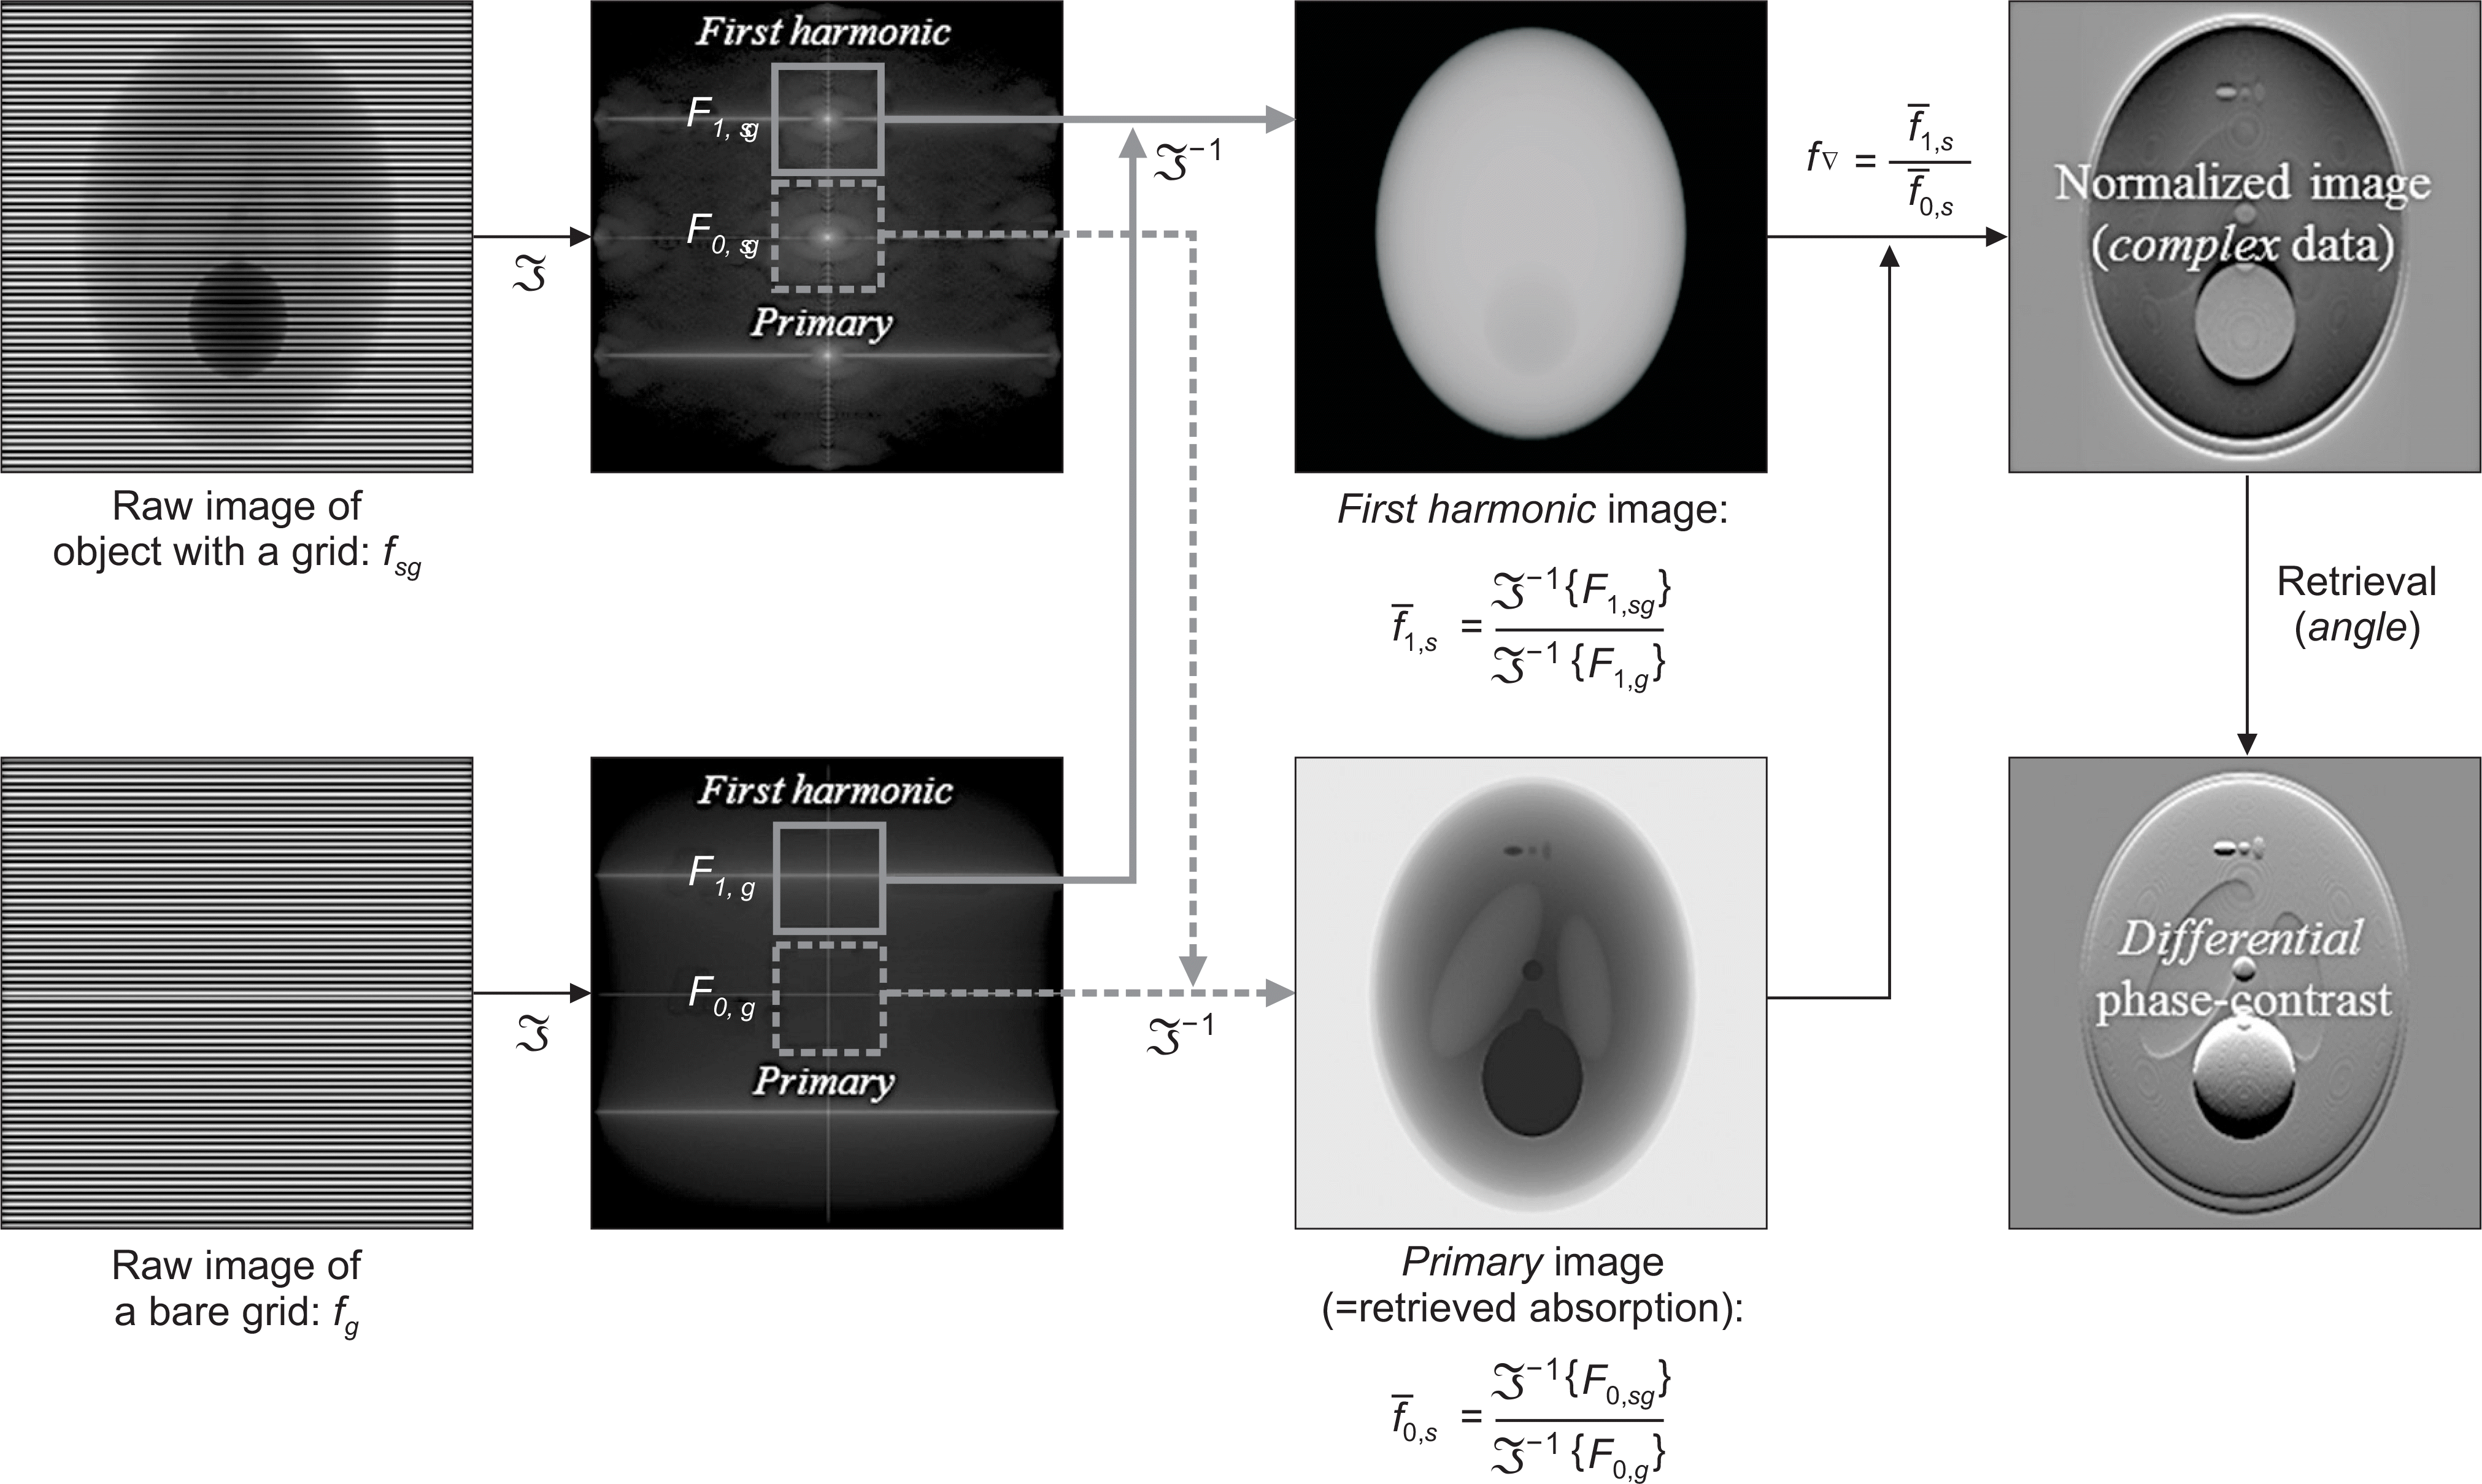
Fig. 5.
(a) The 3D numerical chest phantom (478×258×434 voxels) in AP positioning (left) and LA (right) positioning and (b) the 3D Shepp-Logan phantom (400×400×400 voxels) used in the simulation.
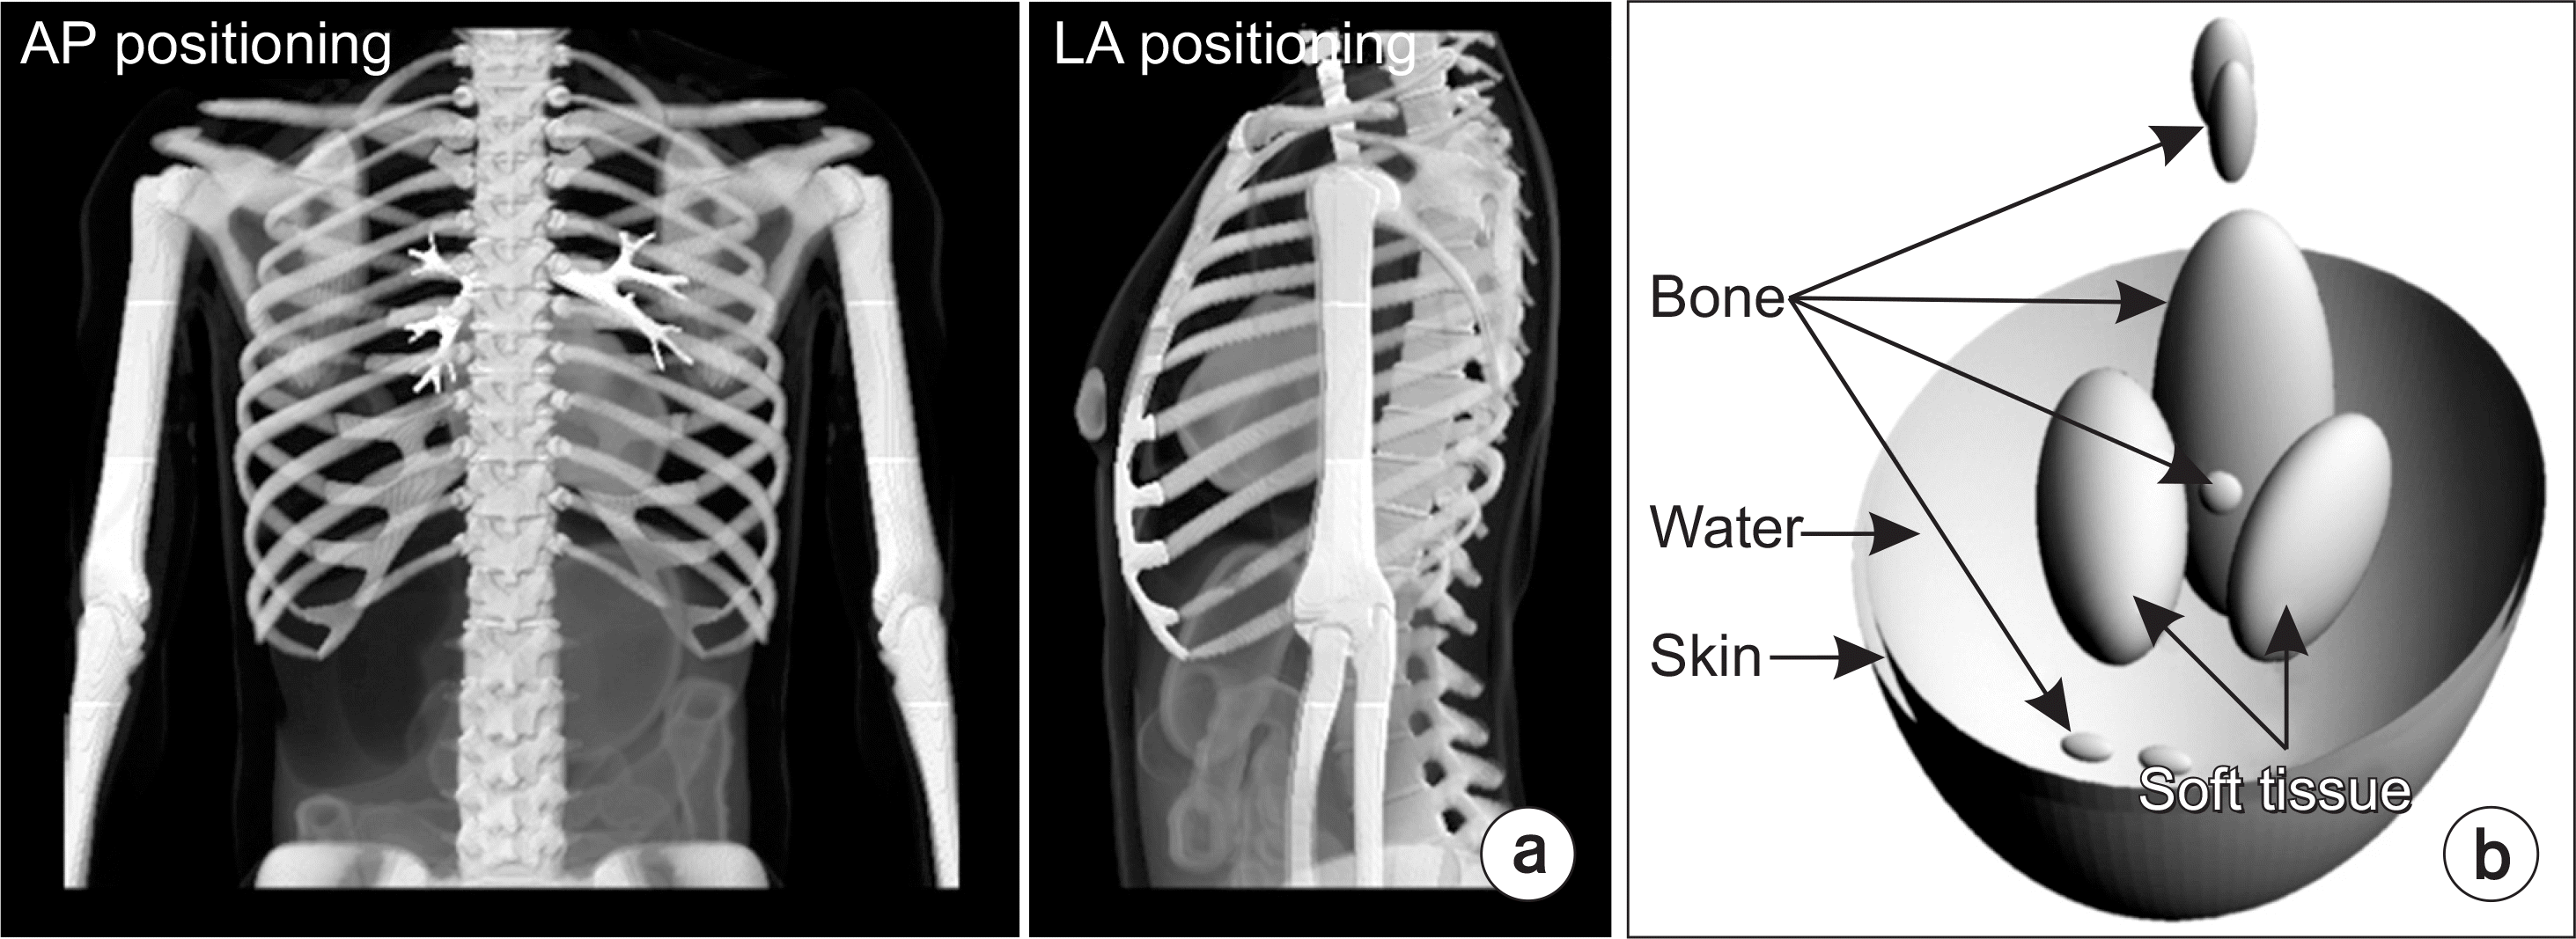
Fig. 6.
Table-top setup established for the experiment. It consists of an x-ray tube (100-mm focal spot size), a focused-linear grid (200-lines/inch strip density), and a CMOS-type flat-panel detector (14.5 cm×11.6 cm active area, 48-mm pixel size).
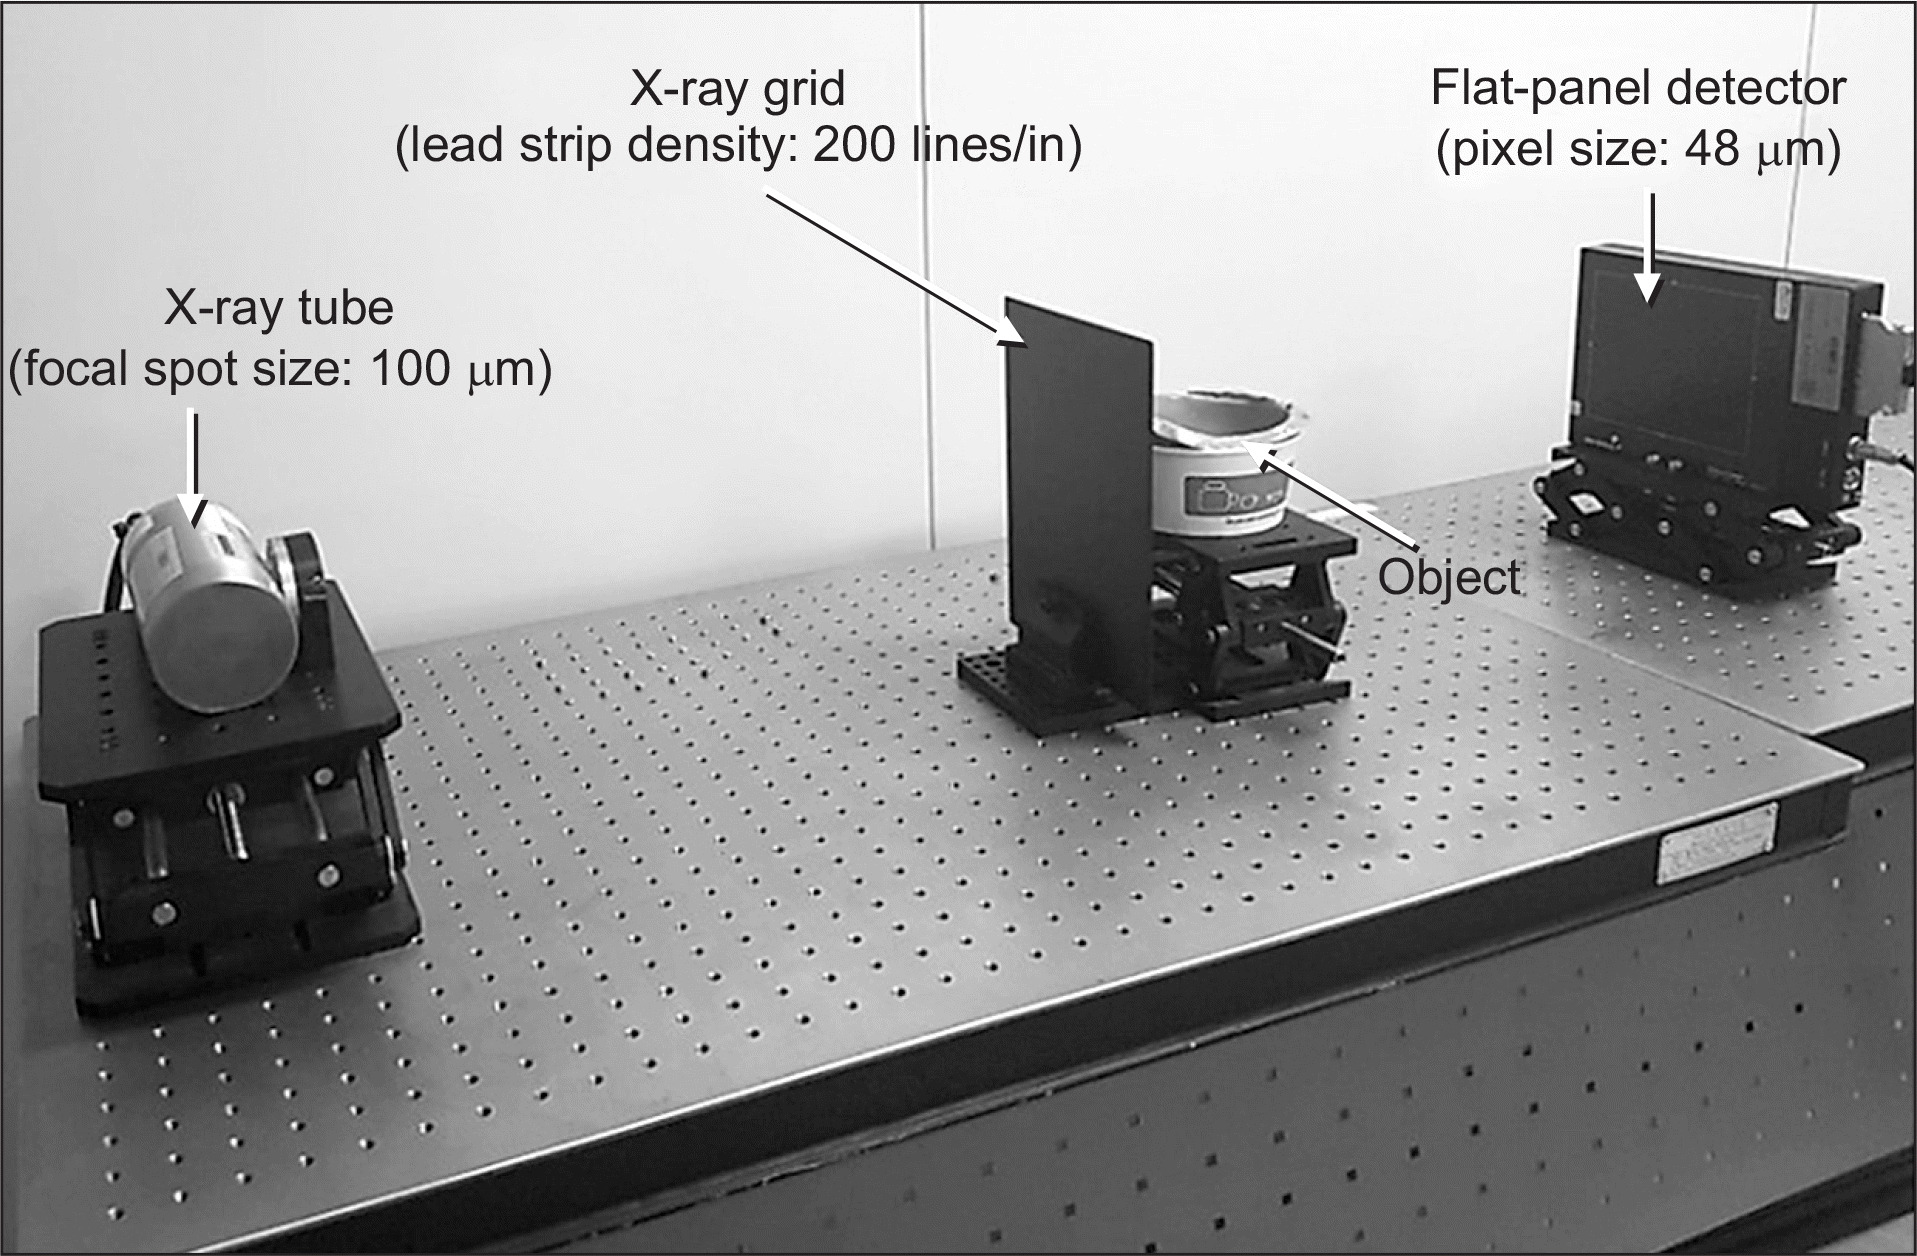
Fig. 7.
The differential phase images of the chest phantom in AP positioning simulated with a vertical grid (top right) and a horizontal grid (bottom left) and their combined image (bottom right). The retrieved absorption image (top left) is also indicated as the reference.
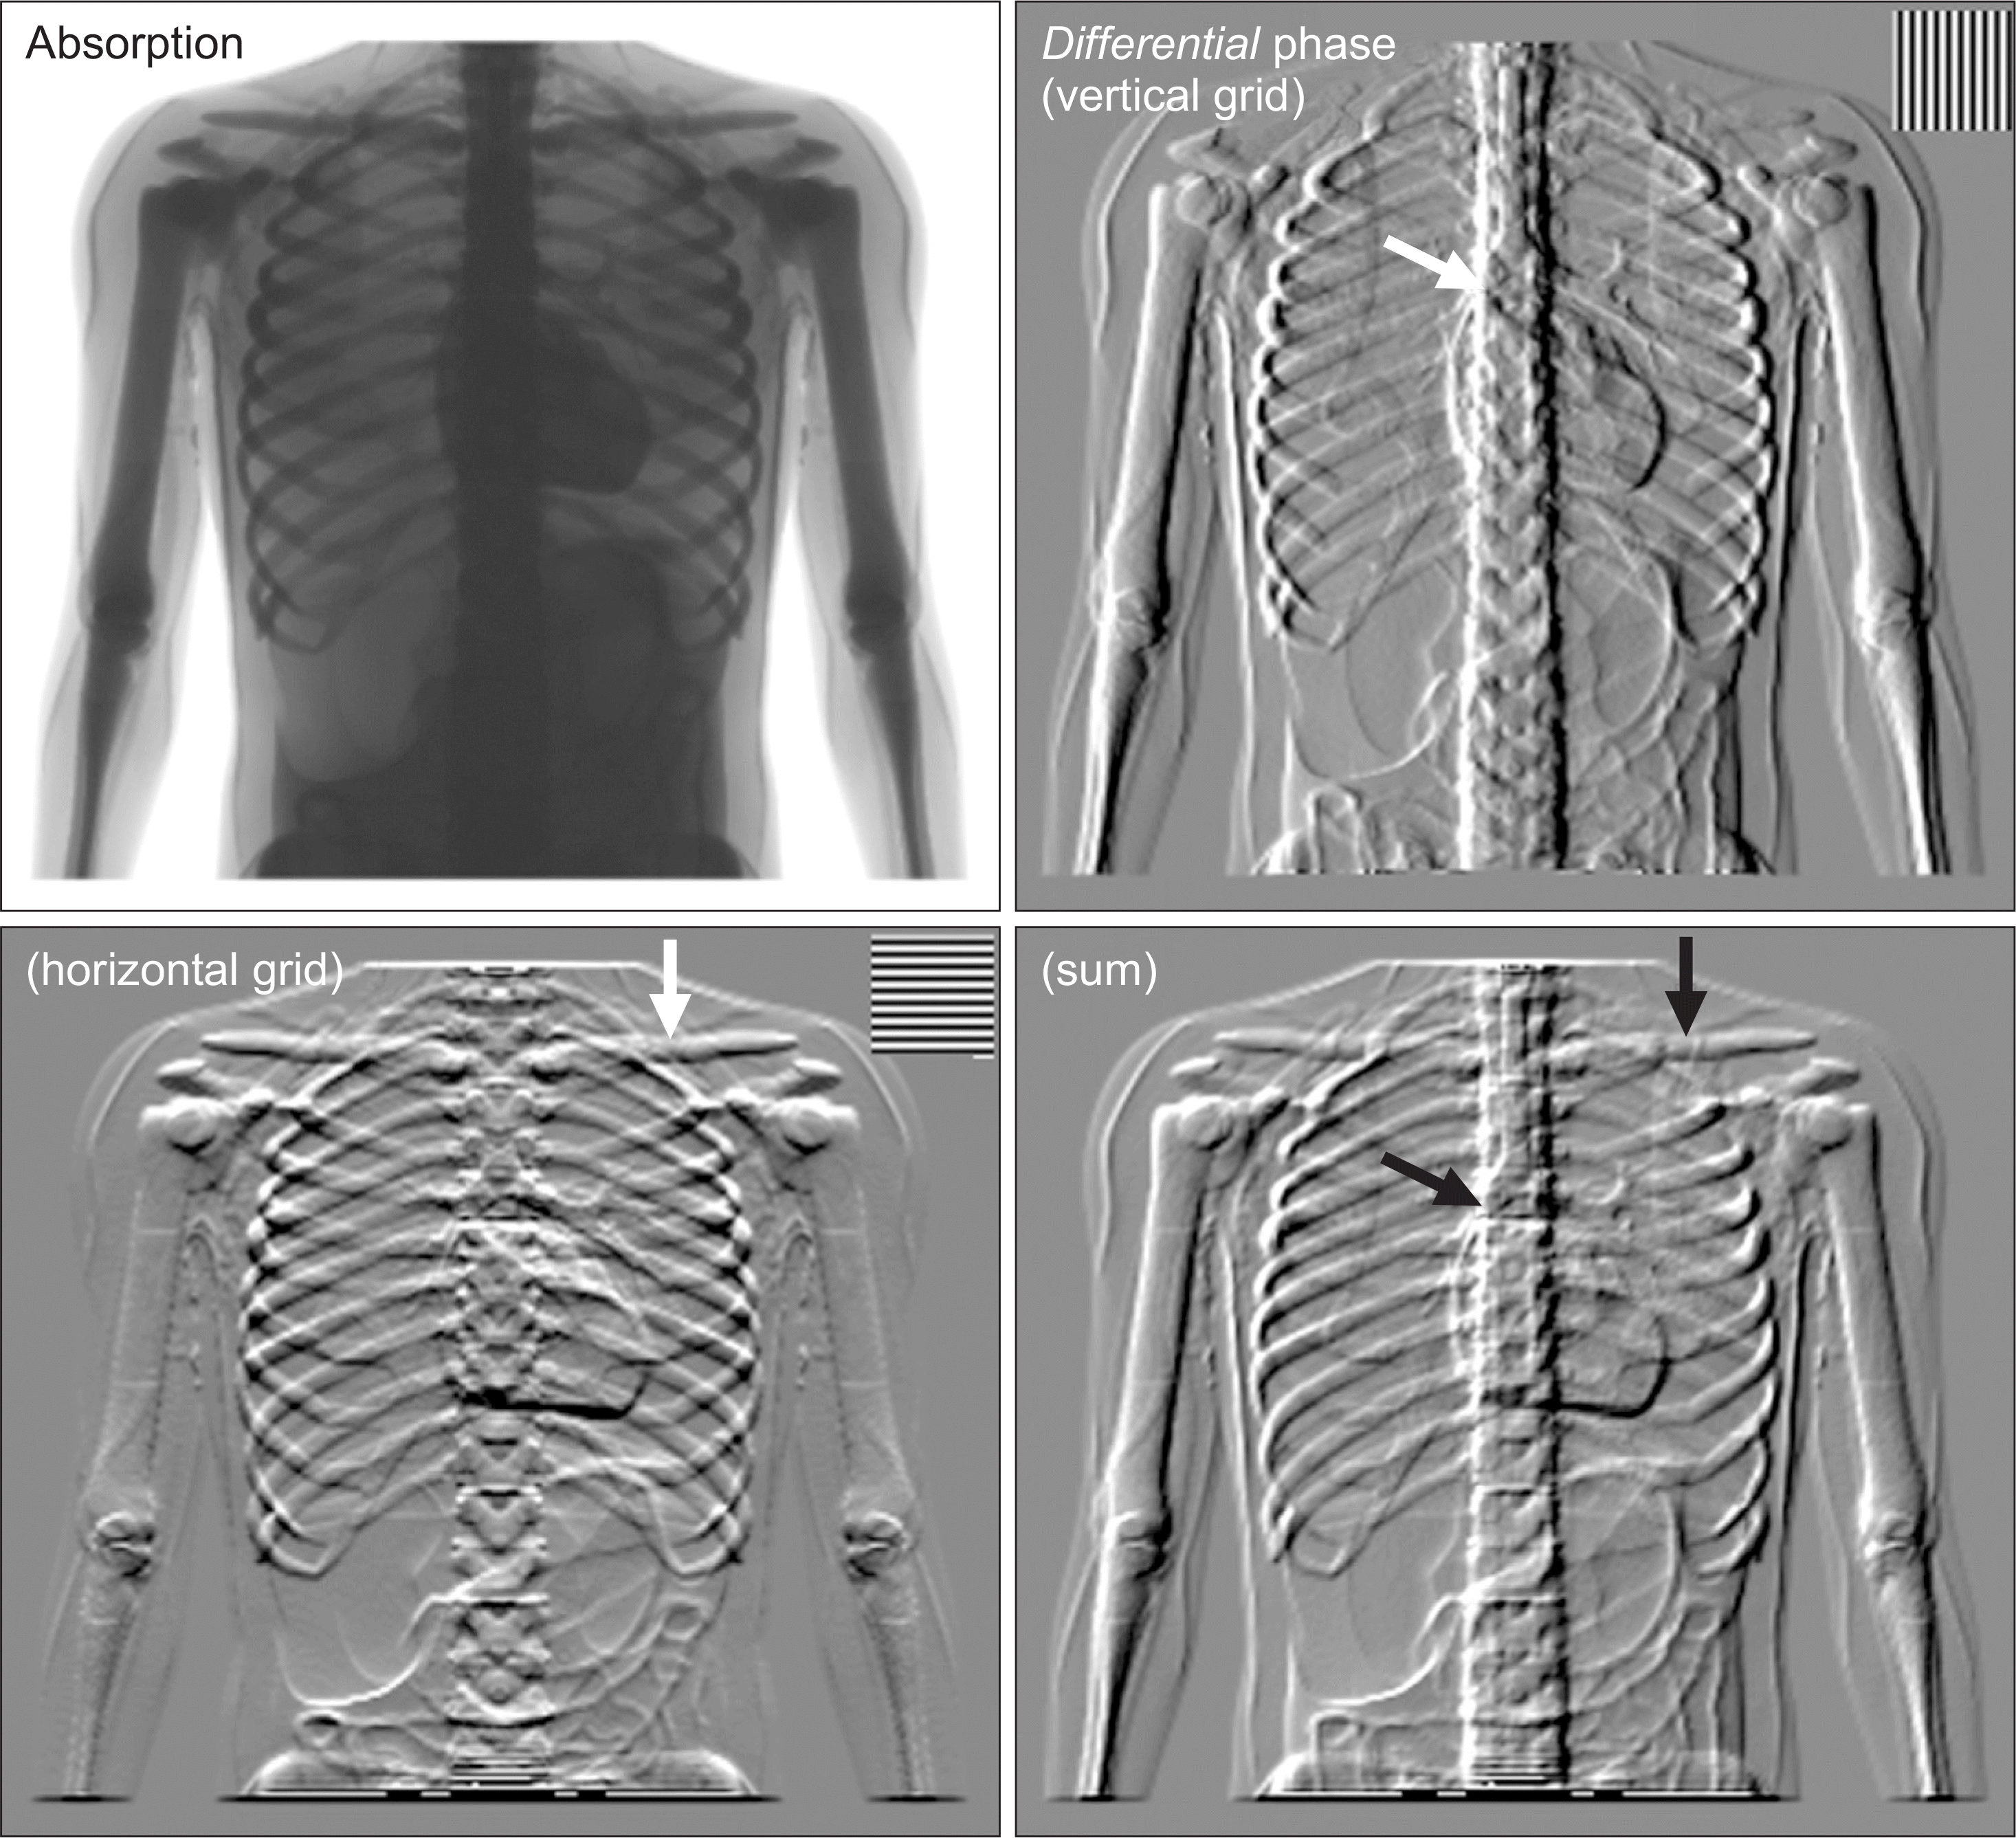
Fig. 8.
The differential phase images of the chest phantom in LA positioning simulated with a vertical grid (top right) and a horizontal grid (bottom left) and their combined image (bottom right). The retrieved absorption image (top left) is also indicated as the reference.
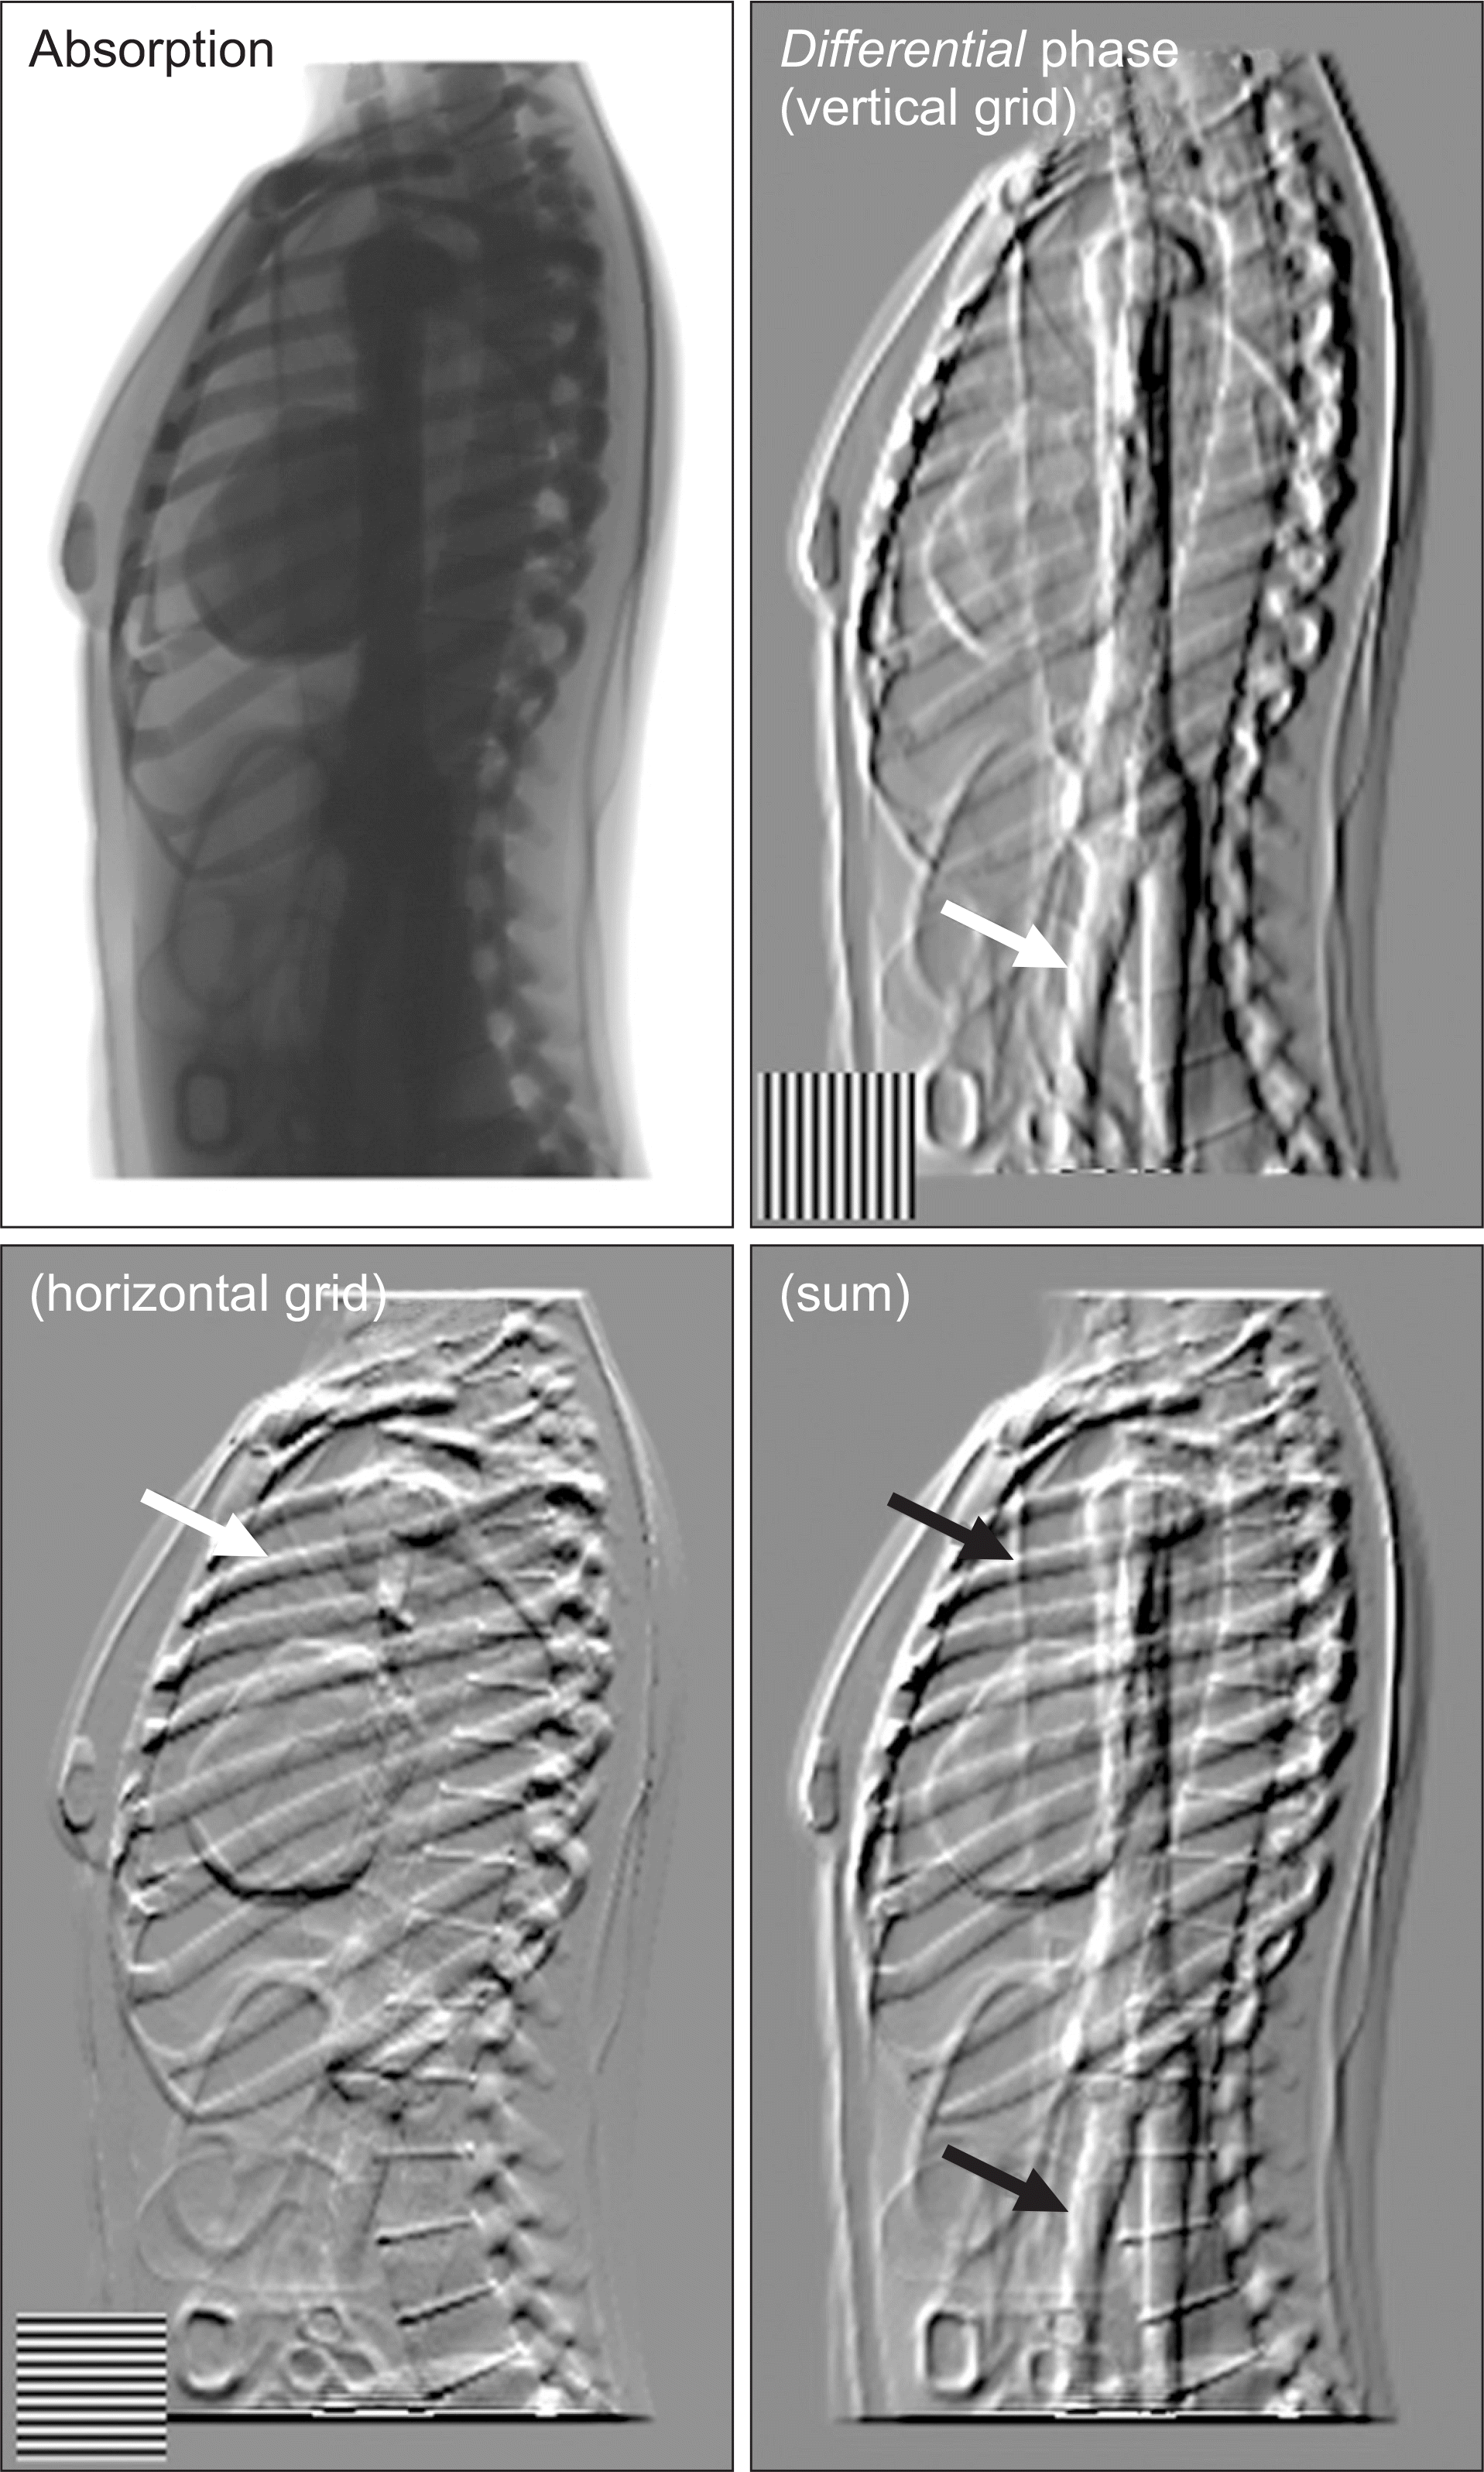
Fig. 9.
The differential phase images of the Shepp-Logan phantom simulated with a vertical grid (top right) and a horizontal grid (bottom left) and their combined image (bottom right). The retrieved absorption image (top left) is also indicated as the reference.
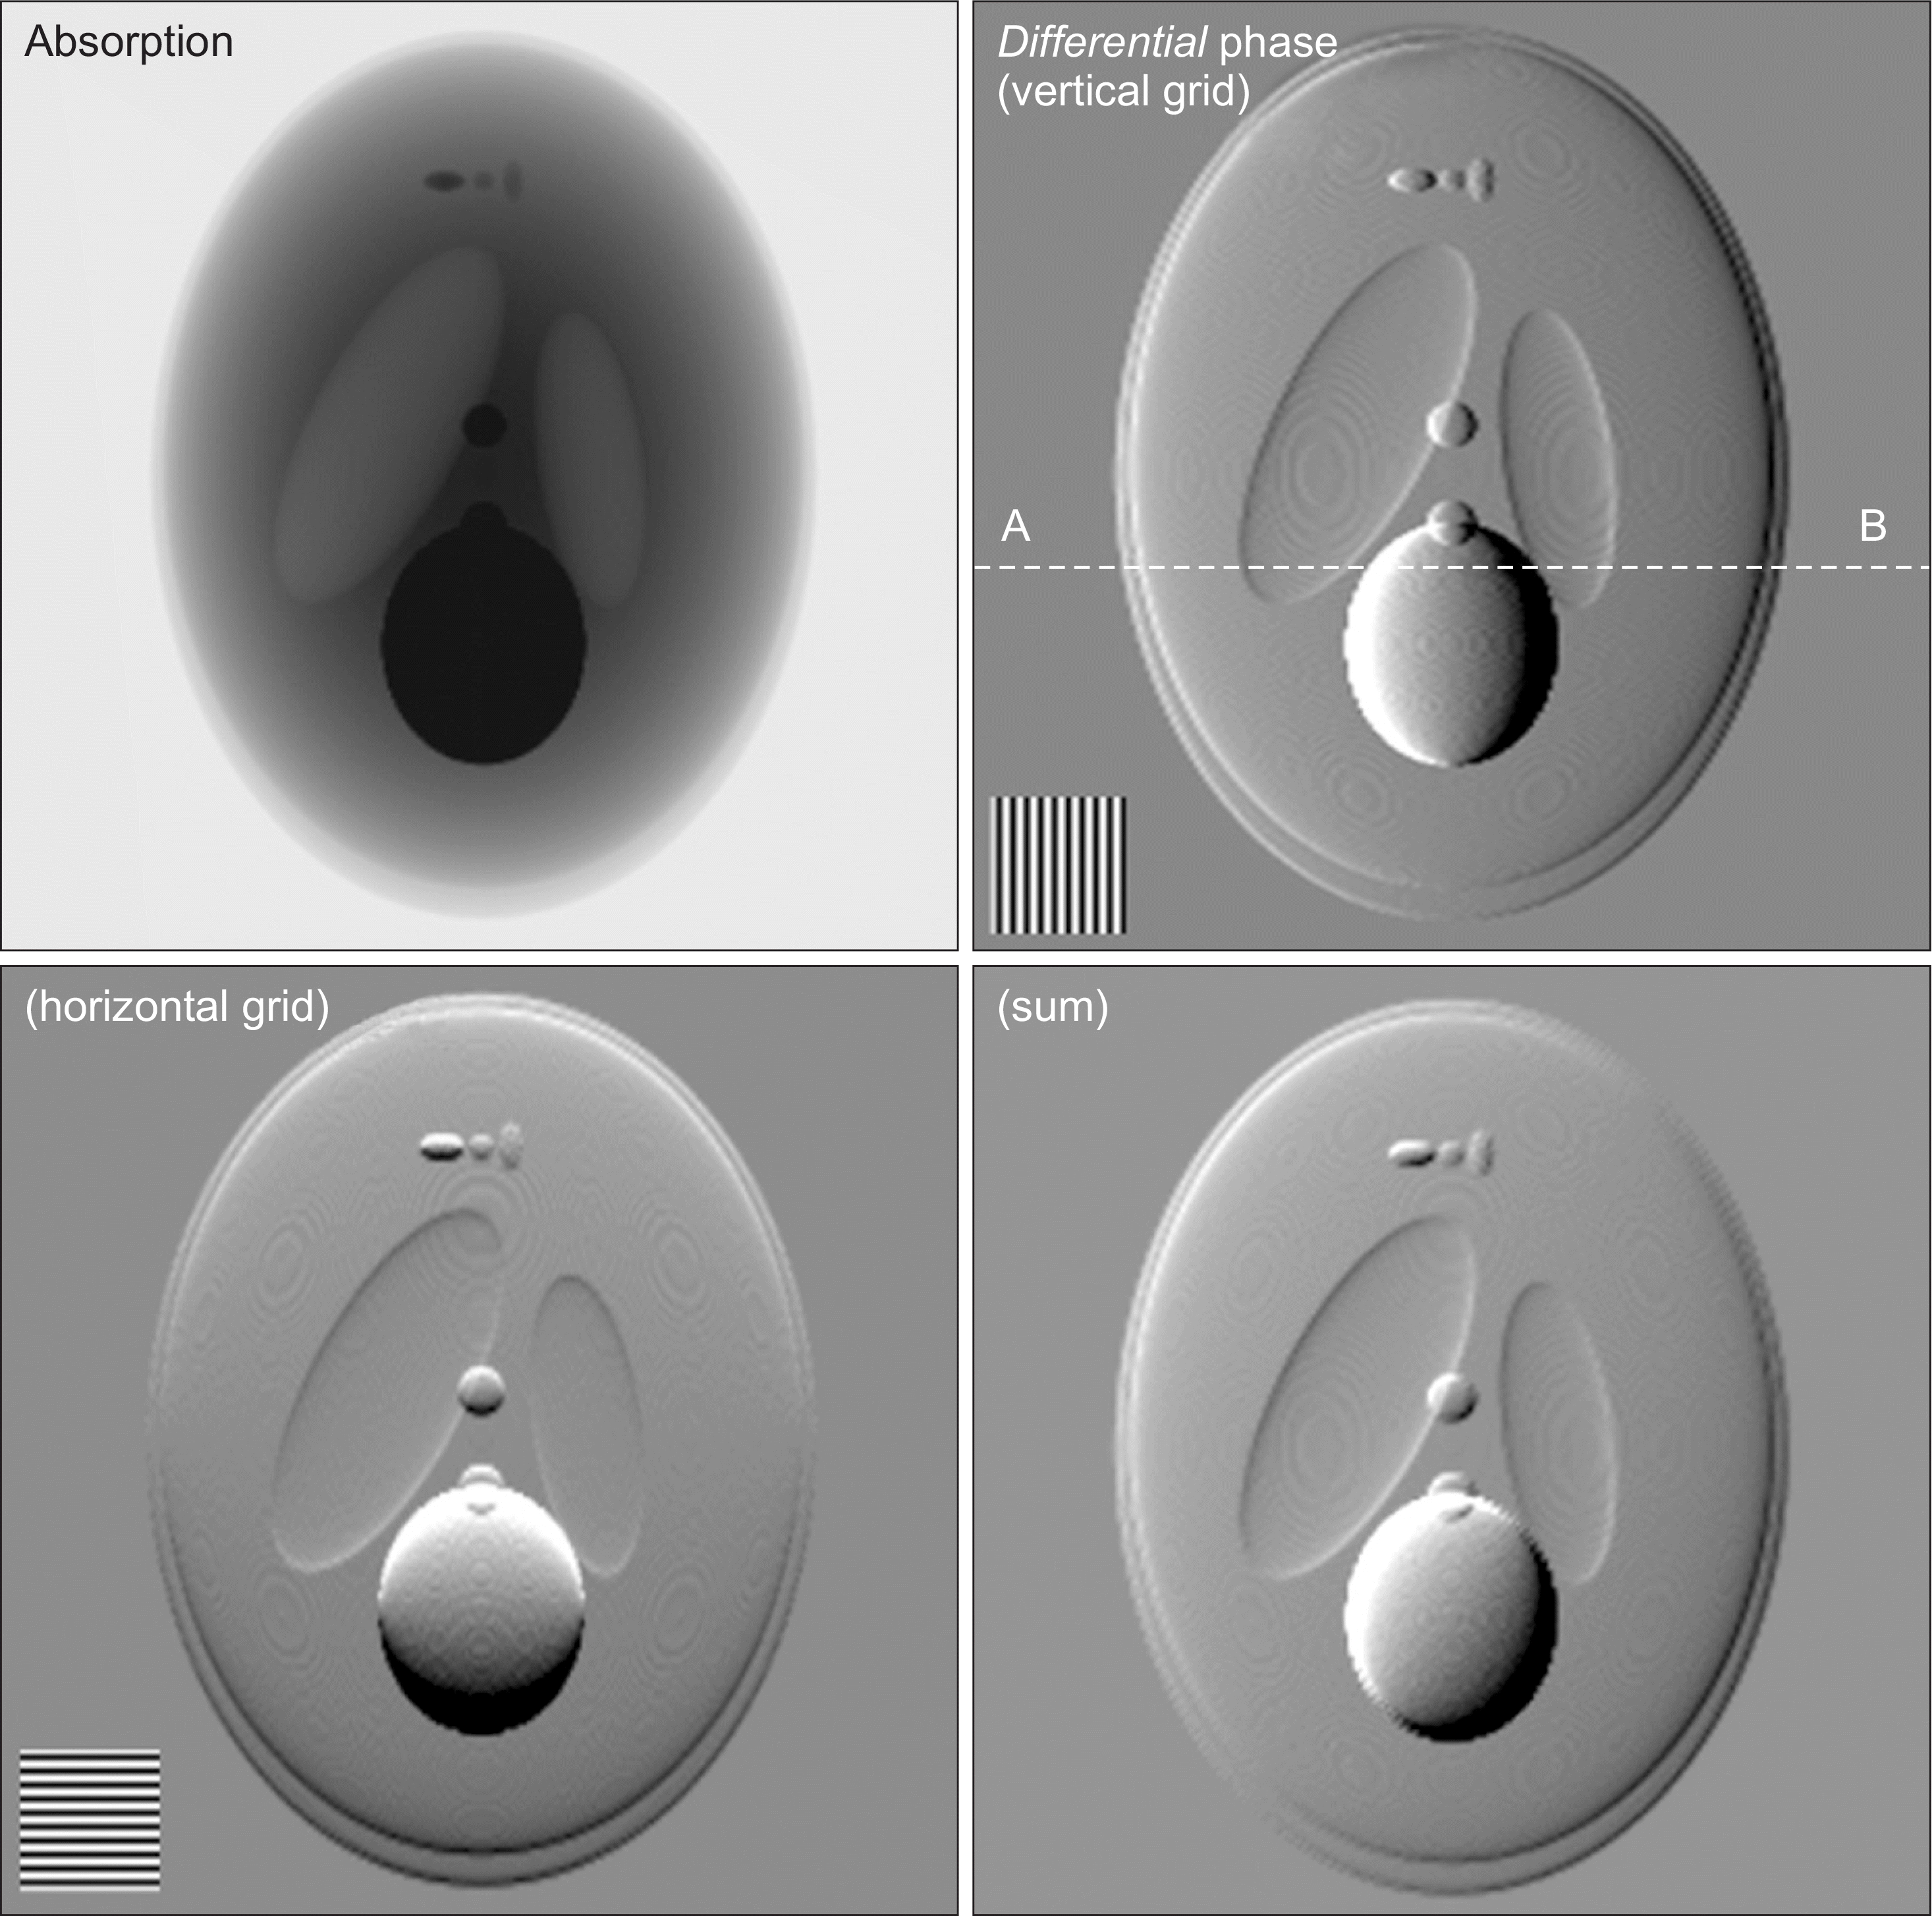
Fig. 10.
Intensity profiles measured along the line segments AB indicated in Fig. 9 for the differential phase image and the absorption image of the Shepp-Logan phantom.
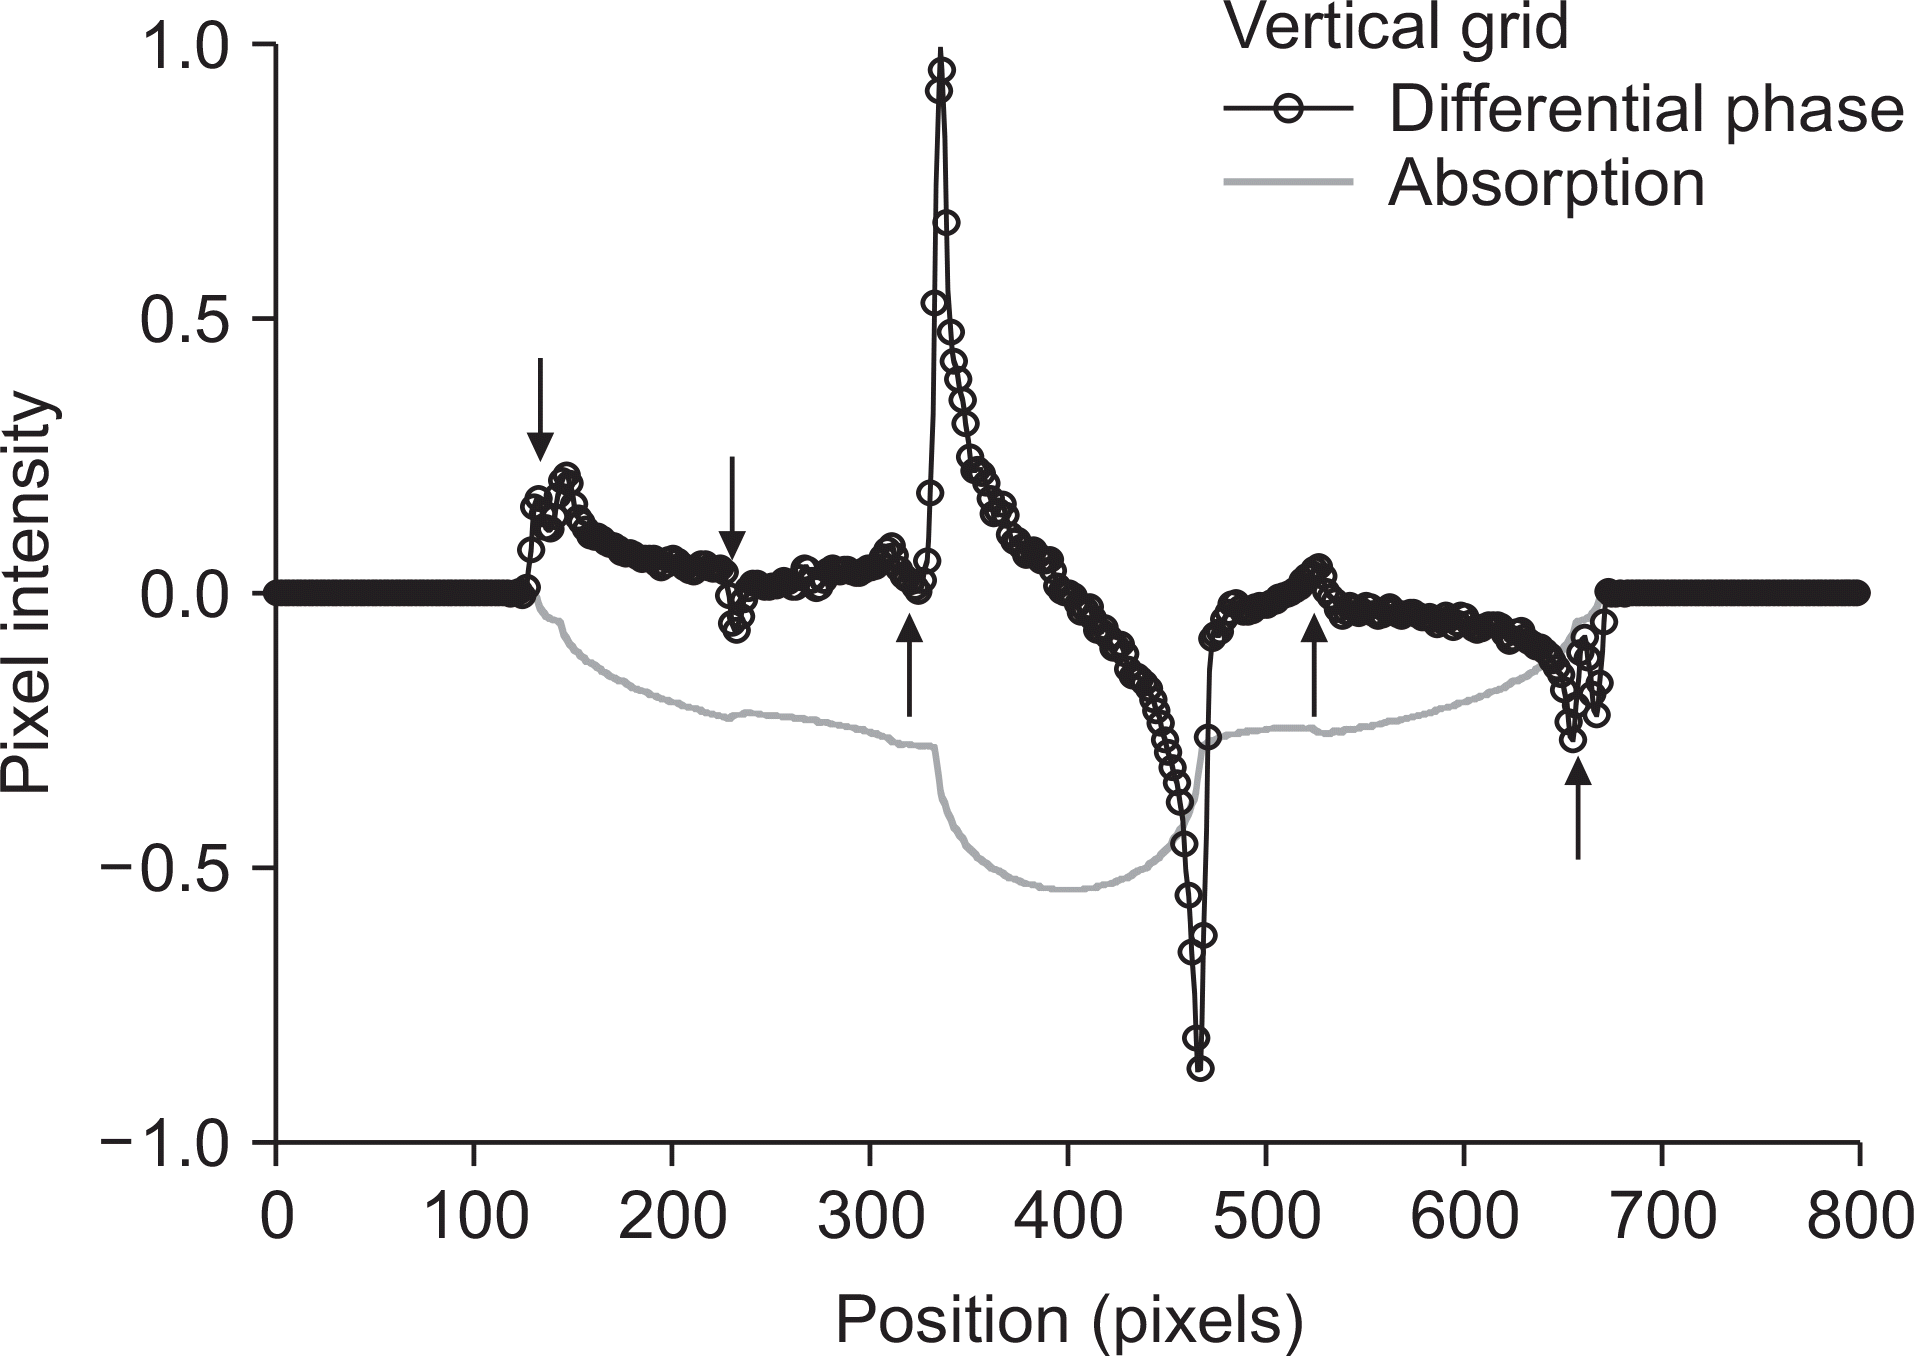
Fig. 11.
Complete sets of the PCXI results retrieved from a single raw image of (a) animal bone and (b) chicken wing with a 200-lines/inch vertical grid obtained at the given x-ray tube conditions of 50 kVp and 5 mAs.
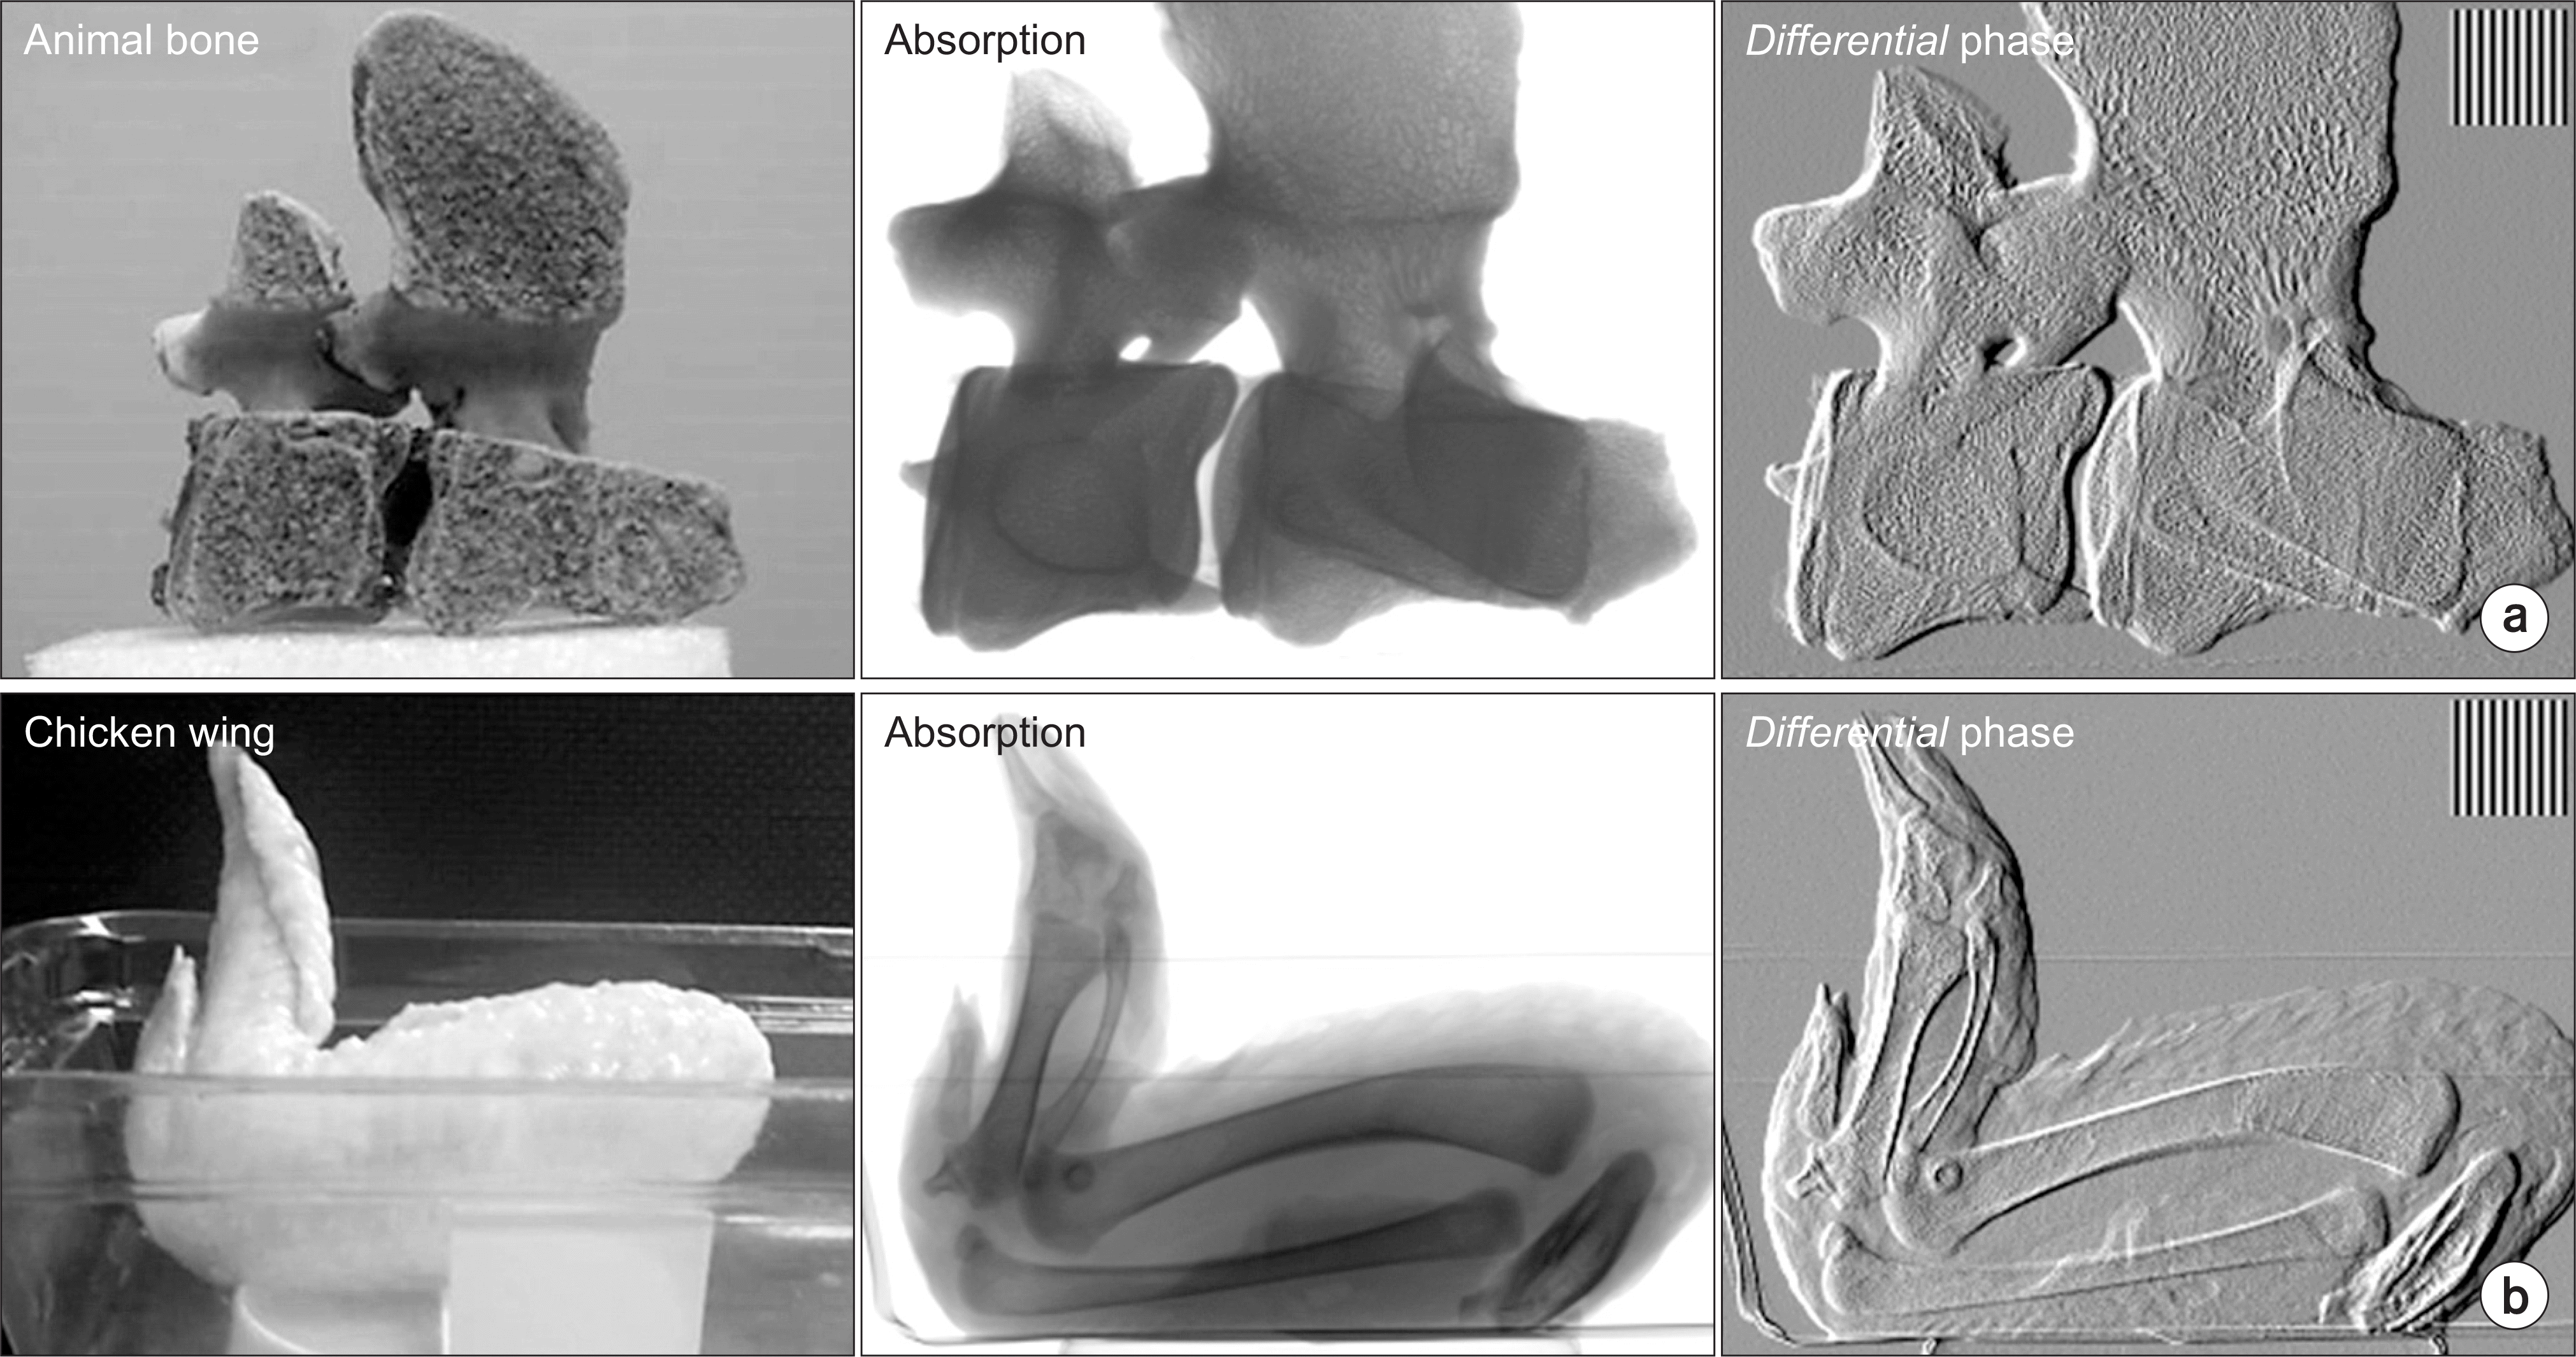
Table 1.
Imaging acquisition conditions used in the simulation and the experiment.
 XML Download