Abstract
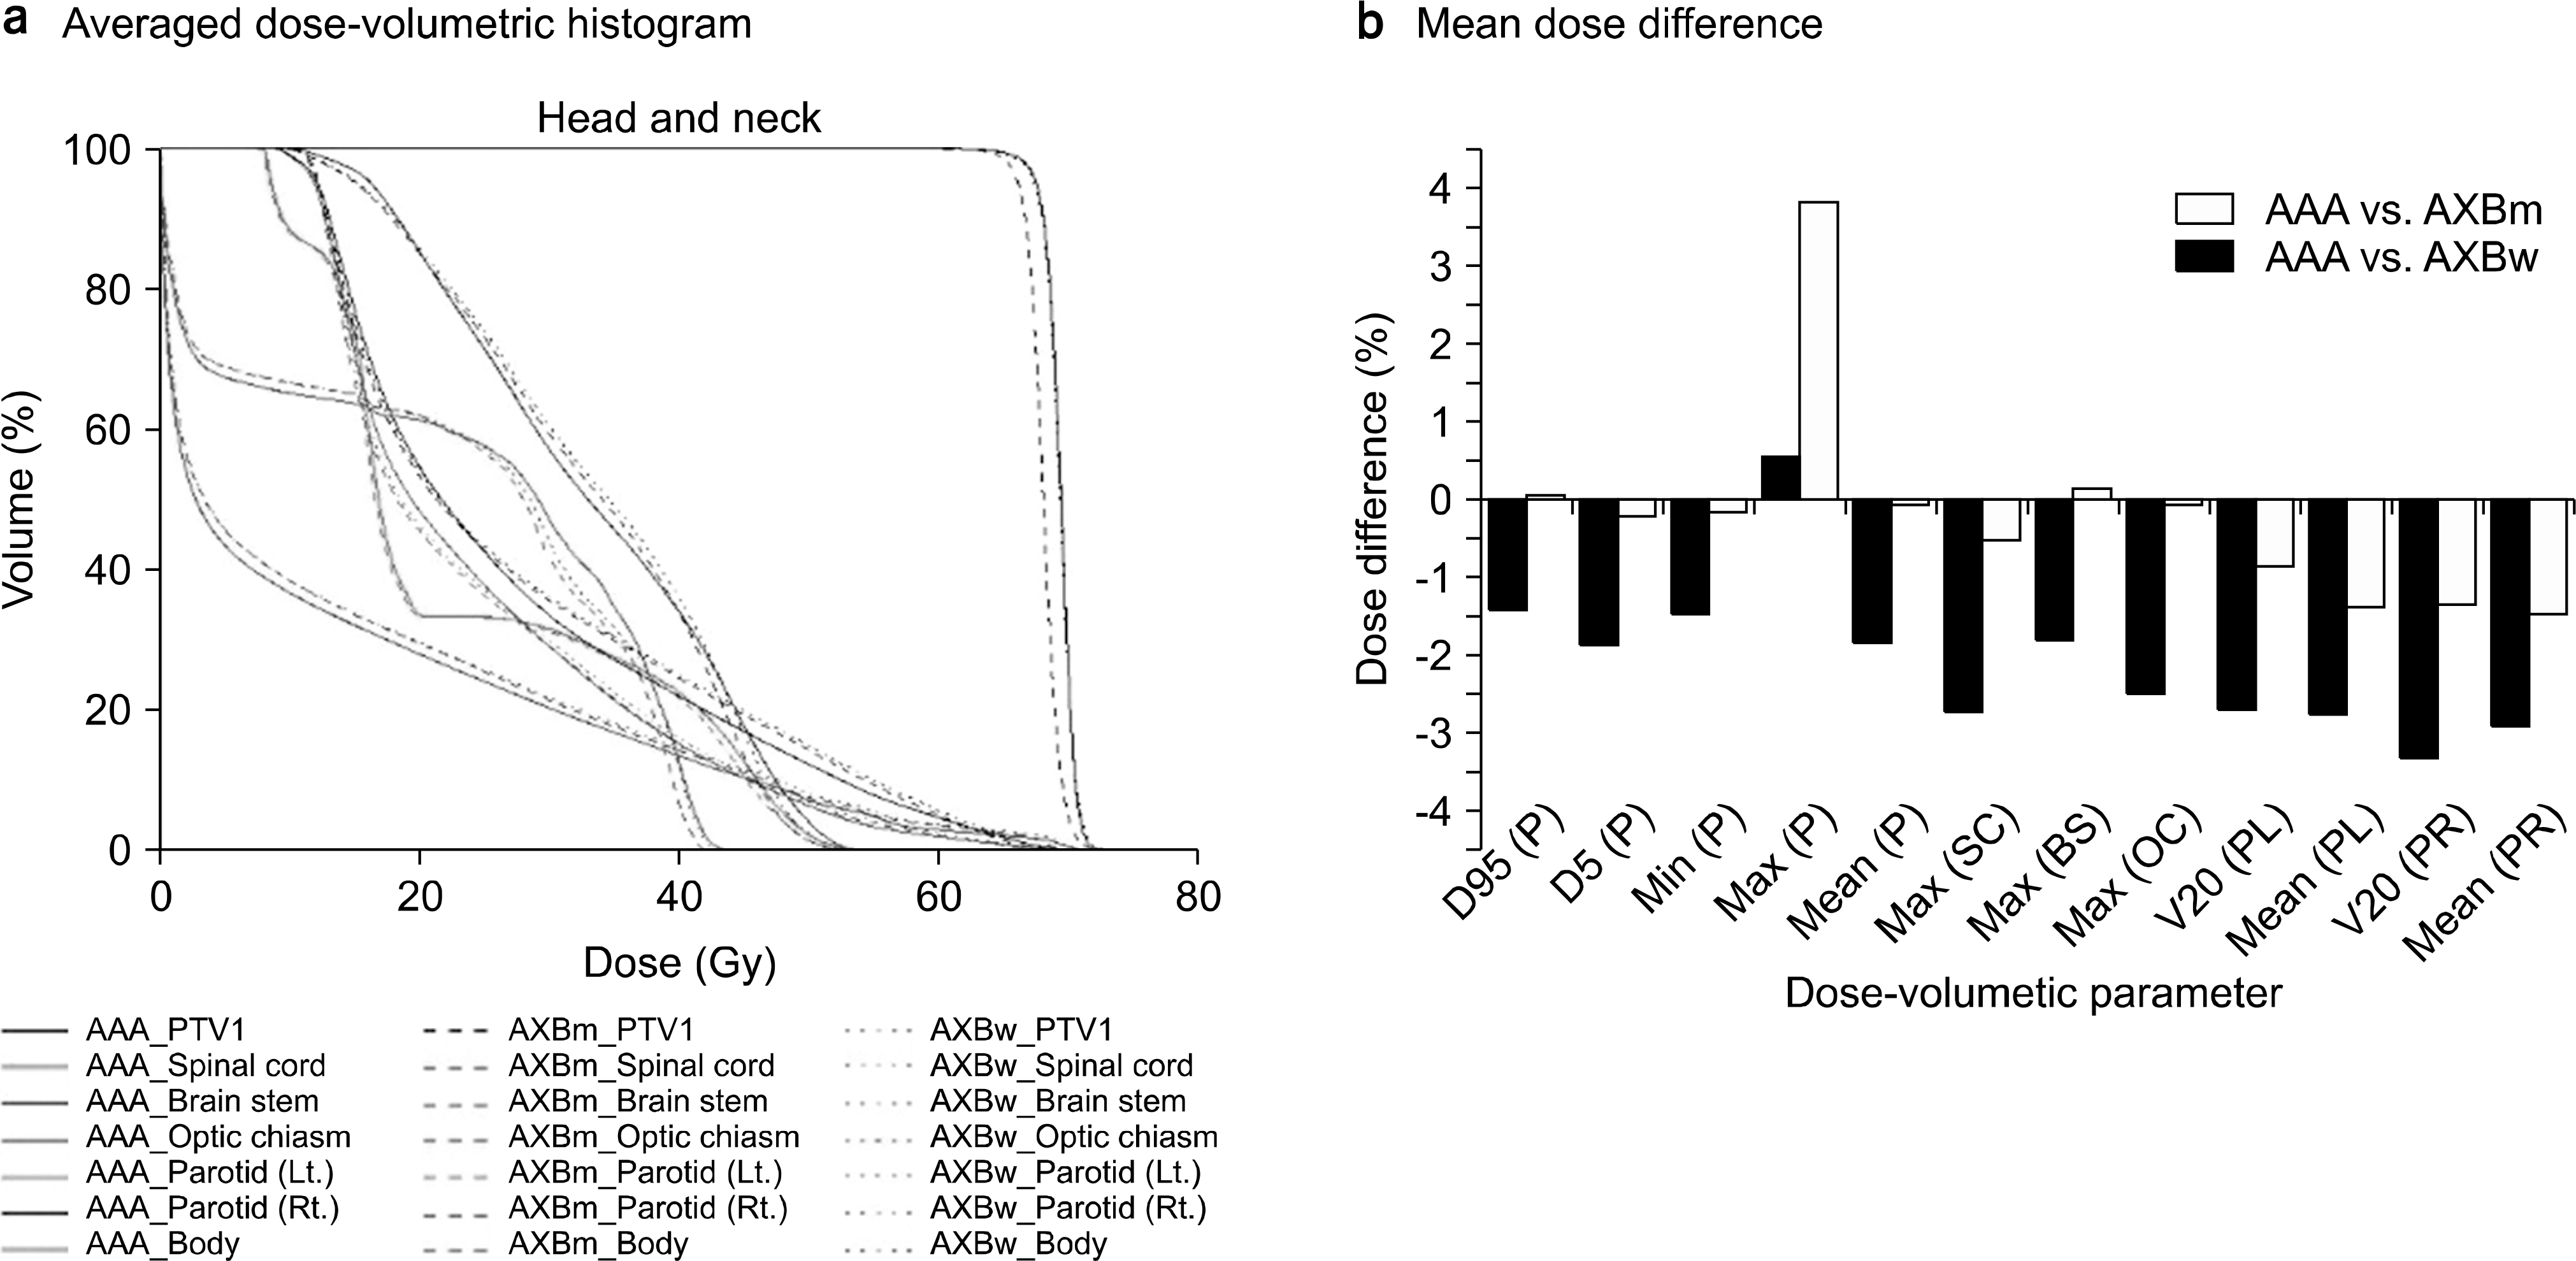
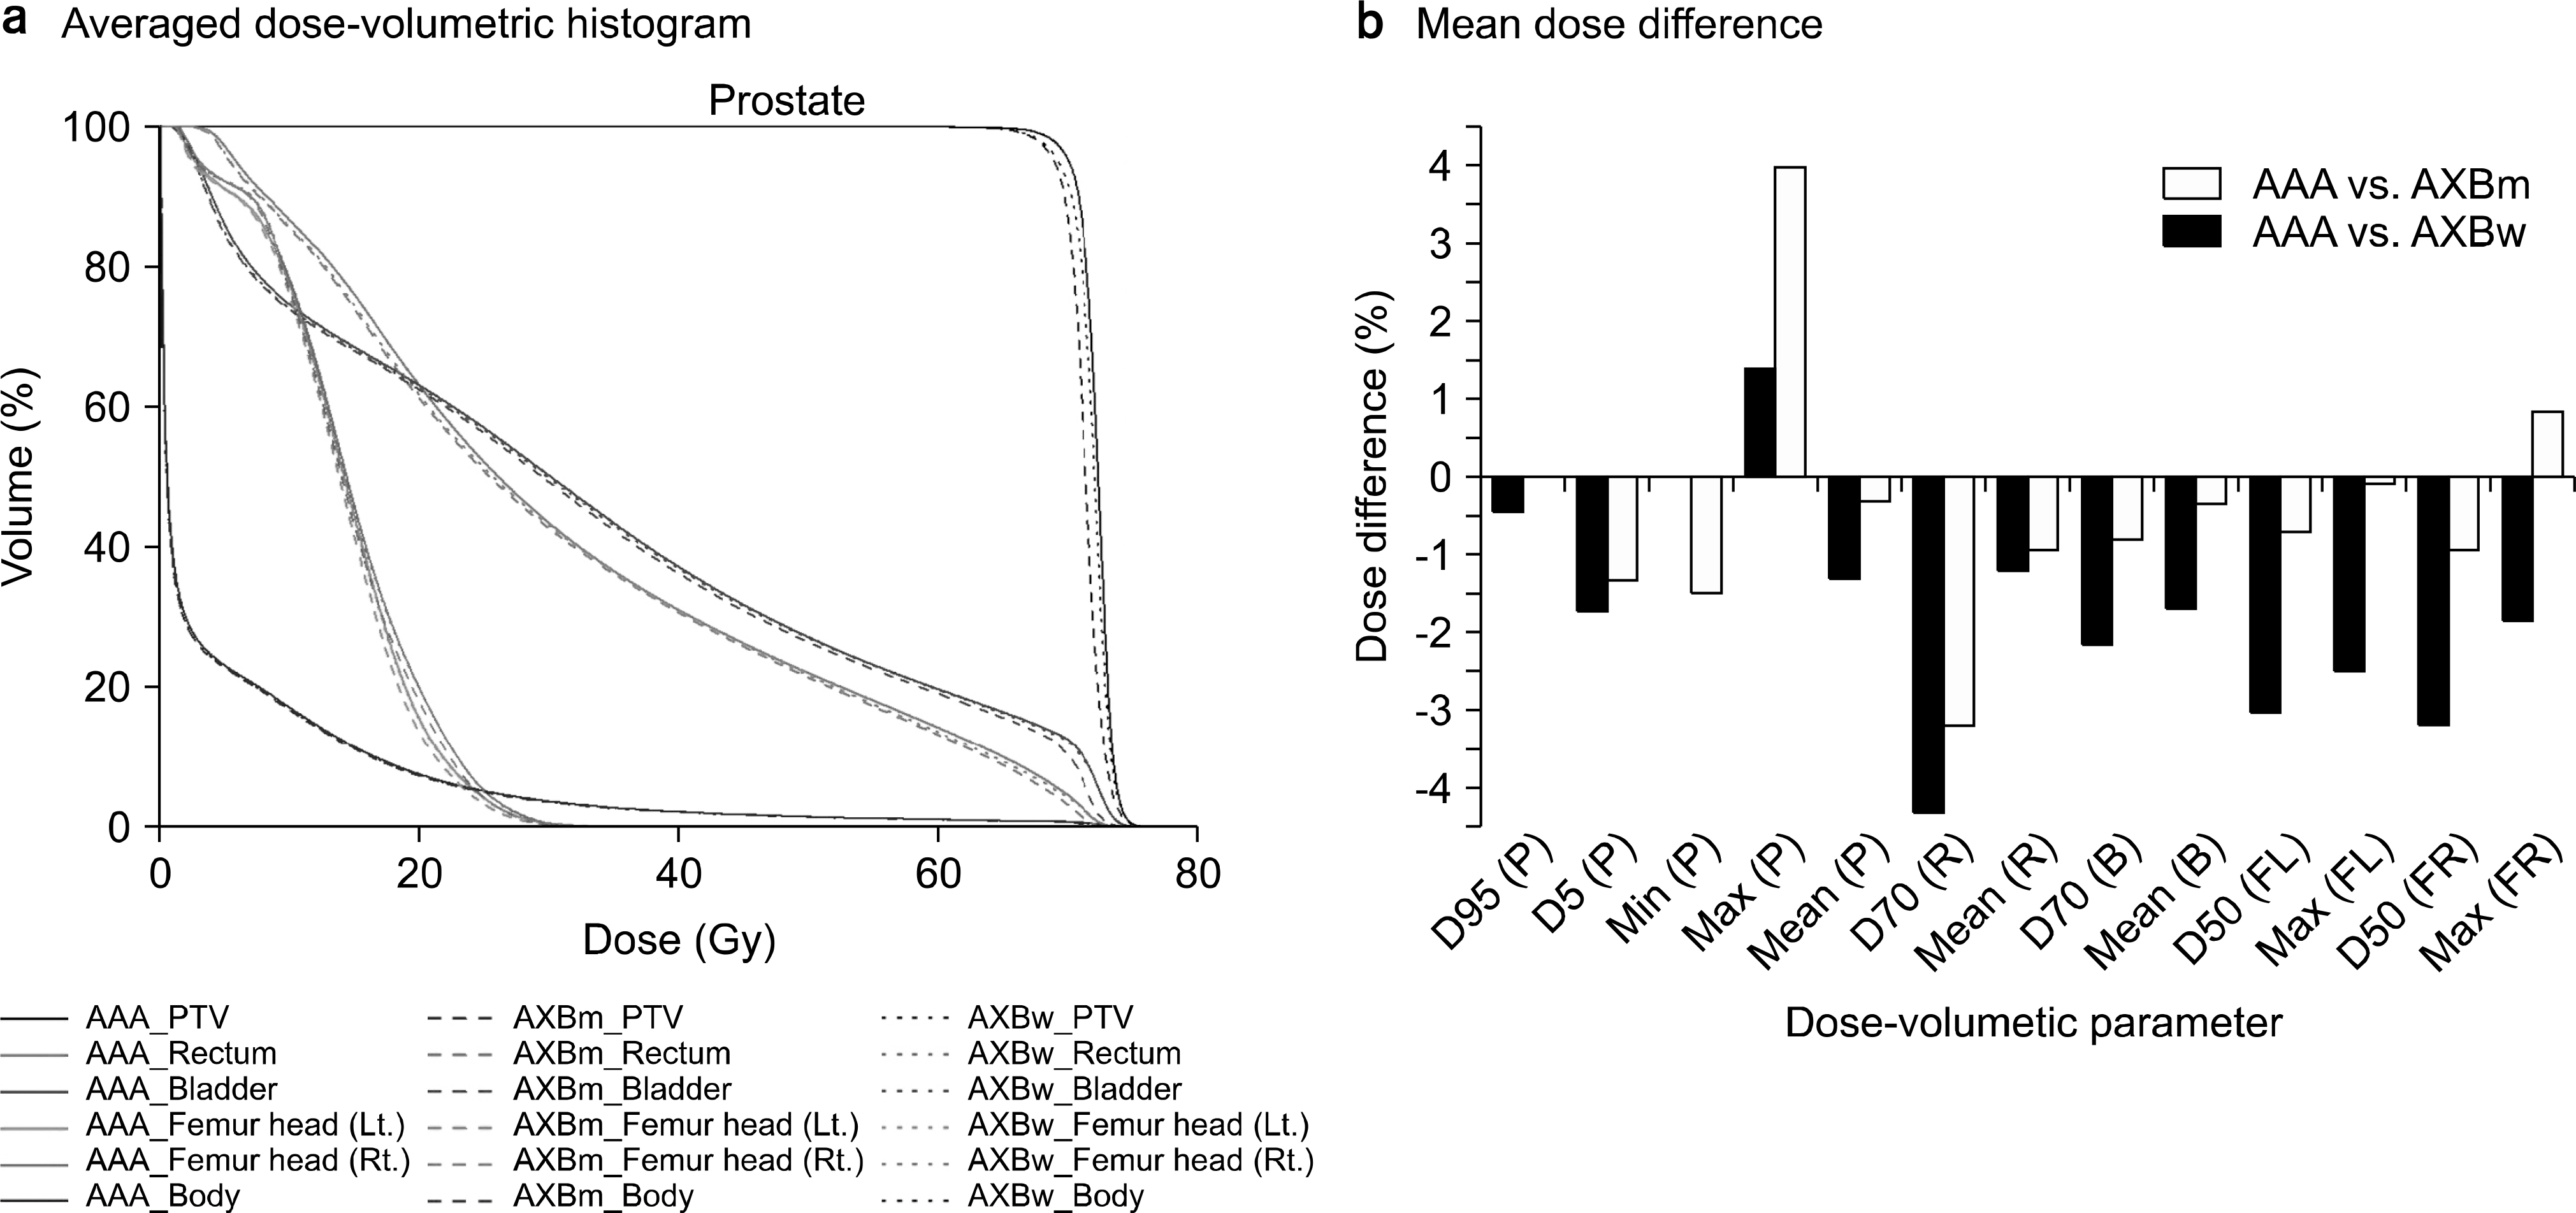
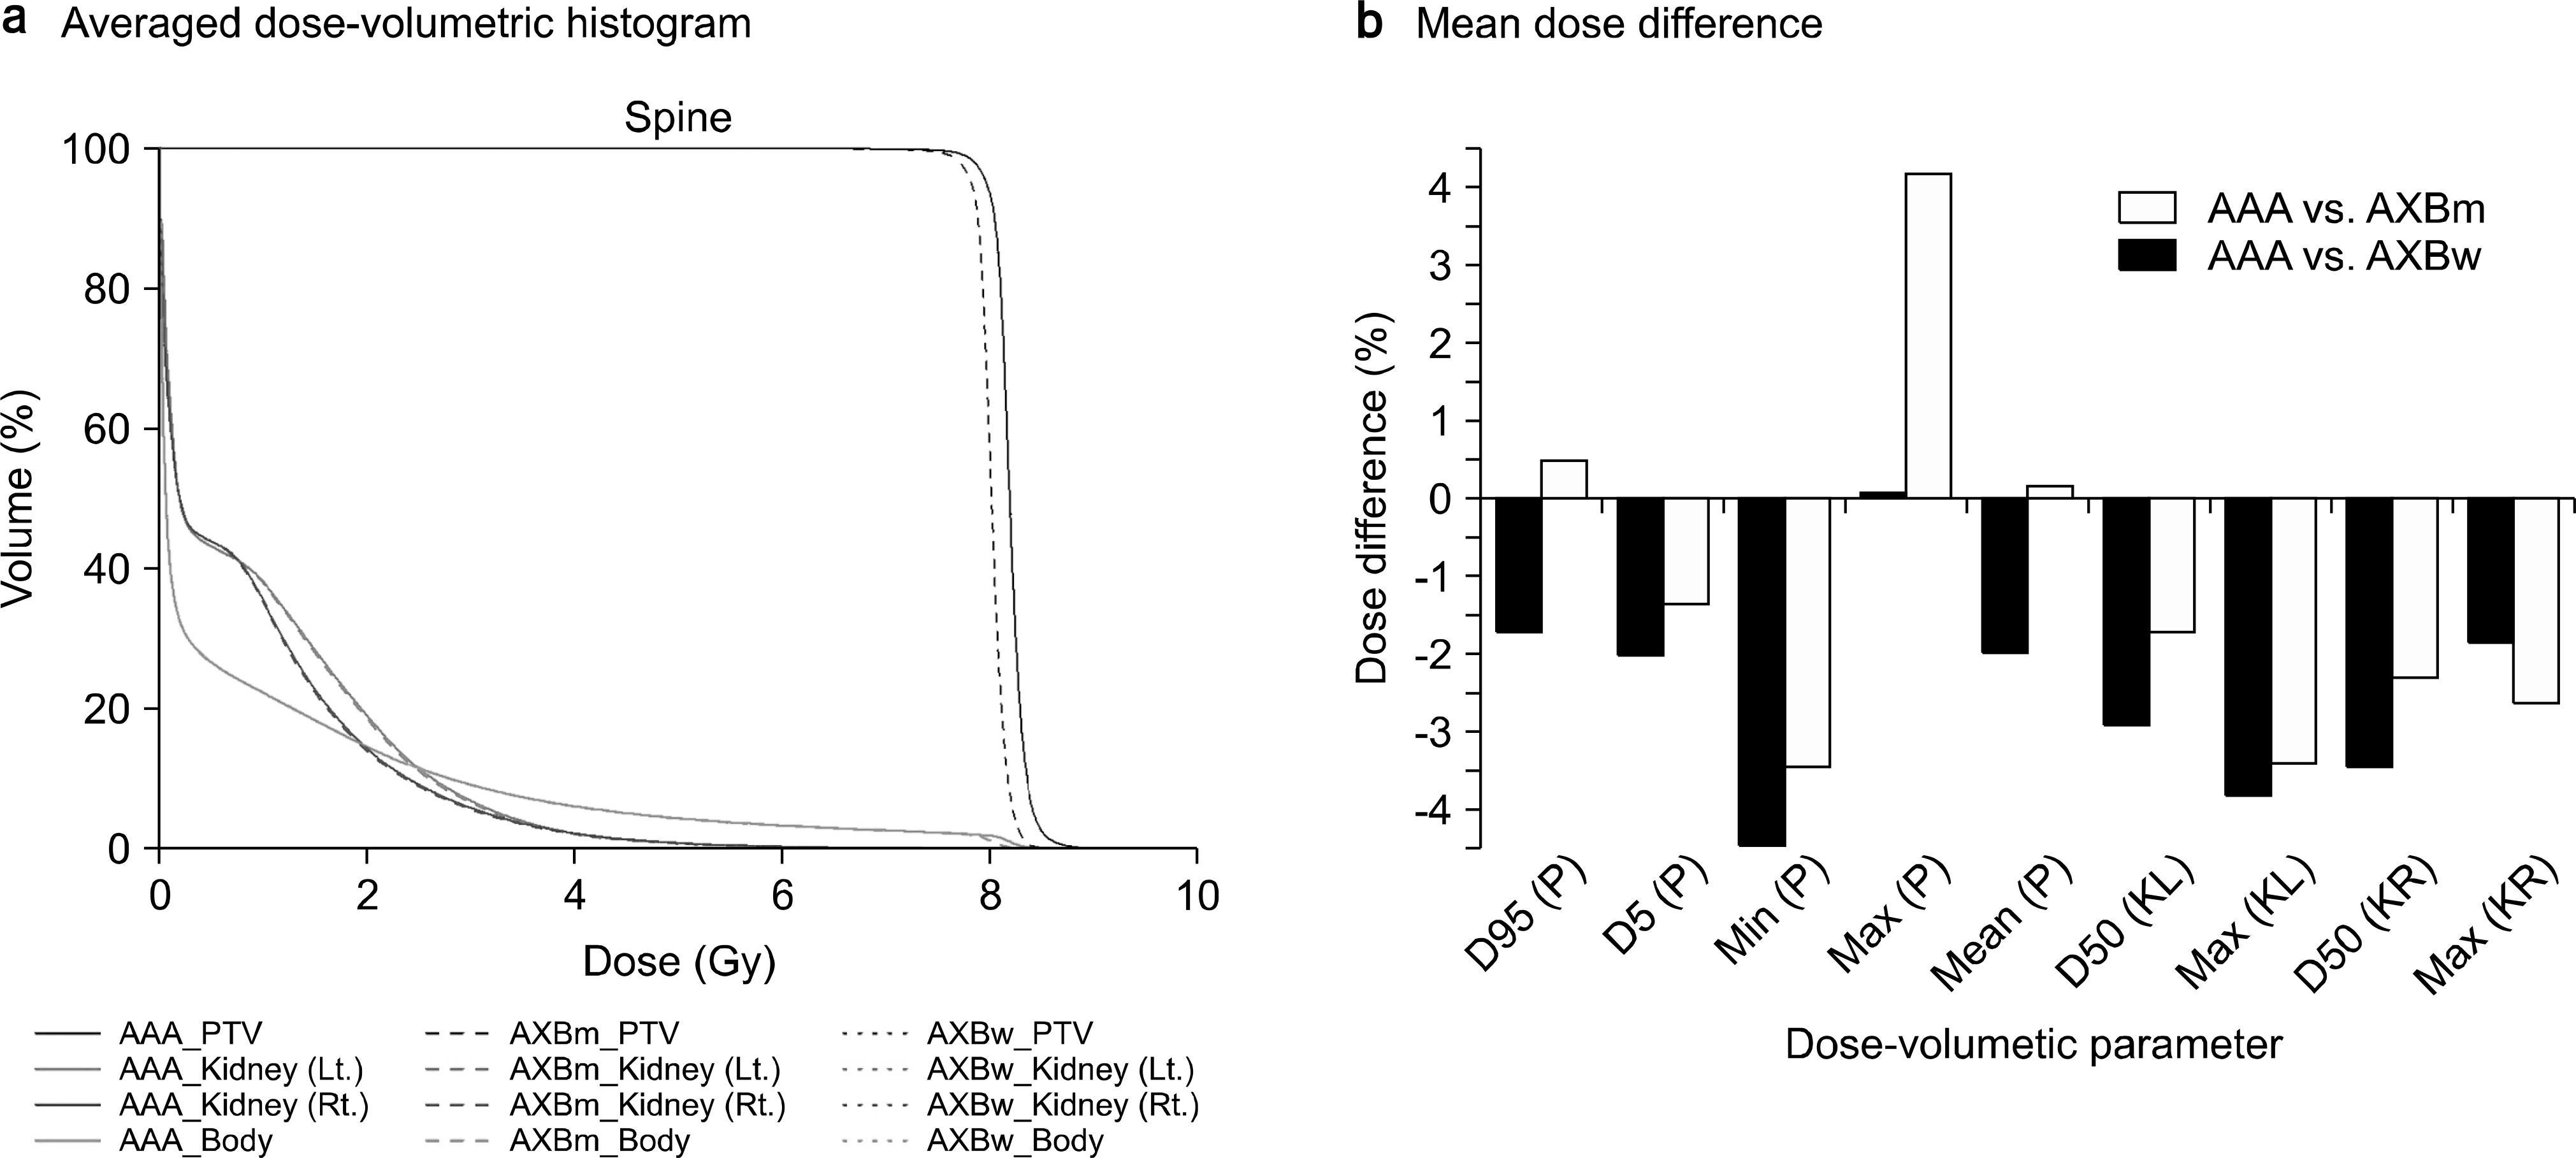
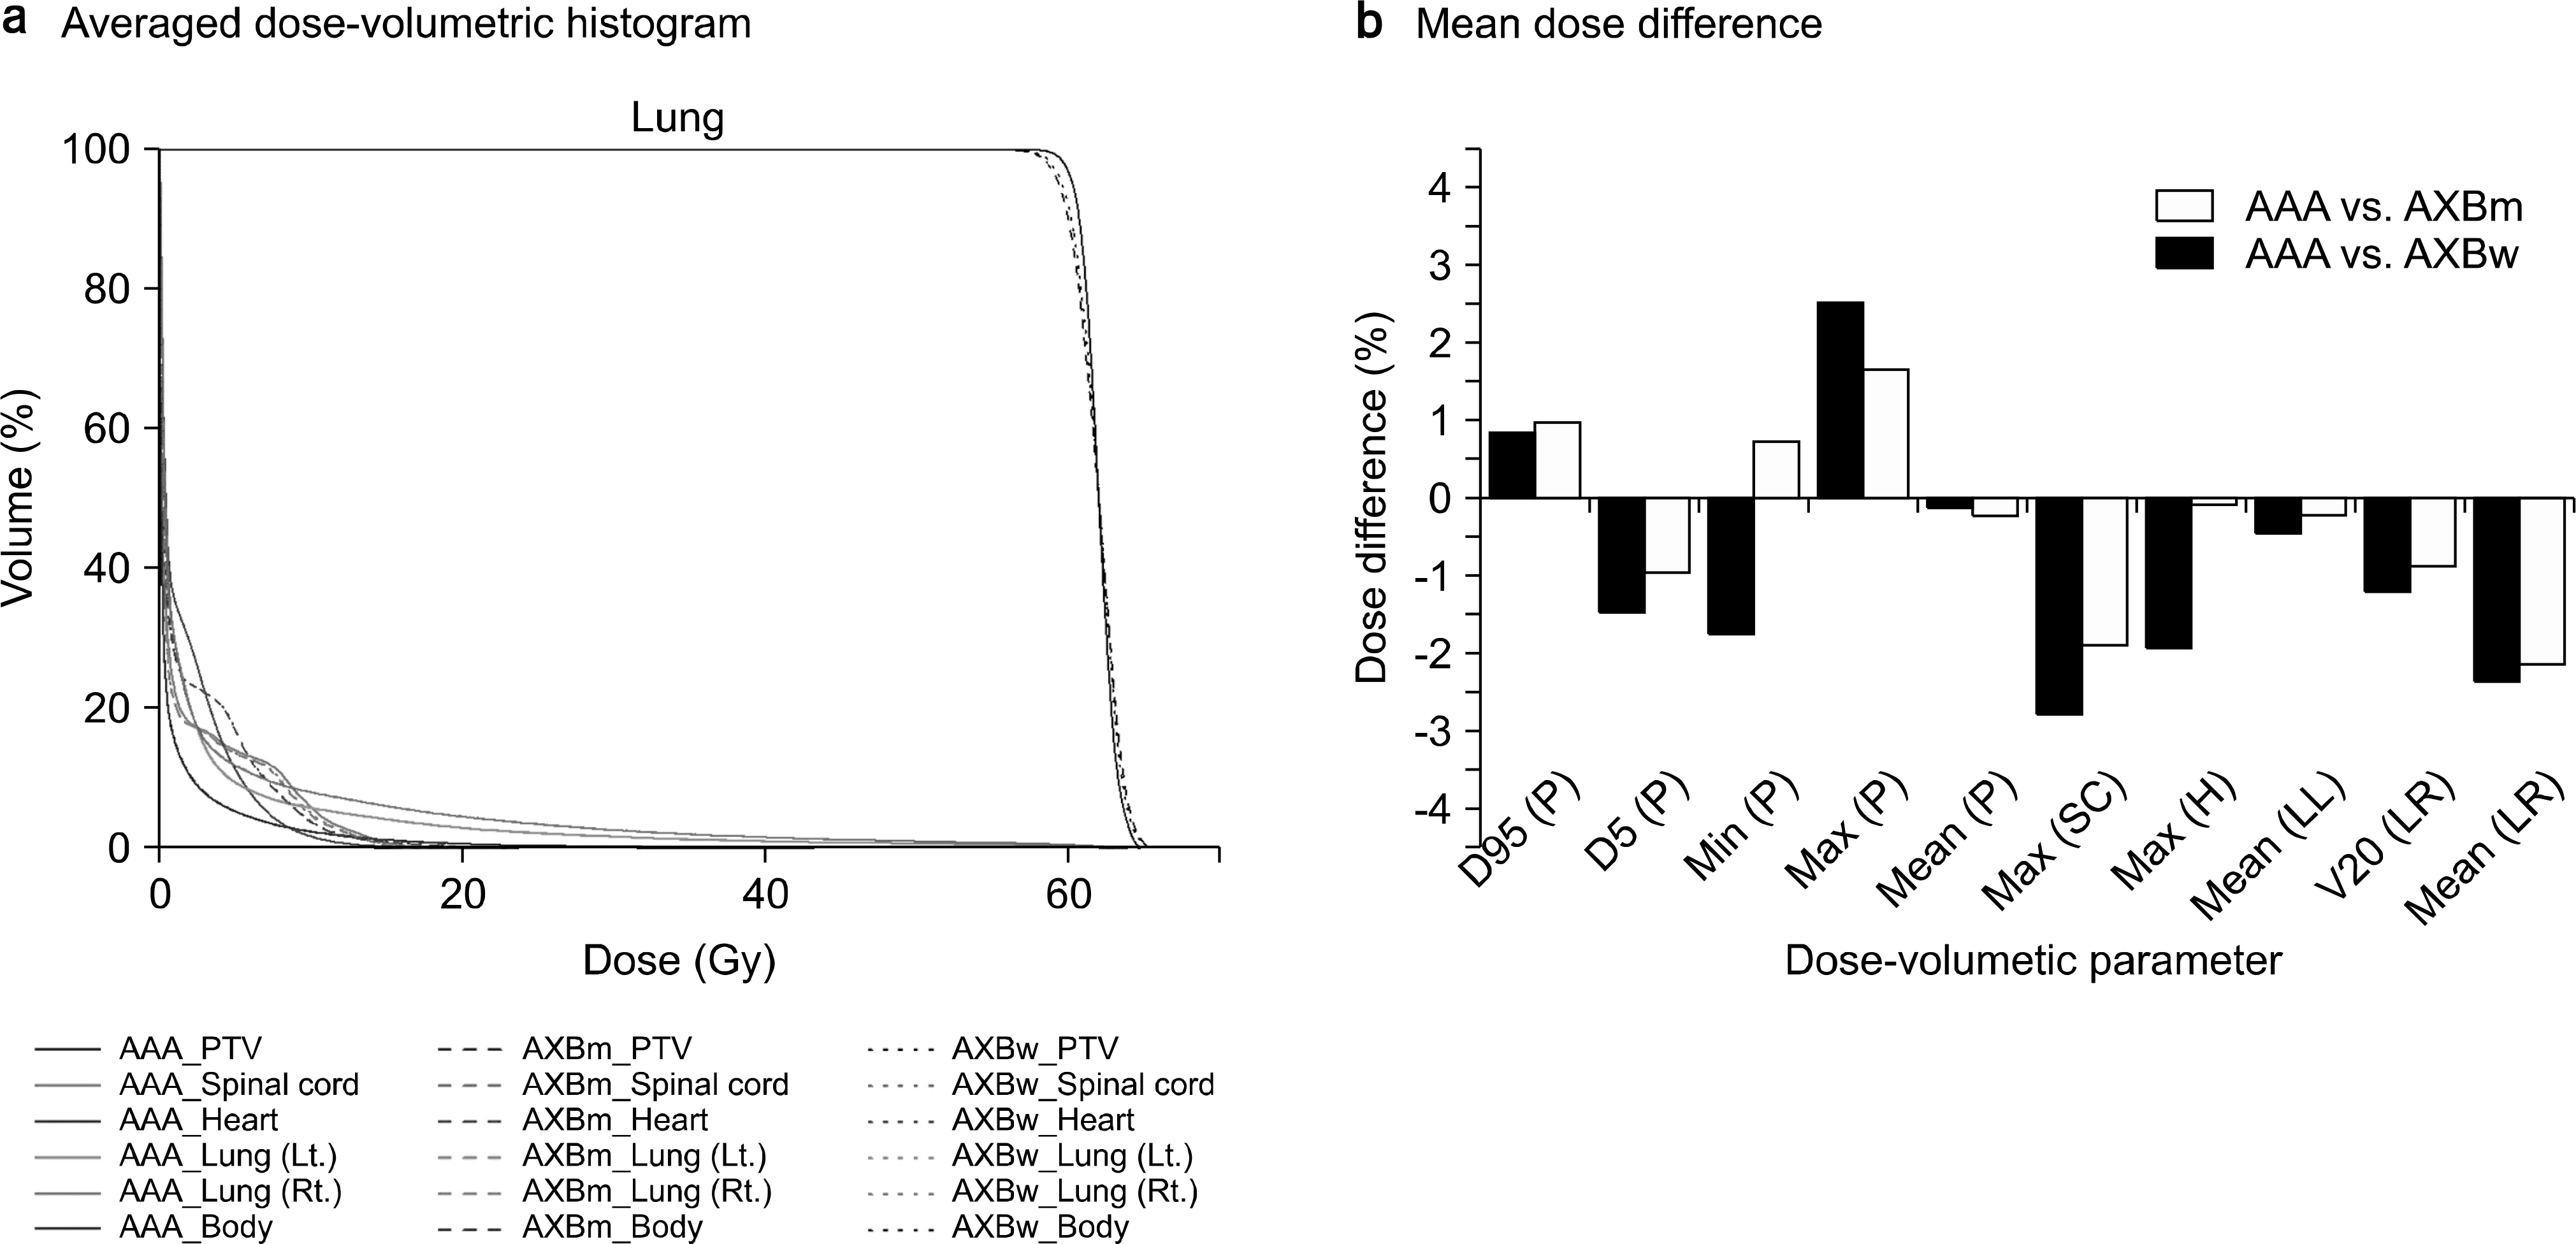
Acuros XB advanced dose calculation algorithm (AXB, Varian Medical Systems, Palo Alto, CA) has been released recently and provided the advantages of speed and accuracy for dose calculation. For clinical use, it is important to investigate the dosimetric performance of AXB compared to the calculation algorithm of the previous version, Anisotropic Analytical Algorithm (AAA, Varian Medical Systems, Palo Alto, CA). Ten volumetric modulated arc therapy (VMAT) plans for each of the following cases were included: head and neck (H&N), prostate, spine, and lung. The spine and lung cases were treated with stereotactic body radiation therapy (SBRT) technique. For all cases, the dose distributions were calculated using AAA and two dose reporting modes in AXB (dose-to-water, AXBw, and dose-to-medium, AXBm) with same plan parameters. For dosimetric evaluation, the dose-volumetric parameters were calculated for each planning target volume (PTV) and interested normal organs. The differences between AAA and AXB were statistically calculated with paired t-test. As a general trend, AXBw and AXBm showed dose underestimation as compared with AAA, which did not exceed within −3.5% and −4.5%, respectively. The maximum dose of PTV calculated by AXBw and AXBm was tended to be overestimated with the relative dose difference ranged from 1.6% to 4.6% for all cases. The absolute mean values of the relative dose differences were 1.1±1.2% and 2.0±1.2% when comparing between AAA and AXBw, and AAA and AXBm, respectively. For almost dose-volumetric parameters of PTV, the relative dose differences are statistically significant while there are no statistical significance for normal tissues. Both AXBw and AXBm was tended to underestimate dose for PTV and normal tissues compared to AAA. For analyzing two dose reporting modes in AXB, the dose distribution calculated by AXBw was similar to those of AAA when comparing the dose distributions between AAA and AXBm.
REFERENCES
1. Otto K. Volumetric modulated arc therapy: IMRT in a single gantry arc. Med Phys. 35:310–317. 2008.

2. Park JM, Kim IH, Ye SJ, Kim K. Evaluation of treatment plans using various treatment techniques for the radiotherapy of cutaneous Kaposi's sarcoma developed on the skin of feet. J Appl Clin Med Phys. 15:4970. 2014.
3. Park JM, Kim K, Chie EK, Choi CH, Ye SJ, Ha SW. RapidArc vs intensity-modulated radiation therapy for hepatocellular carcinoma: a comparative planning study. Br J Radiol 85, e323-329. 2012.
4. Park JM, Wu HG, Kim JH, Carlson JN, Kim K. The effect of MLC speed and acceleration on the plan delivery accuracy of VMAT. Br J Radiol. 88:20140698. 2015.
5. Jin H, Jesseph FB, Ahmad S. A comparison study of volumetric modulated Arc therapy quality assurances using portal dosimetry and MapCHECK 2. Prog Med Phys. 25:7. 2014.
6. Mattes MD, Lee JC, Elnaiem S, Guirguis A, Ikoro NC, Ashamalla H. A predictive model to guide management of the overlap region between target volume and organs at risk in prostate cancer volumetric modulated arc therapy. Radiat Oncol J. 32:23–30. 2014.

7. Borgers C. Complexity of Monte Carlo and deterministic dose-calculation methods. Phys Med Biol. 43:517–528. 1998.
8. Gifford KA, Horton JL, Wareing TA, Failla G, Mourtada F. Comparison of a finite-element multigroup discrete-ordinates code with Monte Carlo for radiotherapy calculations. Phys Med Biol. 51:2253–2265. 2006.

9. Vassiliev ON, Wareing TA, McGhee J, Failla G, Salehpour MR, Mourtada F. Validation of a new grid-based Boltzmann equation solver for dose calculation in radiotherapy with photon beams. Phys Med Biol. 55:581–598. 2010.

10. Han T, Mikell JK, Salehpour M, Mourtada F. Dosimetric comparison of Acuros XB deterministic radiation transport method with Monte Carlo and model-based convolution methods in heterogeneous media. Med Phys. 38:2651–2664. 2011.

11. Bush K, Gagne IM, Zavgorodni S, Ansbacher W, Beckham W. Dosimetric validation of Acuros XB with Monte Carlo methods for photon dose calculations. Med Phys. 38:2208–2221. 2011.
12. Fogliata A, Nicolini G, Clivio A, Vanetti E, Mancosu P, Cozzi L. Dosimetric validation of the Acuros XB Advanced Dose Calculation algorithm: fundamental characterization in water. Phys Med Biol. 56:1879–1904. 2011.

13. Lloyd SA, Ansbacher W. Evaluation of an analytic linear Boltzmann transport equation solver for high-density inhomogeneities. Med Phys. 40:011707. 2013.
14. Kron T, Clivio A, Vanetti E, Nicolini G, Cramb J, Lonski P, et al. Small field segments surrounded by large areas only shielded by a multileaf collimator: comparison of experiments and dose calculation. Med Phys. 39:7480–7489. 2012.

15. Han T, Mourtada F, Kisling K, Mikell J, Followill D, Howell R. Experimental validation of deterministic Acuros XB algorithm for IMRT and VMAT dose calculations with the Radiological Physics Center's head and neck phantom. Med Phys. 39:2193–2202. 2012.

16. Han T, Followill D, Mikell J, Repchak R, Molineu A, Howell R, et al. Dosimetric impact of Acuros XB deterministic radiation transport algorithm for heterogeneous dose calculation in lung cancer. Med Phys. 40:051710. 2013.
17. Kathirvel M, Subramanian S, Clivio A, Arun G, Fogliata A, Nicolini G, et al. Critical appraisal of the accuracy of Acuros-XB and Anisotropic Analytical Algorithm compared to measurement and calculations with the compass system in the delivery of RapidArc clinical plans. Radiation Oncology 8. 2013.
18. Huang B, Wu L, Lin P, Chen C. Dose calculation of Acuros XB and Anisotropic Analytical Algorithm in lung stereotactic body radiotherapy treatment with flattening filter free beams and the potential role of calculation grid size. Radiat Oncol. 10:53. 2015.
19. Hirata K, Nakamura M, Yoshimura M, Mukumoto N, Nakata M, Ito H, et al. Dosimetric evaluation of the Acuros XB algorithm for a 4 MV photon beam in head and neck intensity-modulated radiation therapy. J Appl Clin Med Phys. 16:5222. 2015.
20. Rana S, Rogers K, Lee T, Reed D, Biggs C. Dosimetric impact of Acuros XB dose calculation algorithm in prostate cancer treatment using RapidArc. J Can Res Ther. 9:430–435. 2013.

21. Zhen H, Hrycushko B, Lee H, Timmerman R, Pompos A, Stojadinovic S, et al. Dosimetric comparison of Acuros XB with collapsed cone convolution/superposition and anisotropic analytic algorithm for stereotactic ablative radiotherapy of thoracic spinal metastases. J Appl Clin Med Phys. 16:5493. 2015.
22. Liu HH. Dm rather than Dw should be used in Monte Carlo treatment planning. For the proposition. Med Phys. 29:922–923. 2002.
23. Walters BR, Kramer R, Kawrakow I. Dose to medium versus dose to water as an estimator of dose to sensitive skeletal tissue. Phys Med Biol. 55:4535–4546. 2010.

24. Rana S, Pokharel S. Dose-to-medium vs. dose-to-water: Dosimetric evaluation of dose reporting modes in Acuros XB for prostate, lung and breast cancer. Int J Cancer Ther Oncol. 2:020421. 2014.
25. Fogliata A, Nicolini G, Clivio A, Vanetti E, Cozzi L. Dosimetric evaluation of Acuros XB Advanced Dose Calculation algorithm in heterogeneous media. Radiat Oncol. 6:82. 2011.
26. Kan MW, Leung LH, Yu PK. Dosimetric impact of using the Acuros XB algorithm for intensity modulated radiation therapy and RapidArc planning in nasopharyngeal carcinomas. Int J Radiat Oncol Biol Phys 85, e73-80. 2013.
27. Kathirvel M, Subramanian S, Clivio A, Arun G, Fogliata A, Nicolini G, et al. Critical appraisal of the accuracy of Acuros-XB and Anisotropic Analytical Algorithm compared to measurement and calculations with the compass system in the delivery of RapidArc clinical plans. Radiat Oncol. 8:140. 2013.
28. Fogliata A, Nicolini G, Clivio A, Vanetti E, Cozzi L. Critical appraisal of Acuros XB and Anisotropic Analytic Algorithm dose calculation in advanced non-small-cell lung cancer treatments. Int J Radiat Oncol Biol Phys. 83:1587–1595. 2012.

29. Robinson D. Inhomogeneity correction and the analytic anisotropic algorithm. J Appl Clin Med Phys. 9:112–122. 2008.

30. Liu HW, Nugent Z, Clayton R, Dunscombe P, Lau H, Khan R. Clinical impact of using the deterministic patient dose calculation algorithm Acuros XB for lung stereotactic body radiation therapy. Acta Oncologica. 53:324–329. 2014.

31. Fogliata A, Vanetti E, Albers D, Brink C, Clivio A, Knoos T, et al. On the dosimetric behaviour of photon dose calculation algorithms in the presence of simple geometric heterogeneities: comparison with Monte Carlo calculations. Phys Med Biol. 52:1363–1385. 2007.

32. Beam Configuration Reference Guide. Varian medical system. 2009.
Fig. 1.
The averaged dose-volume histograms (DVHs) (a) and the mean values of the relative dose differences (b) for PTV and normal tissue in the case of head and neck. Solid lines, dotted lines, and dashed lines are for DVHs calculated by AAA, AXBw and AXBm, respectively. The Dn% (structure) means dose received n% volume of certain structure. Vn Gy (structure) means the percent volume of certain structure irradiated by at least n Gy. The minimum dose, maximum dose, and mean dose were abbreviated to min, max, and mean, respectively. The PTV, spinal cord, brain stem, optical chiasm, left parotid grand and right parotid grand were abbreviated to P, SC, BS, OC, PL and PR, respectively.

Fig. 2.
The averaged dose-volume histograms (DVHs) (a) and the mean values of the relative dose differences (b) for PTV and normal tissue in the case of prostate. Solid lines, dotted lines, and dashed lines are for DVHs calculated by AAA, AXBw and AXBm, respectively. The Dn% (structure) means dose received n% volume of certain structure. Vn Gy (structure) means the percent volume of certain structure irradiated by at least n Gy. The minimum dose, maximum dose, and mean dose were abbreviated to min, max, and mean, respectively. The PTV, rectum, bladder, left femur head and right femur head were abbreviated to P, R, B, FL and FR, respectively.

Fig. 3.
The averaged dose-volume histograms (DVHs) (a) and the mean values of the relative dose differences (b) for PTV and normal tissue in the case of Spine. Solid lines, dotted lines, and dashed lines are for DVHs calculated by AAA, AXBw and AXBm, respectively. The Dn% (structure) means dose received n% volume of certain structure. Vn Gy (structure) means the percent volume of certain structure irradiated by at least n Gy. The minimum dose, maximum dose, and mean dose were abbreviated to min, max, and mean, respectively. The PTV, left kidney and right kidney were abbreviated to P, KL and KR, respectively.

Fig. 4.
The averaged dose-volume histograms (DVHs) (a) and the mean values of the relative dose differences (b) for PTV and normal tissue in the case of lung. Solid lines, dotted lines, and dashed lines are for DVHs calculated by AAA, AXBw and AXBm, respectively. The Dn% (structure) means dose received n% volume of certain structure. Vn Gy (structure) means the percent volume of certain structure irradiated by at least n Gy. The minimum dose, maximum dose, and mean dose were abbreviated to min, max, and mean, respectively. The PTV, spinal cord, heart, left lung, and right lung were abbreviated to P, SC, H, LL, and LR, respectively.

Table 1.
The mean dose-volumetric parameters of PTV and normal tissues for head and neck cases.
| AAA | AXBm | AXBw | pA∗ | pB † | pC ‡ | |
|---|---|---|---|---|---|---|
| PTV | ||||||
| D95% (Gy) | 70.7±0.2 | 69.6±0.4 | 70.7±0.3 | <0.001 | 0.992 | <0.001 |
| D5% (Gy) | 67.5±0.0 | 66.0±0.2 | 67.2±0.2 | <0.001 | <0.001 | <0.001 |
| Min (Gy) | 51.6±4.8 | 50.4±4.6 | 51.4±5.4 | 0.552 | 0.916 | 0.652 |
| Max (Gy) | 73.1±0.6 | 73.0±0.9 | 75.4±1.0 | 0.879 | <0.001 | <0.001 |
| Mean (Gy) | 69.3±0.1 | 67.9±0.2 | 69.1±0.2 | <0.001 | 0.075 | <0.001 |
| Spinal cord | ||||||
| Max (Gy) | 42.9±1.0 | 41.6±0.9 | 42.3±0.9 | 0.005 | 0.159 | 0.079 |
| Brain stem | ||||||
| Max (Gy) | 52.9±1.0 | 52.0±1.2 | 52.9±1.1 | 0.072 | 0.885 | 0.103 |
| Optic chiasm | ||||||
| Max (Gy) | 27.7±16.7 | 27.1±16.9 | 27.6±17.1 | 0.931 | 0.987 | 0.945 |
| Left parotid gland | ||||||
| V20 Gy (%) | 48.2±14.9 | 47.0±14.6 | 47.8±14.6 | 0.857 | 0.950 | 0.905 |
| Mean (Gy) | 25.0±4.3 | 24.3±4.2 | 24.7±4.2 | 0.749 | 0.898 | 0.848 |
| Right parotid gland | d | |||||
| V20 Gy (%) | 51.5±5.7 | 50.3±5.9 | 51.2±5.9 | 0.648 | 0.911 | 0.736 |
| Mean (Gy) | 26.3±2.2 | 25.6±2.2 | 26.0±2.2 | 0.530 | 0.799 | 0.711 |
Table 2.
The mean dose-volumetric parameters of PTV and normal tissues for prostate cases.
| AAA | AXBm | AXBw | pA∗ | pB† | pC ‡ | |
|---|---|---|---|---|---|---|
| PTV | ||||||
| D95% (Gy) | 73.7±0.4 | 73.4±0.3 | 73.6±0.5 | 0.077 | 0.476 | 0.383 |
| D5% (Gy) | 70.1±0.2 | 68.9±0.2 | 69.2±0.3 | <0.001 | <0.001 | 0.017 |
| Min (Gy) | 61.5±3.6 | 59.6±3.0 | 59.8±3.3 | 0.225 | 0.301 | 0.880 |
| Max (Gy) | 76.7±0.8 | 77.3±0.9 | 77.6±0.9 | 0.103 | 0.023 | 0.533 |
| Mean (Gy) | 72.2±0.3 | 71.3±0.3 | 71.9±0.4 | <0.001 | 0.079 | 0.003 |
| Rectum | ||||||
| D70% (Gy) | 17.6±2.9 | 16.8±2.9 | 17.0±3.0 | 0.555 | 0.657 | 0.886 |
| Mean (Gy) | 31.6±2.7 | 30.9±2.8 | 31.1±2.7 | 0.564 | 0.725 | 0.821 |
| Bladder | ||||||
| D70% (Gy) | 15.8±10.3 | 15.3±10.2 | 15.5±10.3 | 0.921 | 0.955 | 0.966 |
| Mean (Gy) | 33.1±8.8 | 32.4±8.7 | 32.8±8.8 | 0.863 | 0.953 | 0.910 |
| Left femur head | ||||||
| D50% (Gy) | 14.0±4.4 | 13.7±4.3 | 14.0±4.4 | 0.850 | 0.981 | 0.868 |
| Max (Gy) | 25.9±5.3 | 25.2±5.1 | 25.8±5.2 | 0.775 | 0.979 | 0.793 |
| Right femur head | ||||||
| D50% (Gy) | 14.5±4.7 | 14.1±4.6 | 14.5±4.7 | 0.864 | 0.992 | 0.871 |
| Max (Gy) | 25.2±5.5 | 24.6±5.3 | 25.2±5.4 | 0.799 | 0.985 | 0.782 |
Table 3.
The mean dose-volumetric parameters of PTV and normal tissues for spine cases.
| AAA | AXBm | AXBw | pA∗ | pB † | pC ‡ | |
|---|---|---|---|---|---|---|
| PTV | ||||||
| D95% (Gy) | 8.3±0.1 | 8.2±0.1 | 8.4±0.1 | 0.001 | 0.055 | <0.001 |
| D5% (Gy) | 8.0±0.0 | 7.8±0.0 | 8.0±0.0 | <0.001 | 0.015 | <0.001 |
| Min (Gy) | 6.8±1.1 | 6.6±1.0 | 6.7±1.0 | 0.619 | 0.771 | 0.831 |
| Max (Gy) | 8.7±0.1 | 8.6±0.1 | 9.2±0.1 | 0.657 | <0.001 | <0.001 |
| Mean (Gy) | 8.2±0.0 | 8.0±0.0 | 8.2±0.0 | <0.001 | 0.673 | <0.001 |
| Left kidney | ||||||
| D50% (Gy) | 0.8±0.9 | 0.8±0.9 | 0.8±0.9 | 0.958 | 0.980 | 0.979 |
| Max (Gy) | 3.7±3.2 | 3.6±3.1 | 3.6±3.1 | 0.936 | 0.953 | 0.983 |
| Right kidney | ||||||
| D50% (Gy) | 0.7±0.8 | 0.7±0.8 | 0.7±0.8 | 0.950 | 0.971 | 0.979 |
| Max (Gy) | 3.6±3.3 | 3.5±3.3 | 3.6±3.3 | 0.947 | 0.965 | 0.982 |
Table 4.
The mean dose-volumetric parameters of PTV and normal tissues for lung cases.
| AAA | AXBm | AXBw | pA∗ | pB † | pC ‡ | |
|---|---|---|---|---|---|---|
| PTV | ||||||
| D95% (Gy) | 63.1±0.7 | 63.5±1.0 | 63.4±1.0 | 0.319 | 0.424 | 0.851 |
| D5% (Gy) | 60.5±0.7 | 59.9±1.0 | 60.1±1.0 | 0.136 | 0.303 | 0.671 |
| Min (Gy) | 56.8±0.7 | 55.9±1.1 | 56.3±1.0 | 0.032 | 0.189 | 0.373 |
| Max (Gy) | 64.5±0.9 | 65.7±1.1 | 65.3±1.4 | 0.017 | 0.166 | 0.480 |
| Mean (Gy) | 62.0±0.7 | 61.9±1.0 | 62.0±0.9 | 0.792 | 0.862 | 0.930 |
| Spinal cord | ||||||
| V13.5 Gy (%) | 1.9±2.6 | 1.4±2.2 | 1.6±2.4 | 0.645 | 0.748 | 0.892 |
| Max (Gy) | 13.5±5.1 | 13.0±4.8 | 13.2±4.8 | 0.812 | 0.883 | 0.926 |
| Heart | ||||||
| V27.5 Gy (%) | 0.0±0.0 | 0.0±0.0 | 0.0±0.0 | 0.702 | 0.900 | 0.785 |
| Max (Gy) | 13.0±9.9 | 12.9±9.8 | 12.9±9.8 | 0.984 | 0.982 | 0.999 |
| Left lung | ||||||
| V20 Gy (%) | 3.0±4.9 | 3.0±4.9 | 3.0±4.9 | 0.998 | 0.996 | 0.999 |
| Mean (Gy) | 2.5±2.5 | 2.5±2.5 | 2.5±2.5 | 0.989 | 0.992 | 0.997 |
| Right lung | ||||||
| V20 Gy (%) | 4.6±4.8 | 4.6±4.9 | 4.6±4.9 | 0.983 | 0.980 | 0.997 |
| Mean (Gy) | 3.1±2.4 | 3.1±2.4 | 3.1±2.4 | 0.996 | 0.999 | 0.996 |


 PDF
PDF ePub
ePub Citation
 Print
Print


 XML Download