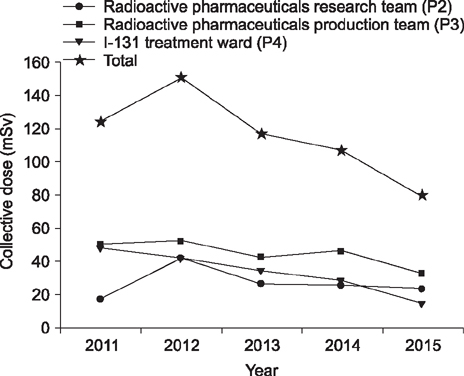
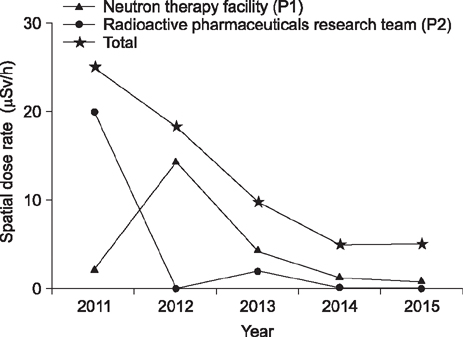
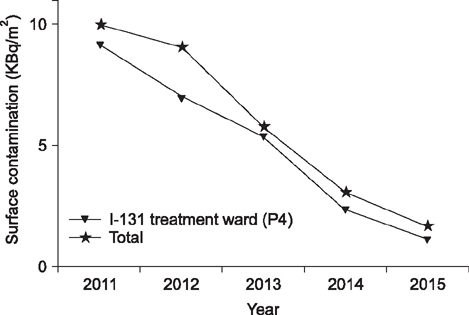
Table 1.
Annual average effective dose distribution by position between 2011 and 2015.
Table 2.
Number of workers exceeding the mean effective dose in their position between 2011 and 2015.
| Position |
2011 |
2012 |
2013 |
2014 |
2015 |
|||||
|---|---|---|---|---|---|---|---|---|---|---|
| N* | % | N* | % | N* | % | N* | % | N* | % | |
| Neutron therapy facility (P1) | 1 | 3.70 | 2 | 6.90 | 1 | 3.85 | 1 | 4.35 | 1 | 6.67 |
| Radioactive pharmaceuticals research team (P2) | 4 | 14.81 | 3 | 10.34 | 2 | 7.69 | 3 | 13.04 | 2 | 13.33 |
| Radioactive pharmaceuticals production center (P3) | 8 | 29.63 | 9 | 31.03 | 7 | 26.92 | 7 | 30.43 | 5 | 33.33 |
| Nuclear medicine (P4) | 10 | 37.04 | 10 | 34.48 | 10 | 38.46 | 10 | 43.48 | 6 | 40.0 |
| I-131 treatment ward (P5) | 4 | 14.81 | 5 | 17.24 | 6 | 23.08 | 2 | 8.70 | 1 | 6.67 |
| Total | 27 | 100.00 | 29 | 100.00 | 26 | 100.00 | 23 | 100.00 | 15 | 100.00 |
Table 3.
Mean and standard deviation of the depth dose and surface dose between 2011 and 2015.
| Year | N* |
Mean±S.D.† |
|
|---|---|---|---|
| Deep dose | Shallow dose | ||
| 2011 | 292 | 0.70±1.7a | 0.78±2.1a |
| 2012 | 335 | 0.80±1.9a | 0.89±2.3a |
| 2013 | 372 | 0.63±1.6a,b | 0.72±2.3a,b |
| 2014 | 386 | 0.62±1.7a,b | 0.64±1.6a,b |
| 2015 | 446 | 0.42±1.3c | 0.45±1.5c |
| Total | 1,831 | 0.62±1.6 | 0.68±2.0 |
Table 4.
Mean and standard deviation of the depth dose and surface dose by age between 2011 and 2015.
|
Deep dose |
unit : mSv |
|||||||||
|---|---|---|---|---|---|---|---|---|---|---|
|
Year |
2011 |
2012 |
2013 |
2014 |
2015 |
|||||
| Age | N* | mean±S.D.† | N* | mean±S.D.† | N* | mean±S.D.† | N* | mean±S.D.† | N* | mean±S.D.† |
| 20 | 61 | 0.61±1.5 | 74 | 0.69±1.2 | 85 | 0.63±1.5 | 90 | 0.48±1.4 | 109 | 0.23±0.57 |
| 30 | 114 | 0.73±1.8 | 136 | 0.65±1.1 | 143 | 0.56±0.91 | 150 | 0.55±1.3 | 179 | 0.36±1.0 |
| 40 | 80 | 0.79±1.9 | 75 | 1.2±3.2 | 81 | 0.77±2.4 | 80 | 0.78±2.2 | 90 | 0.49±1.6 |
| 50 | 34 | 0.65±1.8 | 46 | 0.84±1.7 | 54 | 0.68±2.0 | 58 | 0.85±2.1 | 60 | 0.77±2.1 |
| 60 | 3 | 0.05±0.06 | 4 | 0.11±0.11 | 9 | 0.18±0.15 | 8 | 0.19±0.2 | 8 | 1.0±2.0 |
| Total | 292 | 0.70±1.7 | 335 | 0.80±1.9 | 372 | 0.63±1.6 | 386 | 0.62±1.7 | 446 | 0.42±1.3 |
|
|
||||||||||
|
Shallow dose |
unit : mSv |
|||||||||
|
Year |
2011 |
2012 |
2013 |
2014 |
2015 |
|||||
| Age | N | mean±S.D.† | N | mean±S.D.† | N | mean±S.D.† | N | mean±S.D.† | N | mean±S.D.† |
|
|
||||||||||
| 20 | 61 | 0.61±1.5 | 74 | 0.73±1.2 | 85 | 0.67±1.5 | 90 | 0.50±1.4 | 109 | 0.24±0.56 |
| 30 | 114 | 0.83±2.0 | 136 | 0.82±2.4 | 143 | 0.65±1.5 | 150 | 0.60±1.3 | 179 | 0.37±0.96 |
| 40 | 80 | 0.90±2.5 | 75 | 1.2±3.2 | 81 | 0.97±3.9 | 80 | 0.72±2.1 | 90 | 0.59±2.3 |
| 50 | 34 | 0.72±2.1 | 46 | 0.84±1.7 | 54 | 0.69±2.0 | 58 | 0.92±2.1 | 60 | 0.77±2.1 |
| 60 | 3 | 0.05±0.06 | 4 | 0.11±0.11 | 9 | 0.23±0.29 | 8 | 0.22±0.21 | 8 | 1.0±2.0 |
| Total | 292 | 0.78±2.0 | 335 | 0.89±2.3 | 372 | 0.72±2.3 | 386 | 0.64±1.6 | 446 | 0.45±1.5 |
Table 5.
Mean and standard deviation of the depth dose and surface dose by gender between 2011 and 2015.
|
Deep dose |
unit : mSv |
|||||||||
|---|---|---|---|---|---|---|---|---|---|---|
|
Year |
2011 |
2012 |
2013 |
2014 |
2015 |
|||||
| Gender | N* | mean±S.D.† | N* | mean±S.D.† | N* | mean±S.D.† | N* | mean±S.D.† | N* | mean±S.D.† |
| M | 182 | 0.91±2.0a,x | 196 | 0.98±2.2a,x | 214 | 0.77±1.9a,b,x | 216 | 0.77±1.8a,b,x | 248 | 0.53±1.4b,x |
| F | 110 | 0.37±1.1a,y | 139 | 0.56±1.2a,y | 158 | 0.44±1.2a,b,y | 170 | 0.43±1.4a,b,y | 198 | 0.29±1.1b,y |
| Total | 292 | 0.70±1.7 | 335 | 0.80±1.9 | 372 | 0.63±1.6 | 386 | 0.62±1.7 | 446 | 0.42±1.3 |
|
|
||||||||||
|
Shallow dose |
unit : mSv |
|||||||||
|
Year |
2011 |
2012 |
2013 |
2014 |
2015 |
|||||
| Gender | N | mean±S.D.† | N | mean±S.D.† | N | mean±S.D.† | N | mean±S.D.† | N | mean±S.D.† |
|
|
||||||||||
| M | 182 | 1.0±2.3a,x | 196 | 1.1±2.8a,x | 214 | 0.91±2.8a,b,x | 216 | 0.82±1.9a,b,x | 248 | 0.57±1.8b,x |
| F | 110 | 0.42±1.4a,y | 139 | 0.58±1.2a,y | 158 | 0.45±1.2a,b,y | 170 | 0.42±1.3a,b,y | 198 | 0.29±1.1b,y |
| Total | 292 | 0.78±2.1 | 335 | 0.89±2.3 | 372 | 0.72±2.3 | 386 | 0.64±1.6 | 446 | 0.45±1.5 |
Table 6.
Mean spatial dose rate and mean distribution by position between 2011 and 2015. Unit: μSv/h
| Radiation-controlled area | 2011 | 2012 | 2013 | 2014 | 2015 | |
|---|---|---|---|---|---|---|
| Position 1 (n=12) | N | 91 | 196 | 378 | 411 | 441 |
| Mean distribution | 0.53∼2.9 | 4.5∼23 | 0.60∼15 | 0.32∼8.0 | 0.37∼0.99 | |
| Mean±SD† | 2.4±3.71a,x | 14±55a,x,y | 4.3±31a,y,z | 1.3±6.8a,y,z | 0.66±1.6a,z | |
| Position 2 (n=16) | N | 150 | 702 | 655 | 704 | 703 |
| Mean distribution | 19∼21 | 0.18∼0.40 | 0.20∼0.95 | 0.20∼0.68 | 0.18∼0.43 | |
| Mean±SD† | 20±13b,x | 0.24±0.56b,x,y | 2.0±5.5b,y,z | 0.30±1.6b,y,z | 0.26±0.33b,z | |
| Position 3 (n=30) | N | 891 | 1319 | 1257 | 1380 | 1289 |
| Mean distribution | 0.48∼6.16 | 1.3∼4.2 | 1.5∼3.8 | 1.6∼3.0 | 0.78∼21 | |
| Mean±SD† | 1.1±5.5c,x | 2.0±5.5c,x,y | 2.3±8.0c,y,z | 2.3±5.9c,y,z | 3.5±28c,z | |
| Position 4 (n=28) | N | 840 | 1229 | 1175 | 1288 | 1176 |
| Mean distribution | 0.82∼2.5 | 0.47∼1.5 | 0.62∼1.4 | 0.46∼1.2 | 0.30∼0.67 | |
| Mean±SD† | 1.3±3.6c,x | 1.0±2.8c,x,y | 1.0±2.8c,y,z | 0.89±2.5c,y,z | 0.51±1.2c,z | |
| Position 5 (n=41) | N | 1228 | 1761 | 1553 | 1804 | 1517 |
| Mean distribution | 0.20∼0.37 | 0.27∼0.88 | 0.27∼0.61 | 0.24∼0.38 | 0.21∼0.33 | |
| Mean±SD† | 0.24±0.34d,x | 0.43±1.9d,x,y | 0.34±0.73d,y,z | 0.30±0.30d,y,z | 0.25±0.20d,z | |
| Total | N | 3200 | 5207 | 5018 | 5587 | 5126 |
| Mean±SD† | 1.7±6.2 | 1.5±11 | 1.3±9.7 | 0.99±3.8 | 1.2±14 | |
Table 7.
Mean surface contamination and mean distribution by position between 2011 and 2015. Unit: kBq/m2
| Radiation-controlled area | 2011 | 2012 | 2013 | 2014 | 2015 | |
|---|---|---|---|---|---|---|
| Position 2 (n=16) | N | - | 671 | 638 | 702 | 704 |
| Mean distribution | - | 0∼1.5 | 0∼0.11 | 0∼0.18 | 0∼0.04 | |
| Mean±SD† | - | 0.32±1.4b,x | 0.03±0.18c,x | 0.03±0.24d,x | 0.01±0.05d,x | |
| Position 3 (n=30) | N | 891 | 1348 | 1258 | 1378 | 1287 |
| Mean distribution | 0.11∼2.1 | 0.10∼2.4 | 0.03∼1.8 | 0.01∼4.5 | 0.01∼1.2 | |
| Mean±SD† | 0.76±2.0a,x | 0.82±3.3b,x | 0.30±1.8c,x | 0.55±4.1d,x | 0.43±1.9d,x | |
| Position 4 (n=28) | N | 840 | 1231 | 1146 | 1287 | 1176 |
| Mean distribution | 0.00∼0.47 | 0.01∼5.3 | 0.01∼0.15 | 0.01∼0.72 | 0.00∼0.35 | |
| Mean±SD† | 0.07±0.53a,x | 0.88±12b,x | 0.05±0.33c,x | 0.11±1.9d,x | 0.05±0.82d,x | |
| Position 5 (n=41) | N | 1230 | 1732 | 1548 | 1803 | 1497 |
| Mean distribution | 2.31∼20.34 | 2.71∼15.52 | 0.98∼12 | 0.87∼4.1 | 0.06∼3.8 | |
| Mean±SD† | 9.3±45a,y | 7.1±24b,y | 5.4±22c,y | 2.5±10d,y | 1.2±9.6d,y | |
| Total | N | 2961 | 4982 | 4590 | 5170 | 4664 |
| Mean±SD† | 4.1±29 | 2.9±16 | 1.9±13 | 1.0±6.5 | 0.53±5.6 | |


 PDF
PDF ePub
ePub Citation
 Print
Print


 XML Download