

 PDF
PDF ePub
ePub Citation
 Print
Print


INTRODUCTION
Computed tomography (CT) has been used as a visual diagnostic method to obtain the tomography of the human body. However, the human body is composed of multiple tissues with different tissue and electron densities. Hence, there are limitations in closely separating the different tissues. In order to overcome such limitations, dual energy CT (DECT) is currently being studied.
DECT uses two types of photon energy spectra in order to differentiate two different materials and quantify each material's mass density.12)
Currently, the common types of commercialized DECT involve either 1) quickly switching the tube voltage of an X-ray tube (kV switching), or 2) creating two types of photon spectra by using the two X-ray tubes with different energy regions (dual source).34)
The tube voltages that are used in the existing commercialized DECT to maximize the difference between the two photon spectra and minimize the overlapped area are 80 and 140 kVp. The average energies of 80 kVp and 140 kVp tube voltages are 38.7 keV and 53.1 keV, respectively.
Normally, any tube voltage lower than 80 kVp is not used because the photon quantity absorbed by the human body is more than the photon quantity measured at the detector for visualization when radiographed.
The tube voltages with more than 140 kVp are not used in the normal commercialized X-ray tube; however, the 140 kVp tube voltage was applied in the second generation dual source CT because of its advantage in being able to provide better spectral contrast. By using 0.4 or 1.0 mm tin filters, the separation between the low energy and high-energy photon spectra can be maximized.
For the case in which the energy modulation filter is used to create two photon spectra with different average energy regions, the average energy of the photon spectra may increase after passing through the filter. This is due to the beam hardening effect. Therefore, the overlapping area of the low-energy and high-energy photon spectra can be reduced.5)
If a thicker filter is used in order to enlarge the gap between the two photon spectra, the beam hardening effect will increase, but the image quality will be lowered because the actual photon quantity collected at the detector is not sufficient—even with the largest tube voltage—since large photon quantity has already been absorbed by the filter.
Hence, in DECT with an energy modulation filter, it is essential to optimize material and thickness of the energy modulation filter in order to maximize the spectrum contrast and minimize the photon quantity absorbed by the filter.
MATERIALS AND METHODS
1. Monte carlo simulation
In order to optimize the material and thickness of the energy modulation filter by Monte Carlo simulation, we used the Geant4 (Geometry And Tracking, version: 10.00.p01) toolkit, which is an object oriented program that calculates the energy change and paths of incident particles created by the interaction between the incident particles and an object.
1) Setting of physical model
The Geant4 toolkit can simulate various physical interactions including not only weak interactions, but strong interactions as well. Therefore, it is necessary to make a relevant physical model choice that suits the experimental conditions. In this study, the G4EmStandard-Physics and G4Penelope package was applied in order to simulate the physical interaction of low energy photons. To precisely simulate the motion of the secondary electrons created by the radiation interaction within the energy modulation filter, the value that can fine-tune the simulation of the secondary radiation created by radiation interaction within the energy modulation filter was determined to be and set as 0.01 µm.
2) Geometry and photon spectrum
The geometry of the research-purpose cone beam CT equipment was simulated for the actual application of the energy modulation filter. The X-ray tube used in the research-purpose cone beam CT equipment was an X-ray tube by Toshiba (D054SB, Toshiba, Japan) and it is drivable within the range of 40~120 kVp for the tube voltage and 1~24 mA for the tube current. The distance from the source to the detector was 900 mm.
The incident photon spectrum used for simulation was created by SpekCalc program.910) By using the GPS class of Geant4 on the photon spectrum created, the parameter for the initial particle was defined. The input values to the Spekcalc program were 1) maximum energy of photon spectrum set to 80 keV and 2) 0.8 mm beryllium and 1 mm aluminum applied as the inherent filter to absorb the low energy photons not needed for obtaining the image. The result file of the photon spectrum created by Spekcalc program was converted to a GPS macro file by Matlab (2011b, The MathWorks Inc, USA), and the initial particle GPS class was defined.
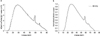
The photon spectrum with 80 kVp tube voltage, which is a low energy photon spectrum applied to the commercialized DECTs, was used as the incident photon spectrum. The incident photon spectrum, created by the SpekCalc program and applied to the simulation, was compared to the photon spectrum with the 80 kVp tube voltage obtained by Geant4 (Fig. 1). The photon spectrum was measured at a location 900 mm away from the source by defining the geometry designed to measure the kinetic energy of radiation using the Sensitive-Detector class.
2. Applying the energy modulation filter
The types of composed materials used for optimizing the energy modulation filter material are as follows: copper (8.96 g/cm3), which is often applied in the X-ray filter; niobium (8.57 g/cm3), which is used as a filter to obtain images at dental X-ray; stannum (7.31 g/cm3), which is used as a filter of the second generation DECT equipment; and gold (19.32 g/cm3) and lead (11.34 g/cm3), which effectively absorbs low energy X-ray.
For each material, thicknesses of 0.1, 0.5, and 1.0 mm were applied and the spectra were measured in order to optimize the thickness of the energy modulation filter. The size of the energy modulation filter was modeled to be the same as that of the research-purpose cone beam CT's detector. It was located 10 mm away from the detector while the detector was located 900 mm away from the initial photon's location to measure the kinetic energy of the photon that passed through the energy modulation filter.
3. Acquisition and analysis of photon spectrum
The spectrum was acquired and analyzed by using Matlab code, with the kinetic energy information of the photon measured at the detector. In order to check the overlapping area between the photon spectrum that passed through the energy modulation filter and the photon spectrum that did not pass through the energy modulation spectrum, normalization was carried out by each photon spectrum's mode. The photon spectrum that did not pass through the energy modulation filter and the photon spectrum that passed through the energy modulation filter were compared and evaluated by Matlab code for the sake of quantitative analysis of the beam hardening effect of materials applied to the energy modulation filter.
When a low energy photon passes through the energy modulation filter, the average energy rises because of the beam hardening effect. However, the output photon quantity is lowered because of the photon quantity absorbed by the filter, which results in increased incident photons. Hence, the incident photon ray, by material and thickness of the energy modulation filter, was compared and evaluated against the photon quantity that passed through the filter to determine the actual increase rate of the tube voltage.
RESULTS
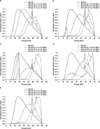
To analyze the characteristics of the energy modulation filter, materials and thicknesses applied to the dual energy cone beam CT (copper (Cu), niobium (Nb), stannum (Sn), gold (Au), and lead (Pb)), were used as composing materials of the energy modulation filter. The overlapping area between the low-energy photon spectrum and the high-energy photon spectrum were compared and evaluated by measuring the photon spectra as the thickness was changed from 0.1 mm to 1.0 mm. (Fig. 2a-e).
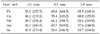
In order to quantitatively evaluate the degree of the beam hardening effect based on the material and thickness of the energy modulation filter, the rate of average energy of the photon spectrum that passed through the energy modulation filter against 38.7 keV, which is the average energy of the incident photon spectrum with tube voltage of 80 kVp, was calculated and compared (Table 1). The average energy of the photon spectrum with 140 kVp tube voltage, used at the commercialized DECT equipment, is 53.1 keV, which is closest to 53.2 keV, the average energy of the photon spectrum (with tube voltage 140 kVp applied by using a 0.1 mm thick lead filter as the energy modulation filter).
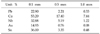
When comparing the incident photon quantity by material and thickness of the energy modulation filter against the output photon quantity that passed through the filter, the photon spectrum obtained by using 0.1 mm lead as the energy modulation filter showed the output photon quantity to be 22.9% less than the incident photon quantity (Table 2).
Discussion and Conclusion
This research suggests energy modulation filter-based, dual-energy cone beam CT as a method to produce two types of photon spectra, while optimizing the material and thickness of the energy modulation filter.
For the case of Sn, its average energy increase rate by thickness was higher than Cu or Nb. However, a K shell absorption peak of 29.19 keV was created from the Sn filter, whereas that of 18.99 keV was created from the Nb filter. Hence, further research is required to understand the effects of the absorption peaks on the image quality.
The highest average energy among all materials at a thickness of 0.1 mm was observed for Au. However, the increase rate of average energy, by thickness, was relatively low whereas the photon quantity absorbed at the filter was large. Hence, its average energy at the thickness of 1 mm was the lowest among the materials.
For the case of the output photon spectrum, measured at the detector after passing through the energy modulation filter, the average kinetic energy caused by beam hardening effect could be verified. However, the output photon quantity measured at the detector was less than the case with no energy modulation filter. Hence, if the high-energy photon spectrum that passed through the energy modulation filter is employed for image acquisition, the tube current should be effectively corrected in order to maintain image quality.
Consequently, if 0.1 mm lead is applied as the energy modulation filter to the photon spectrum with a tube voltage of 80 kVp, the tube current should be increased by 4.37 times. Since this is expected in order to obtain an output photon spectrum with the same average energy as the photon spectrum with 140 kVp tube current, this important data should be used in determining the material and thickness required for the actual dual energy CBCT development.
 XML Download