Abstract
The goal of quality assurance (QA) is to minimize systematic errors in order to maintain the quality of a certain process. Statistical process control (SPC) has been utilized for QA in radiation therapy field since 2005 and is changing QA paradigm. Its purpose is to maintain a process within the given control limits while monitoring of error trends such as variation or dispersion. SPC can be applied to all QA aspects of radiotherapy; however, a medical physicist should have enough knowledge about the application of SPC to QC/QA procedures. In this paper, the author introduce a concept of SPC and review some previously reported studies those used SPC for QA in radiation therapy.
Go to : 
References
2. Klein EE, Hanley J, Bayouth J, et al. Task group 142 report: Quality assurance of medical accelerators. Med. Phys. 36(9):4197–4212. 2009.
3. Lee SH. Engineering Statistics and Data Analysis using Minitab, EreTec (. 2008.
4. AIAG. Statistical process control (SPC) reference manual 2nd ed., AIAG (. 2005.
5. Pawlicki T, Chera B, Ning T, Marks LB. The systematic application of quality measures and process control in clinical radiation oncology. Semin. Radiat. Oncol. 22(1):70–76. 2012.

6. Pawlicki T, Whitaker M. Variation and control of process behavior. Int. J. Radiat. Oncol. Biol. Phys. 71:(. (1 Suppl):):. S210–4. 2008.
7. http://en.wikipedia.org/wiki/Control_chart
8. Sanghangthum T, Suriyapee S, Srisatit S, Pawlicki T. Retrospective analysis of linear accelerator output constancy checks using process control techniques. J. Appl. Clin. Med. Phys. 14(1):4032. 2013.

9. Gerard K, Grandhaye JP, Marchesi V, Kafrouni H, Husson F, Aletti P. A comprehensive analysis of the IMRT dose delivery process using statistical process control (SPC). Med. Phys. 36(4):1275–1285. 2009.

10. Oh SA, Yea JW, Kim SW, Lee R, Kim SK. Analysis of output constancy checks using process control techniques in linear accelerators. Progress. Med. Phys. 25(3):185–192.
11. Able CM, Hampton CJ, Baydush AH, Munley MT. Initial investigation using statistical process control for quality control of accelerator beam steering. Radiat. Oncol. 6180–717X–6–180 (. 2011.
12. Han Y. Review on the pre-treatment quality assurance for intensity modulated radiation therapy. Progress. Med. Phys. 24(4):213–219. 2014.
13. Basran PS, Woo MK. An analysis of tolerance levels in IMRT quality assurance procedures. Med. Phys. 35(6):2300–2307. 2008.

14. Gordon JD, Krafft SP, Jang S, Smith-Raymond L, Stevie MY, Hamilton RJ. Confidence limit variation for a single IMRT system following the TG119 protocol. Med. Phys. 38(3):1641–1648. 2011.

15. Sanghangthum T, Suriyapee S, Srisatit S, Pawlicki T. Statistical process control analysis for patient-specific IMRT and VMAT QA. J. Radiat. Res. 54(3):546–552. 2013.

16. Palaniswaamy G, Scott Brame R, Yaddanapudi S, Rangaraj D, Mutic S. A statistical approach to IMRT patientspecific QA. Med. Phys. 39(12):7560–7570. 2012.

17. Gagneur JD, Ezzell GA. An improvement in IMRT QA results and beam matching in linacs using statistical process control. J. Appl. Clin. Med. Phys. 15(5):4927. 2014.

18. Pawlicki T, Yoo S, Court LE, et al. Moving from IMRT QA measurements toward independent computer calculations using control charts. Radiother. Oncol. 89(3):330–337. 2008.
19. Cheong KH, Lee MY, Kang SK, et al. Statistical quality control for volumetric modulated arc therapy (VMAT) delivery by using the machine's log data. J. Kor. Phys. Soc. (Article in press, 2015).
20. Rah JE, Shin D, Oh DH, Kim TH, Kim GY. Feasibility study of using statistical process control to customized quality assurance in proton therapy. Med. Phys. 41(9):092105. 2014.

21. Pawlicki T, Whitaker M, Boyer AL. Statistical process control for radiotherapy quality assurance. Med. Phys. 32(9):2777–2786. 2005.

22. http://Cran.r-project.org/index.html
23. http://www.hanyang.ac.kr/english/ezspc.html
Go to : 
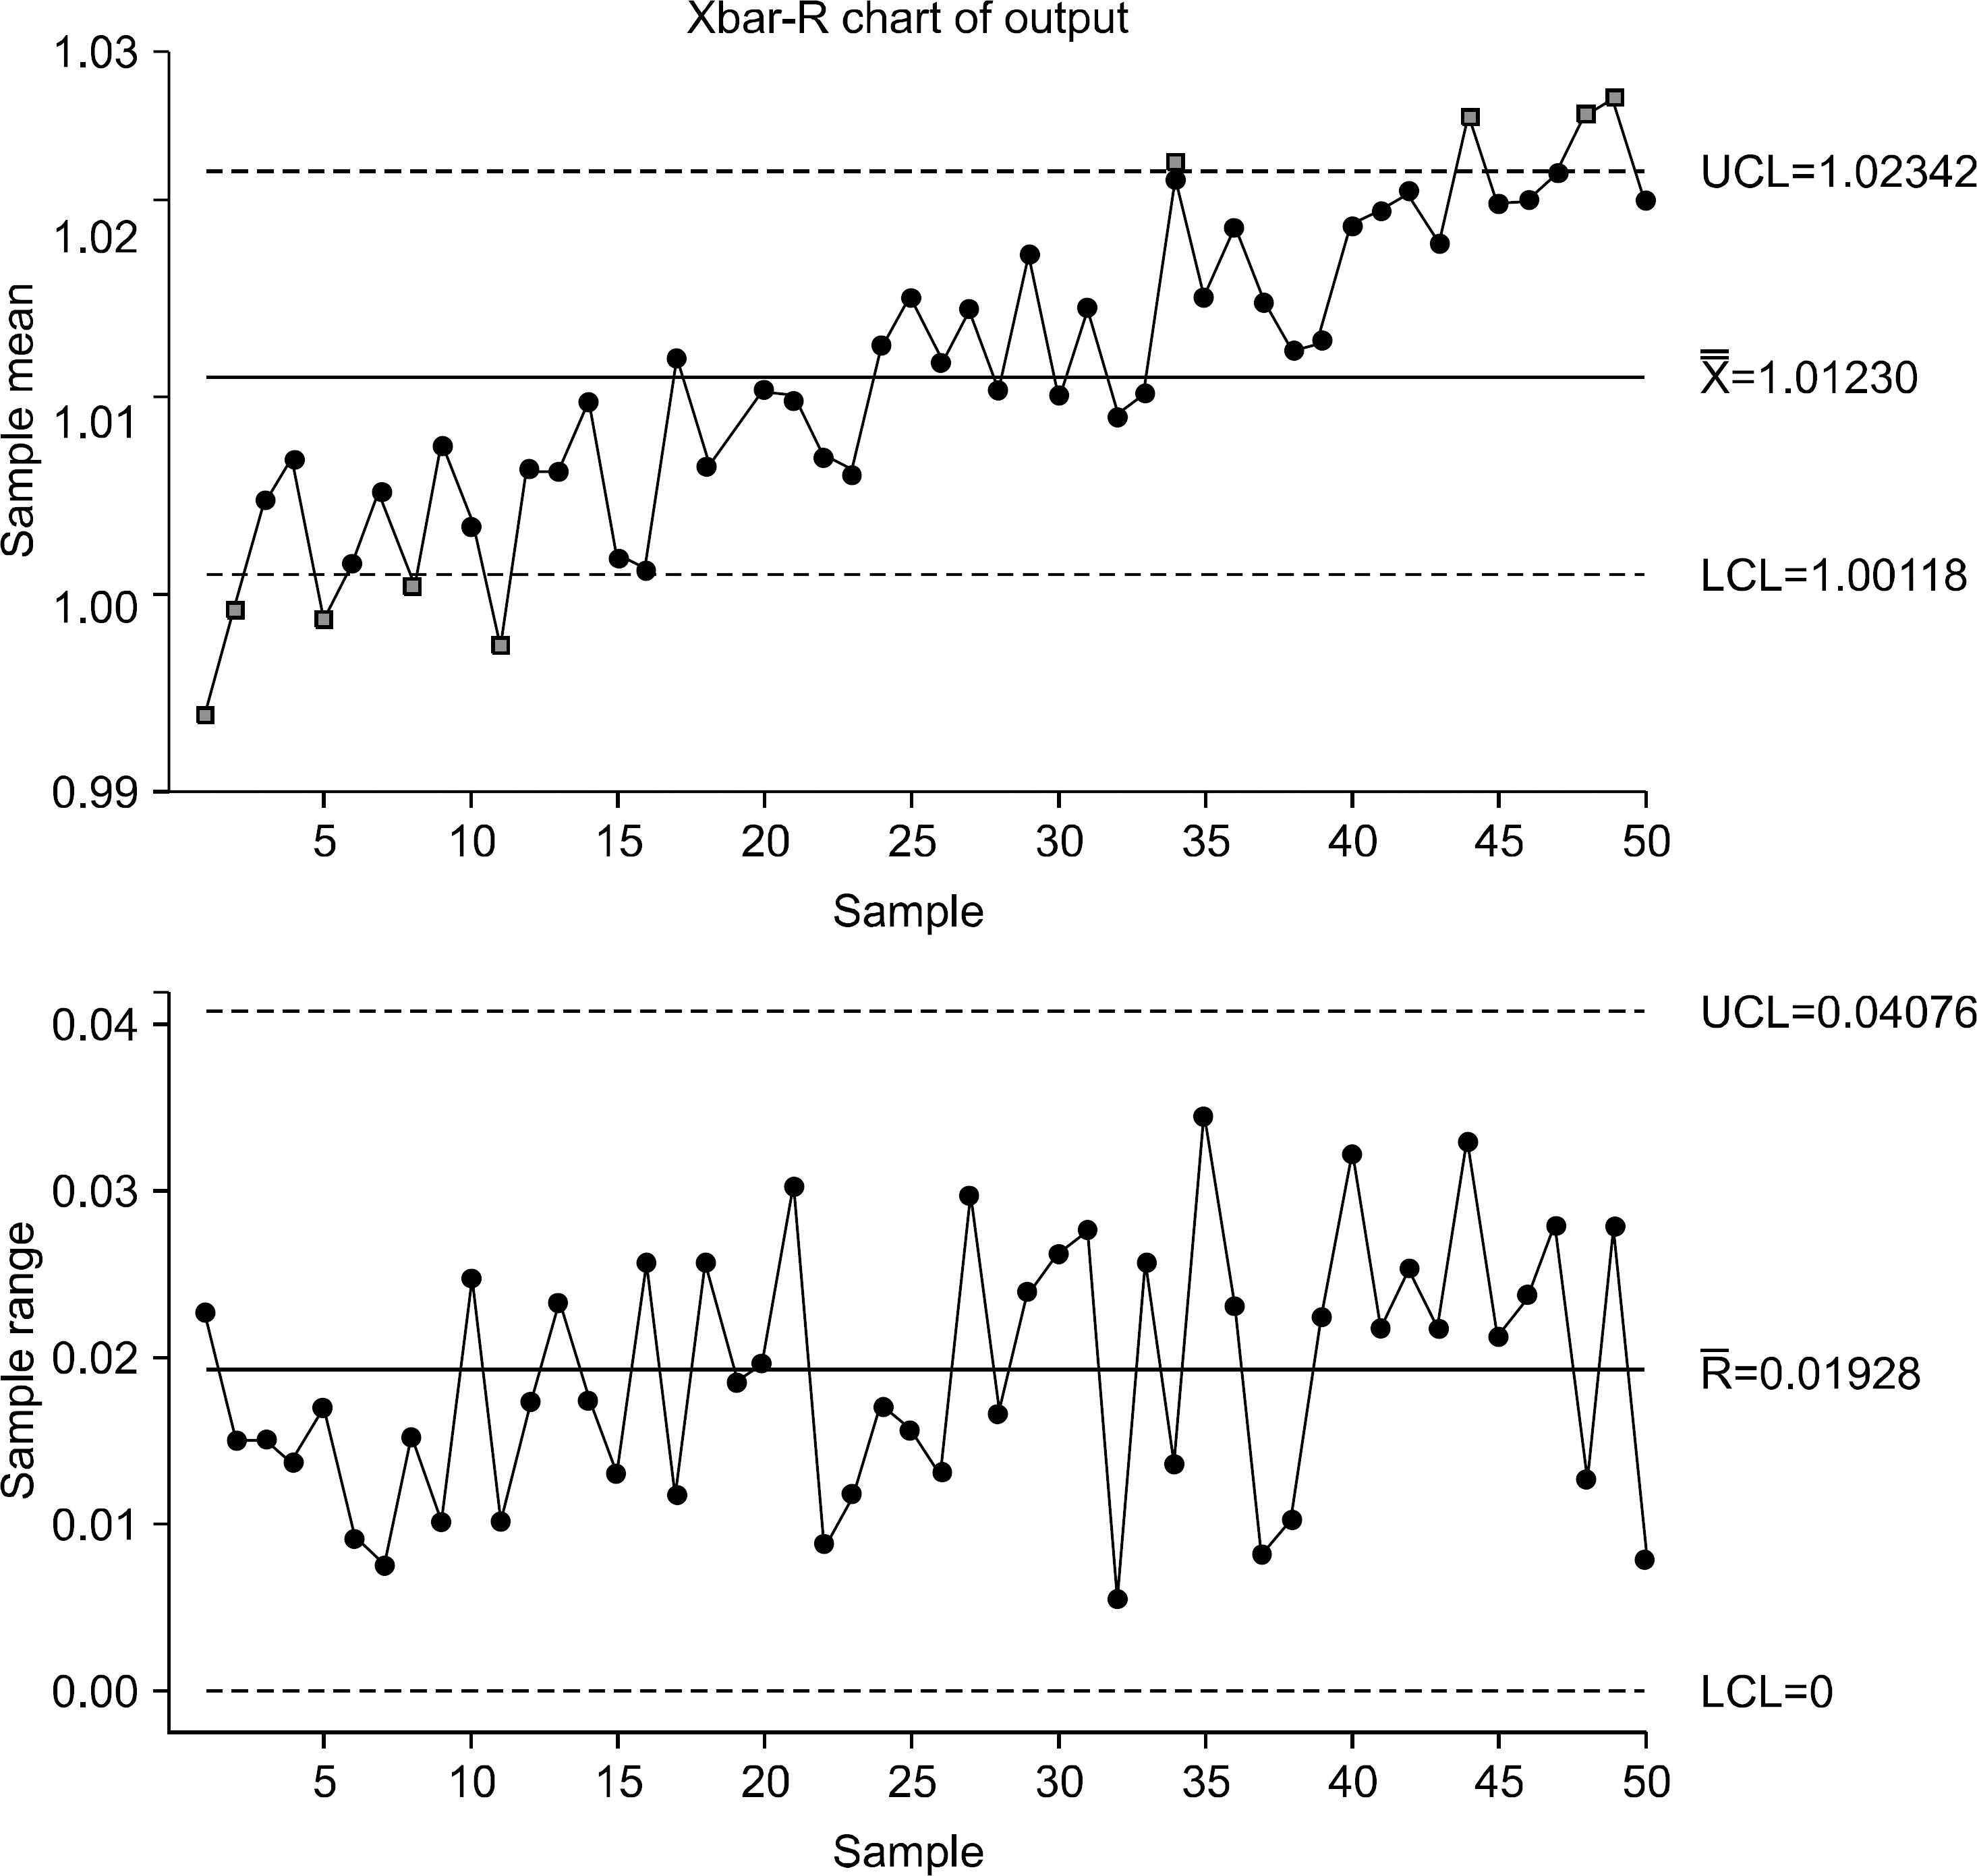 | Fig. 1. -R chart of the daily output data (Table 4); center line (CL), upper control level (UCL) and upper control level (LCL) for chart and R chart were calculated by using all weeks' data. |
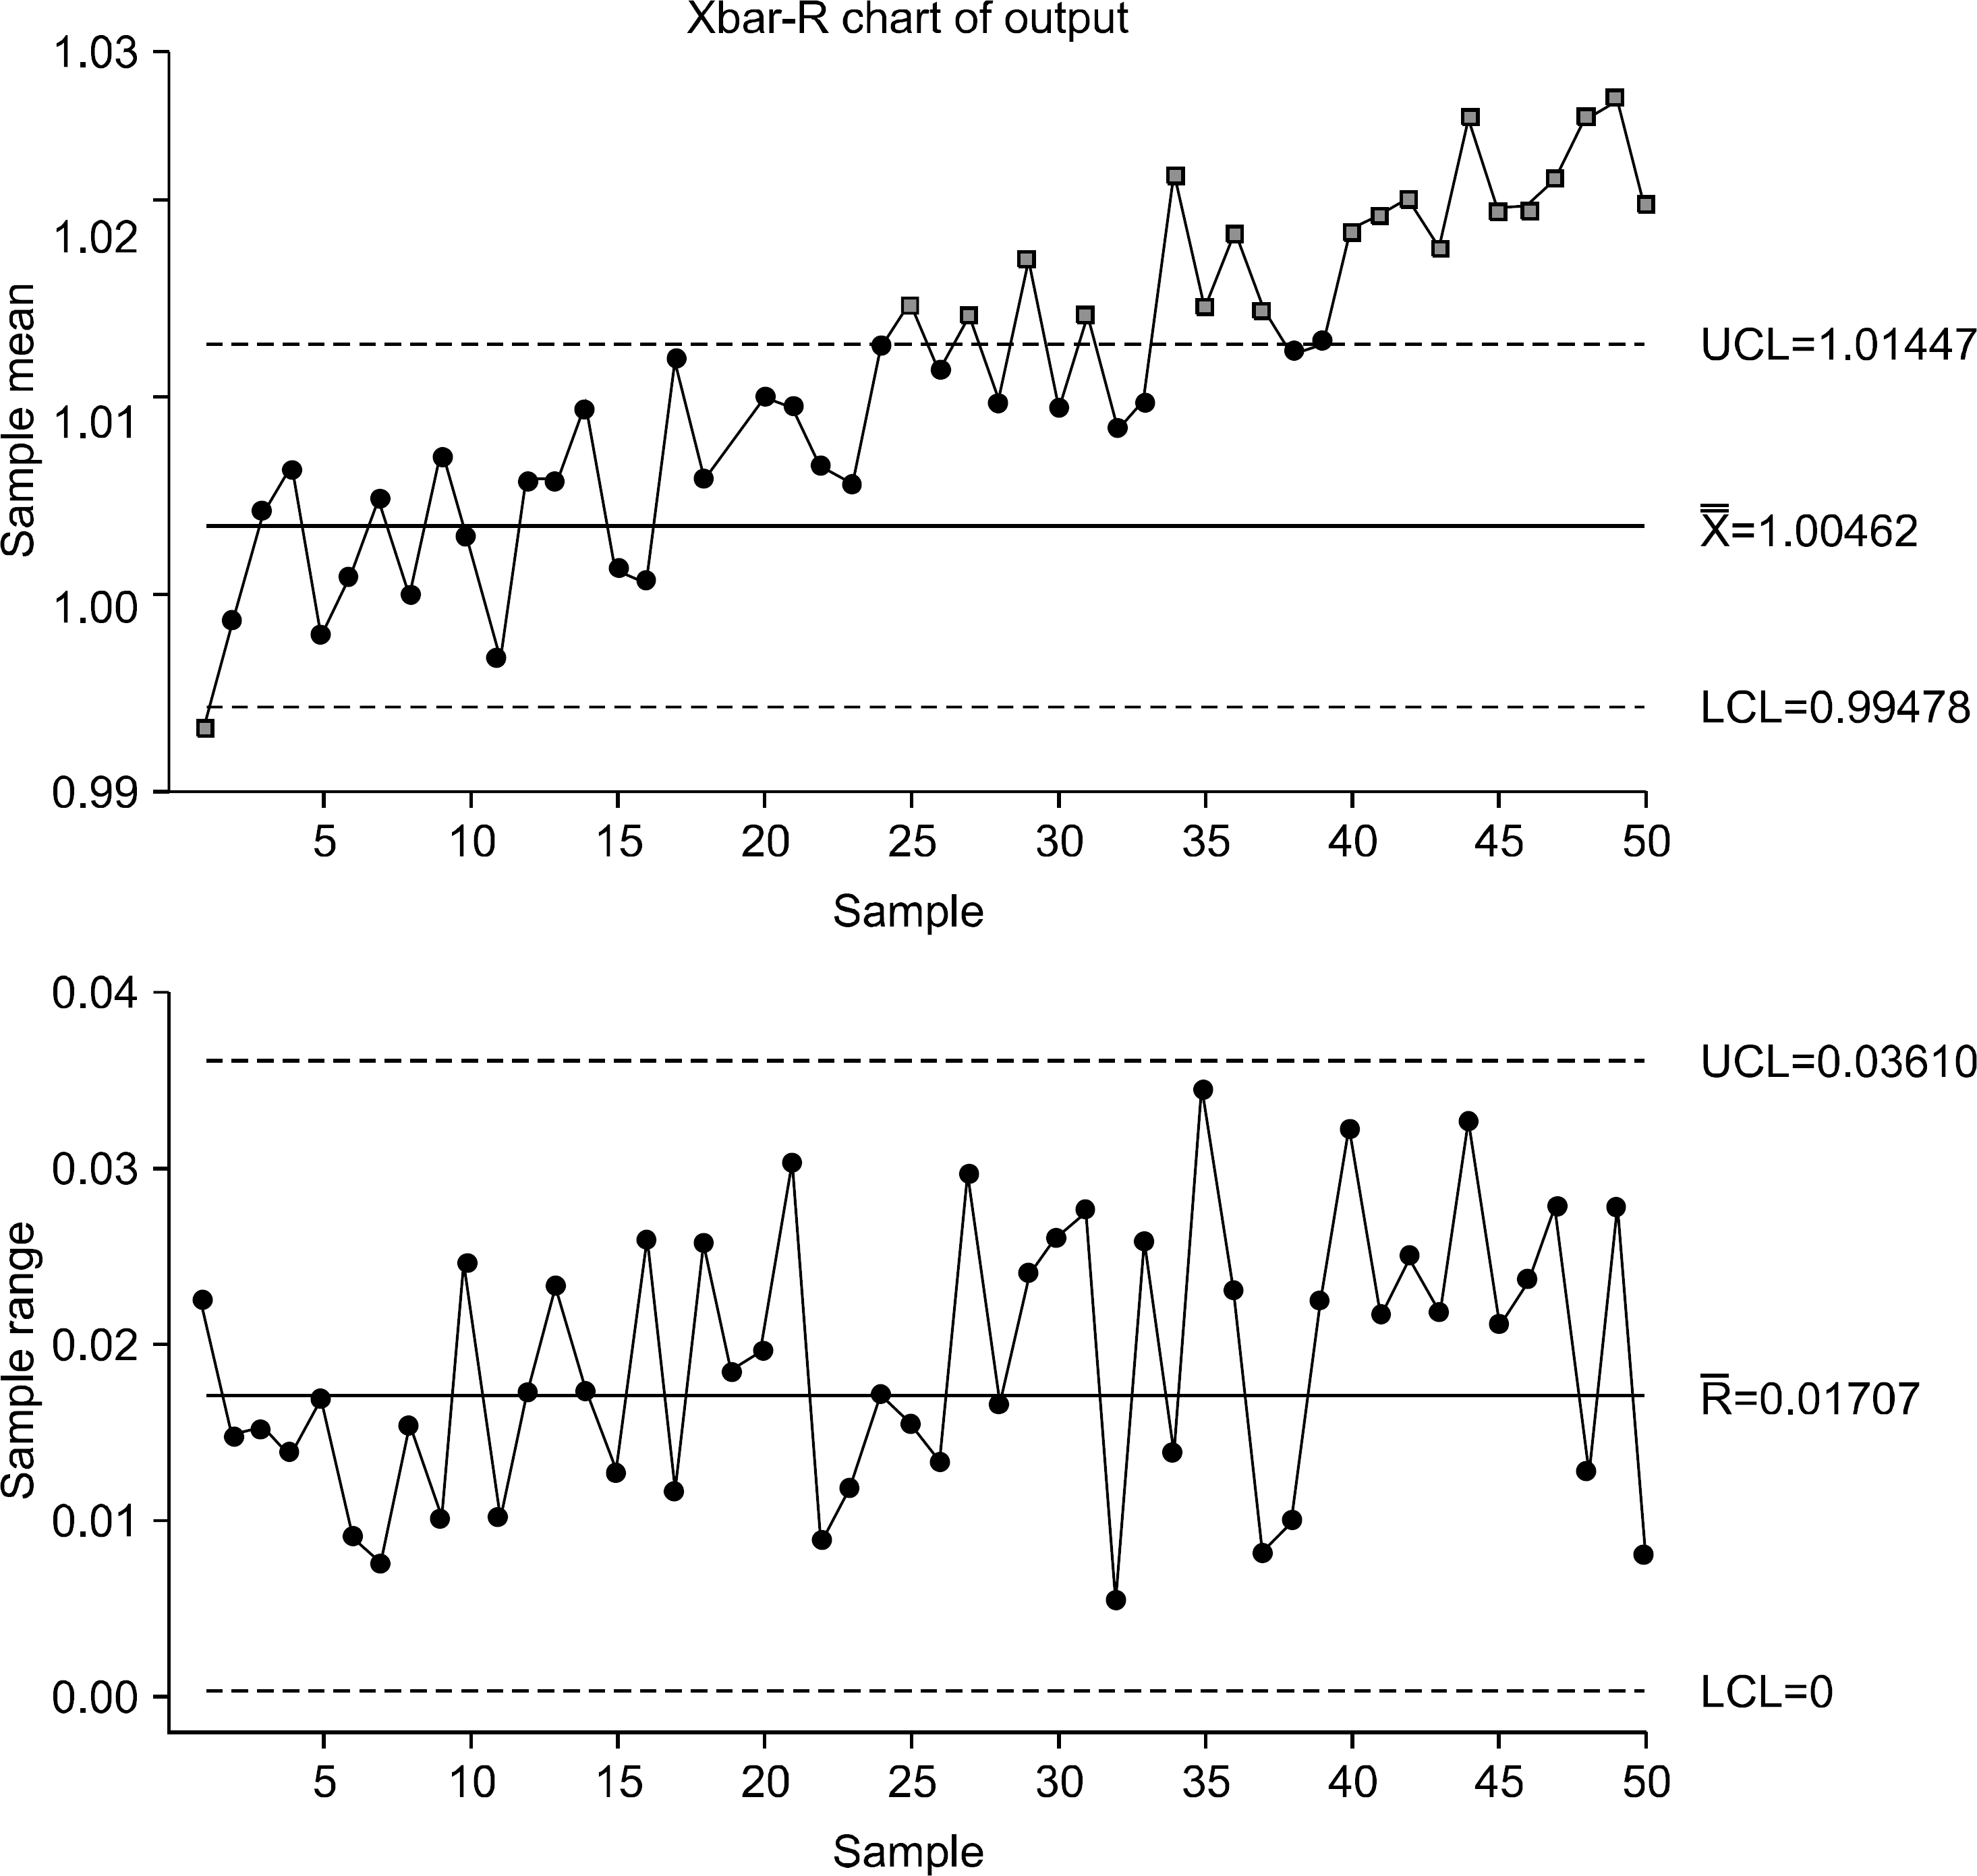 | Fig. 2. -R chart of the daily output data (Table 4); center line (CL), upper control level (UCL) and upper control level (LCL) for chart and R chart were calculated by using first 20 weeks' data. |
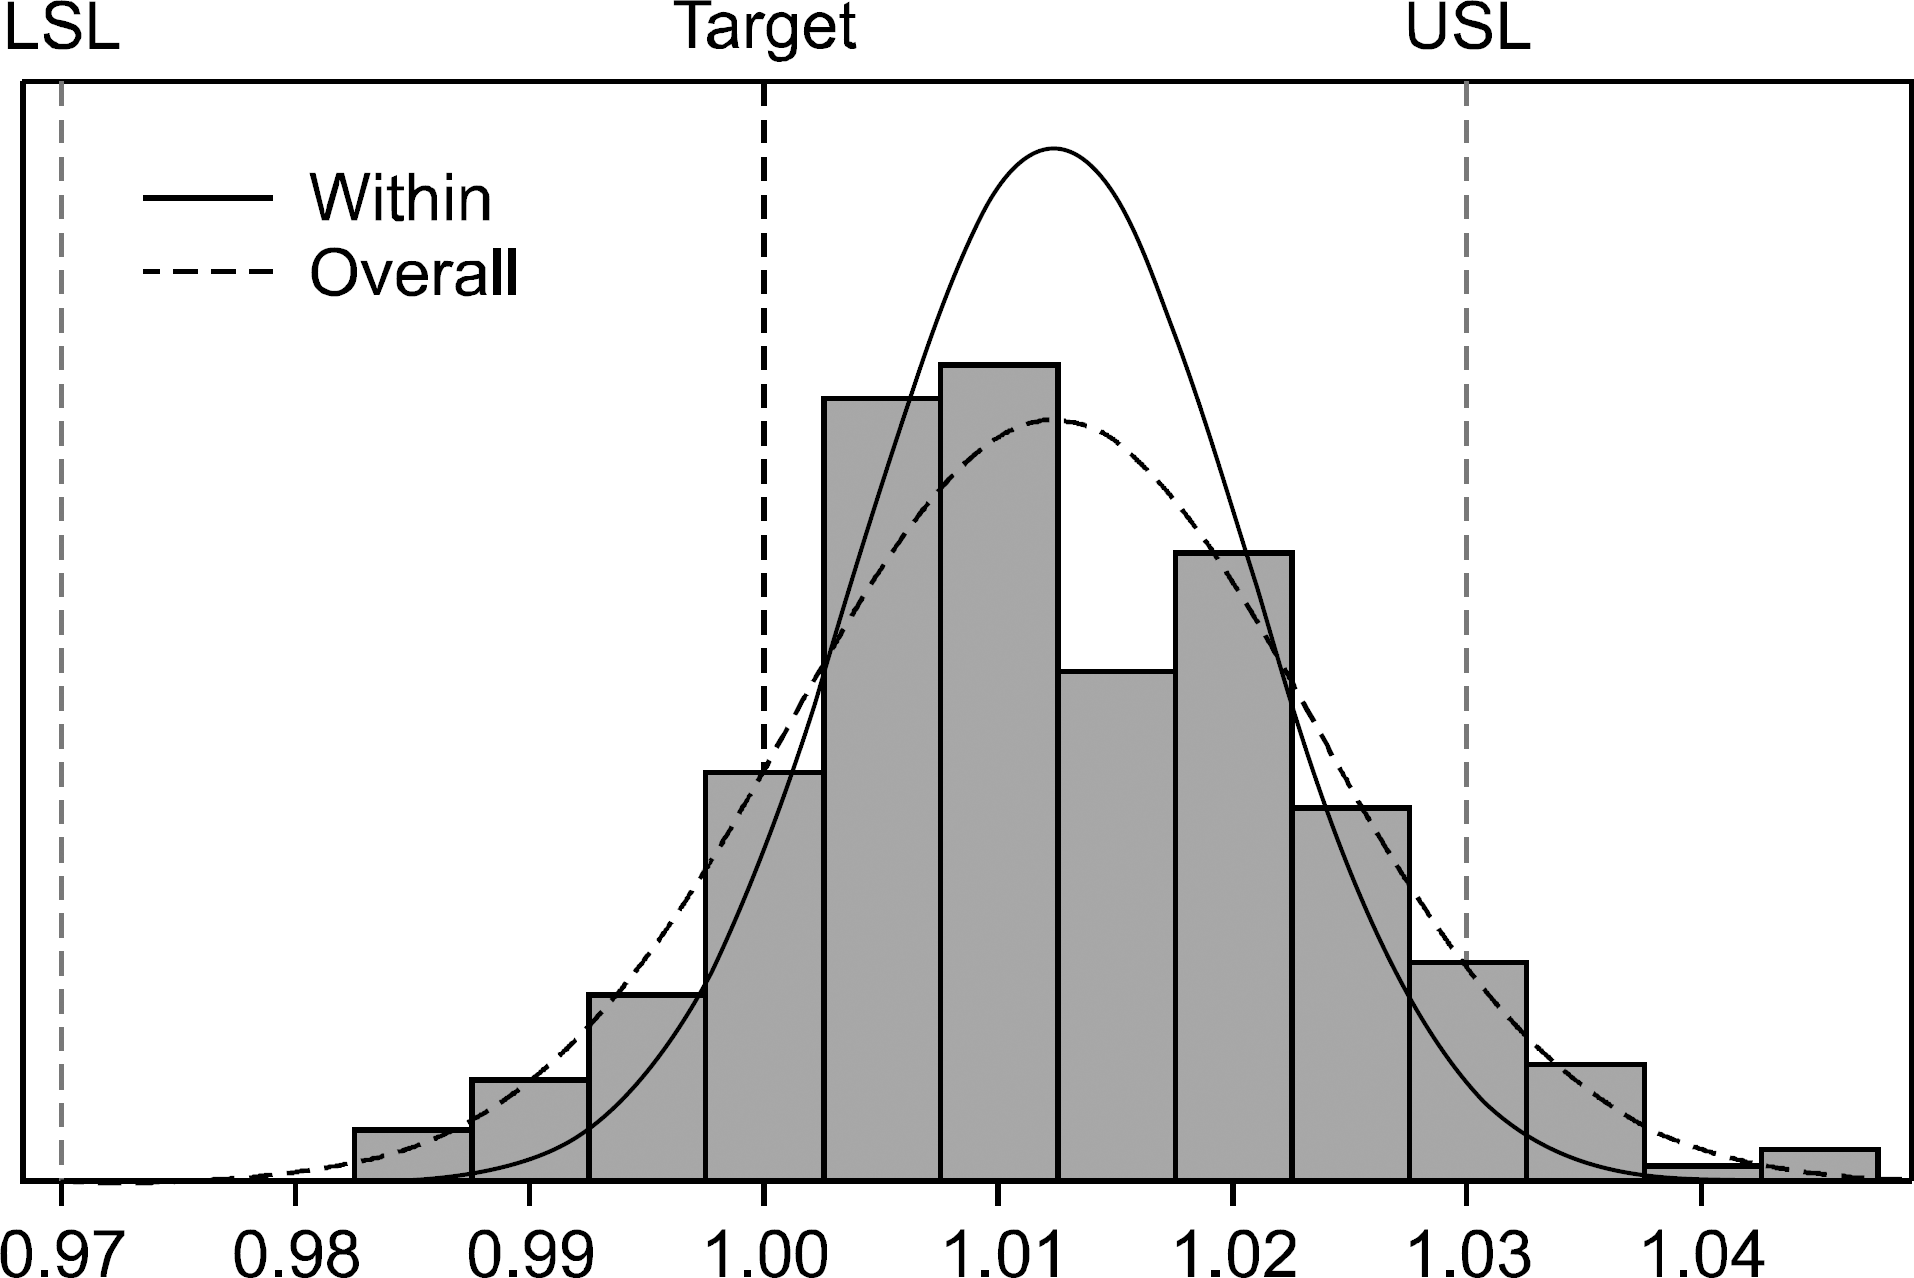 | Fig. 3.Histogram and Gaussian distributions (within: solid line, overall: dashed line) of the daily output data (Table 4); upper and lower specification levels (USL and LSL) were set to ±3%, and target value was set to 1. The data were shifted toward USL. |
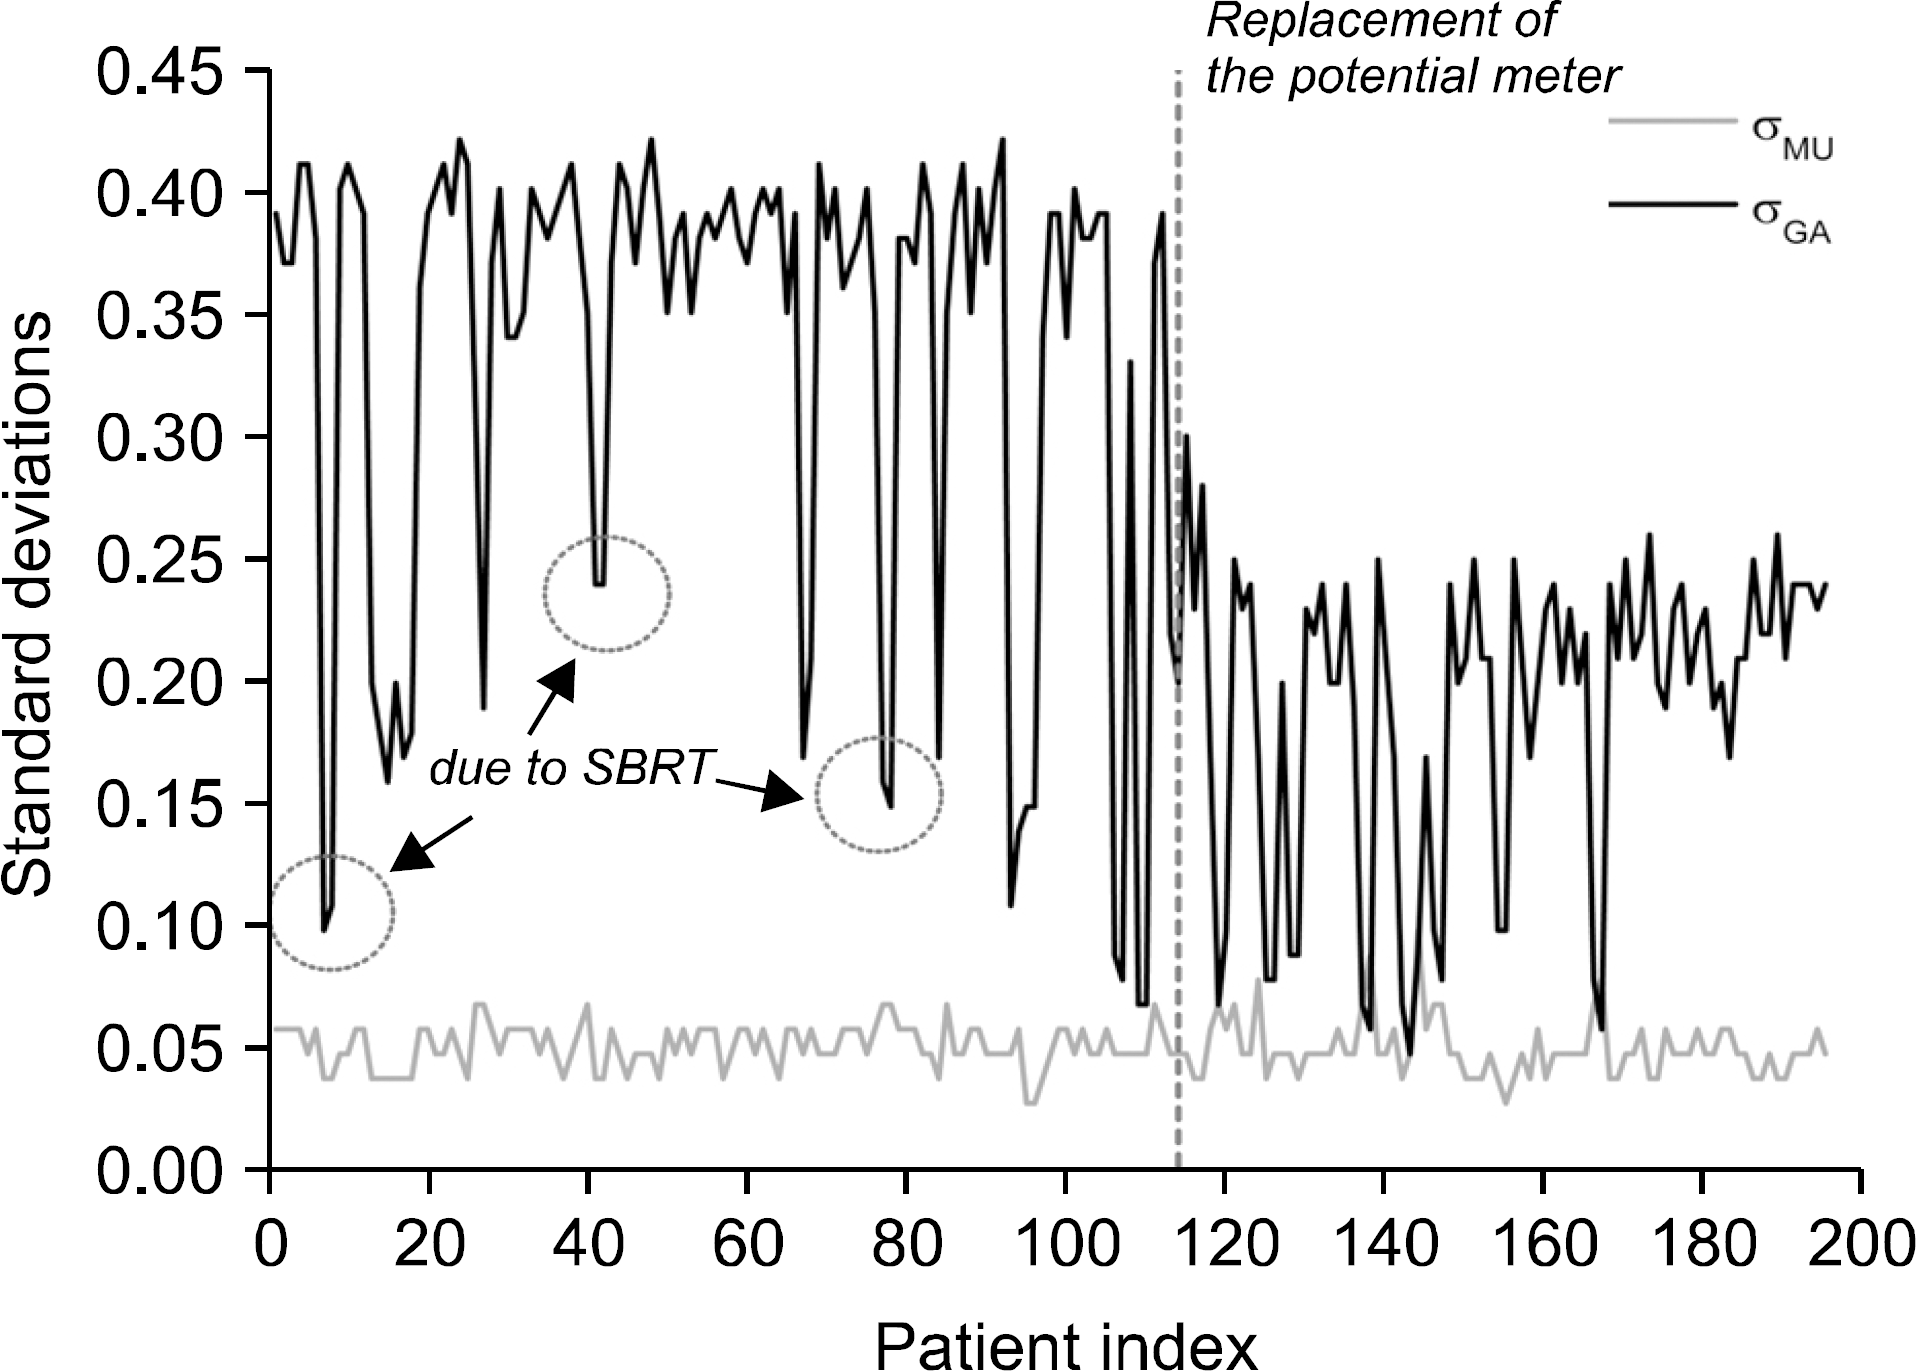 | Fig. 5.Overall variations of σMU and σGA. Time series for σMU and σGA were quite stable regardless of the treatment site. There were many valleys in the graph due to SBRT cases wherein the gantry's rotation speed was slower than in IMRT ones; thus, the σGA was relatively smaller than it was in IMRT. Also, there is a step change that possibly due to the replacement of the potential meter for the gantry's rotational position. Accordingly, the general σGA decreased from 0.4 to 0.2 and then stabilized. |
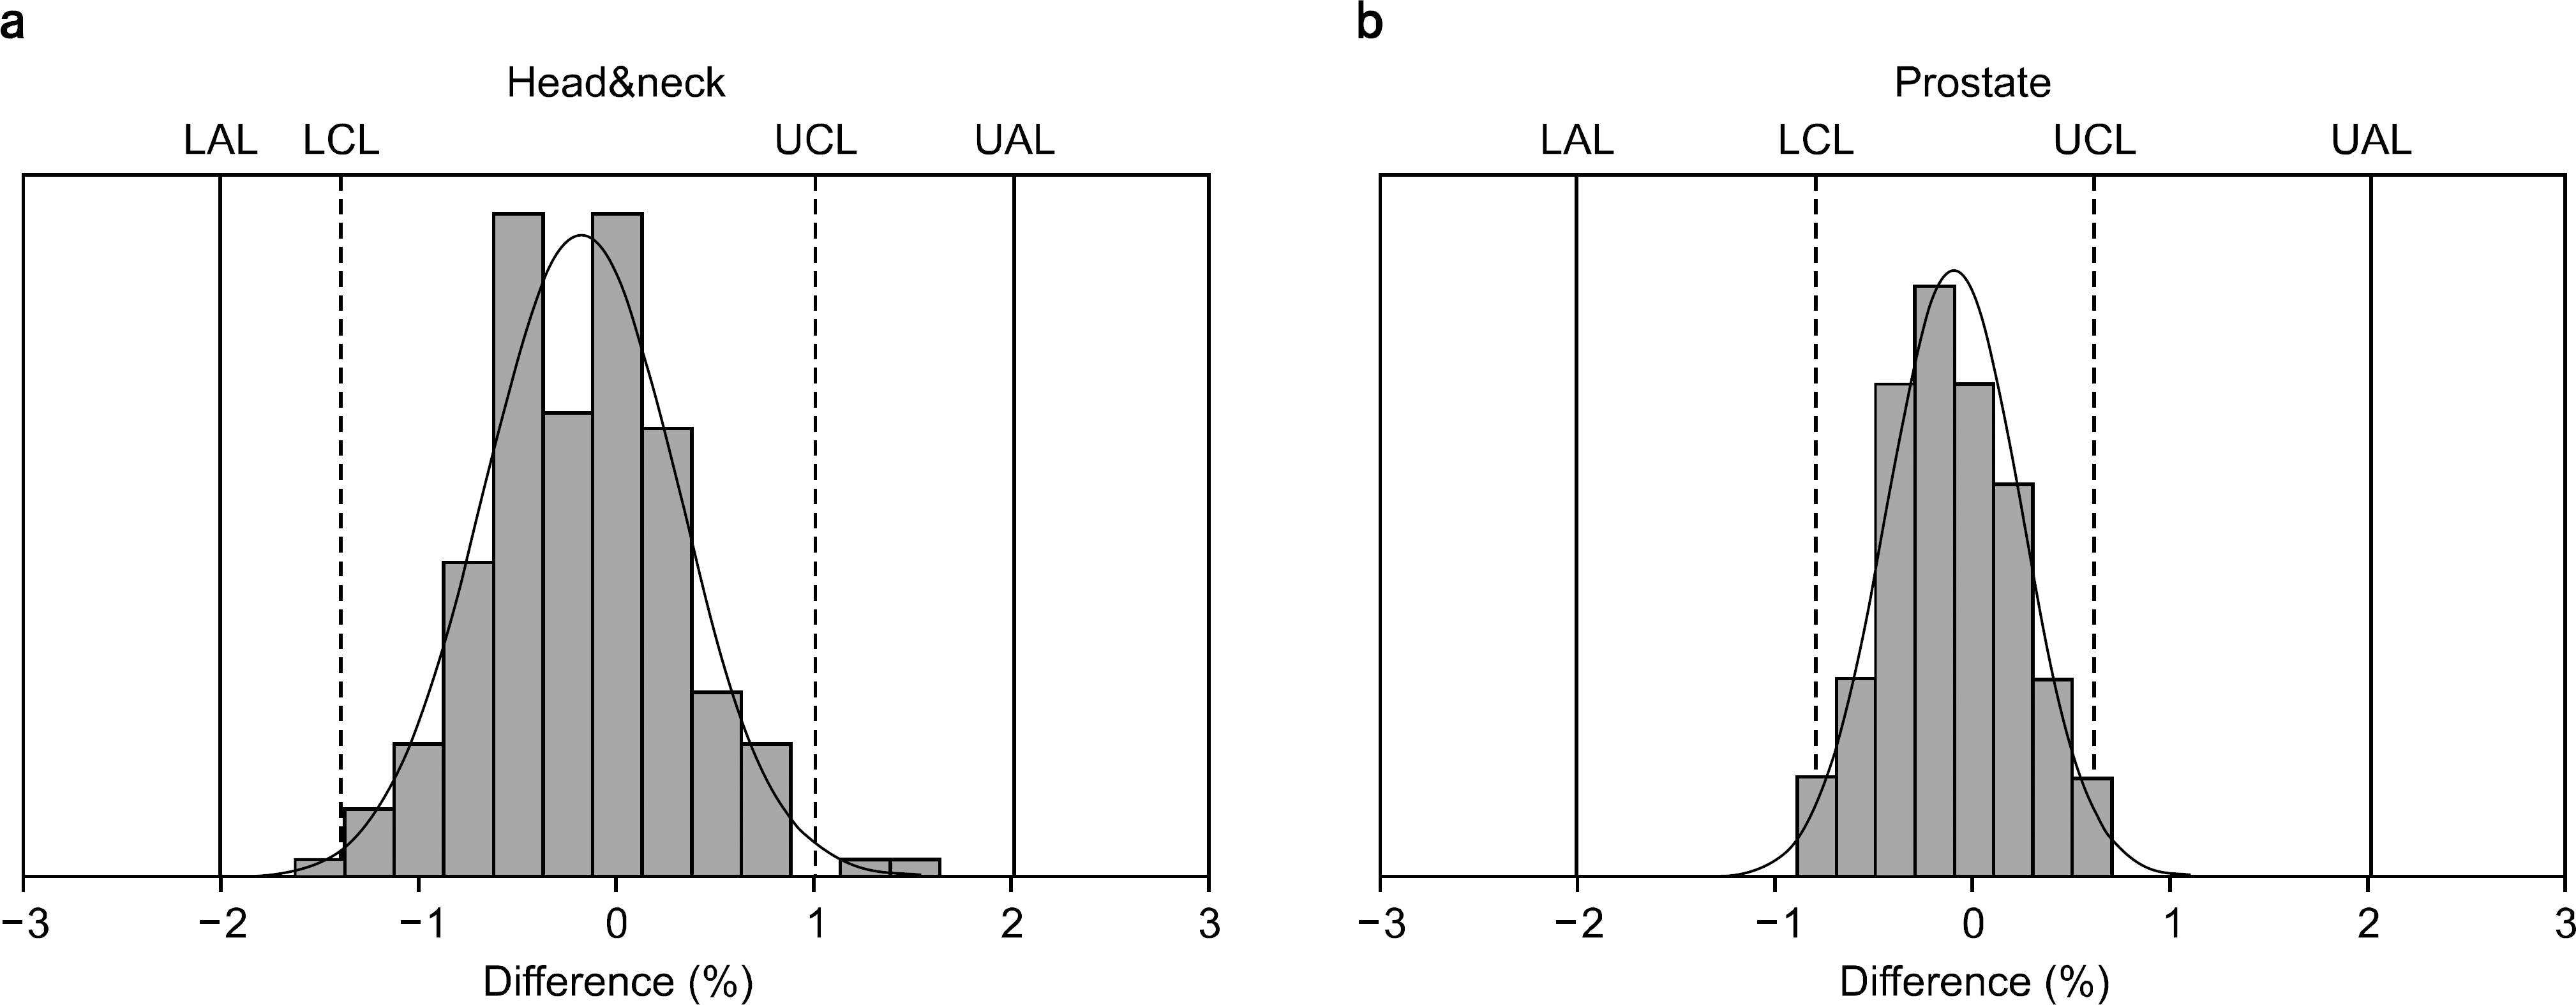 | Fig. 6.Histogram of patient-specific range measurements with tolerance levels (vertical dashed lines) in the treatment sites: (a) head and neck; (b) prostate cases. The customized action limits (vertical solid lines) is ±2%. |
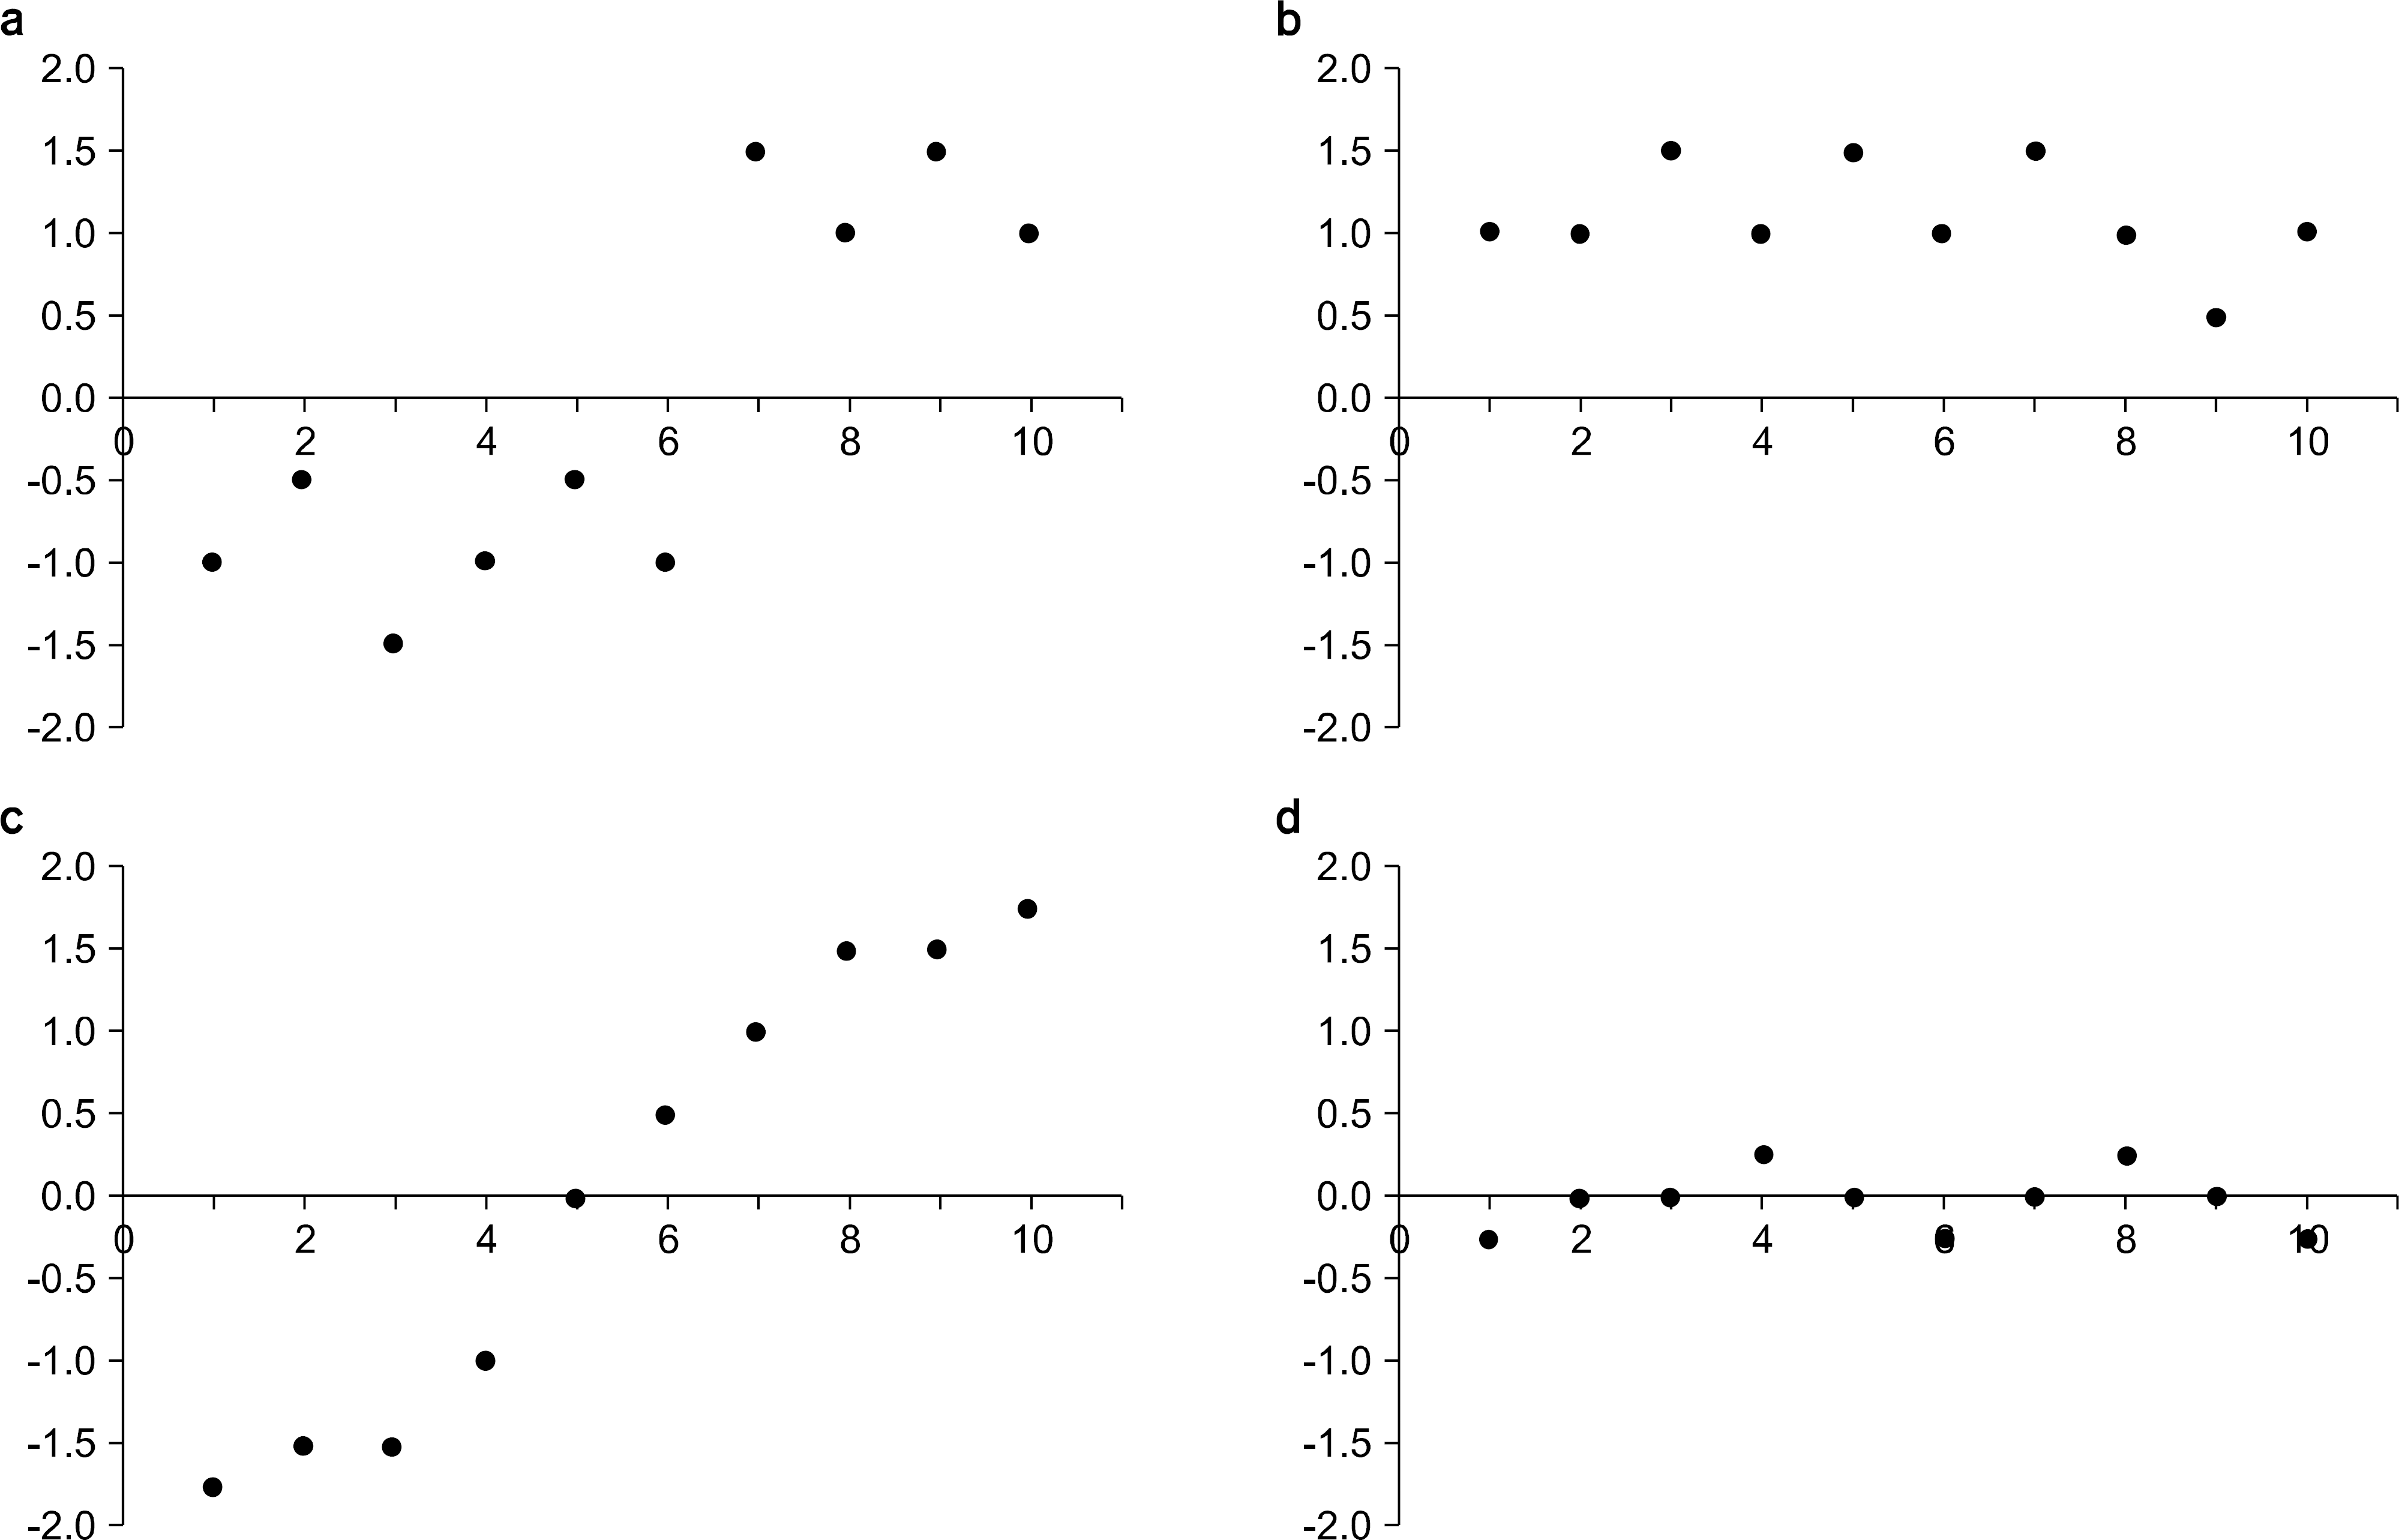 | Fig. 7.Some patterns of process behavior charts; (a) step change, (b) bias, (c) drift, (d) in control. |
Table 1.
Types of process behavior charts (PBC) those are useful in radiation therapy field.
Table 5.
The control limits of the X chart using all first 50 plans and with out-of-control points removed for nasopharyngeal carcinoma IMRT and VMAT plans.


 PDF
PDF ePub
ePub Citation
 Print
Print


 XML Download